INVESTOR PRESENTATION| NOVEMBER 2021 - The Marcus ...

Page created by Elizabeth Reeves
 
CONTINUE READING
INVESTOR PRESENTATION| NOVEMBER 2021 - The Marcus ...
I N V E S T O R P R E S E N TAT I O N | N O V E M B E R 2 0 2 1
INVESTOR PRESENTATION| NOVEMBER 2021 - The Marcus ...
Forward Looking Statement
    Certain matters discussed in this presentation are “forward-looking statements” intended to qualify for the safe harbors from liability established by the Private Securities Litigation Reform Act of
    1995. These forward-looking statements may generally be identified as such because the context of such statements include words such as we “believe,” “anticipate,” “expect” or words of similar
    import. Similarly, statements that describe our future plans, objectives or goals are also forward-looking statements. Such forward-looking statements are subject to certain risks and uncertainties
    which may cause results to differ materially from those expected, including, but not limited to, the following: (1) the adverse effects of the COVID-19 pandemic on our theatre and hotels and
    resorts businesses, results of operations, liquidity, cash flows, financial condition, access to credit markets and ability to service our existing and future indebtedness; (2) the duration of the
    COVID-19 pandemic and related government restrictions and social distancing requirements and the level of customer demand following the relaxation of such requirements; (3) the availability,
    in terms of both quantity and audience appeal, of motion pictures for our theatre division (particularly following the COVID-19 pandemic, during which the production of new movie content
    temporarily ceased and release dates for motion pictures have been postponed), as well as other industry dynamics such as the maintenance of a suitable window between the date such motion
    pictures are released in theatres and the date they are released to other distribution channels; (4) the effects of adverse economic conditions in our markets, including but not limited to, those
    caused by the COVID-19 pandemic; (5) the effects of adverse economic conditions, including but not limited to, those caused by the COVID-19 pandemic, on our ability to obtain financing on
    reasonable and acceptable terms, if at all; (6) the effects on our occupancy and room rates caused by the COVID-19 pandemic and the effects on our occupancy and room rates of the relative
    industry supply of available rooms at comparable lodging facilities in our markets once hotels and resorts have more fully reopened; (7) the effects of competitive conditions in our markets; (8)
    our ability to achieve expected benefits and performance from our strategic initiatives and acquisitions; (9) the effects of increasing depreciation expenses, reduced operating profits during major
    property renovations, impairment losses, and preopening and start-up costs due to the capital intensive nature of our business; (10) the effects of weather conditions, particularly during the
    winter in the Midwest and in our other markets; (11) our ability to identify properties to acquire, develop and/or manage and the continuing availability of funds for such development; (12) the
    adverse impact on business and consumer spending on travel, leisure and entertainment resulting from terrorist attacks in the United States, other incidents of violence in public venues such as
    hotels and movie theatres or epidemics (such as the COVID-19 pandemic); and (13) a disruption in our business and reputational and economic risks associated with civil securities claims
    brought by shareholders. These statements are not guarantees of future performance and are subject to risks, uncertainties and other factors, including developments related to the COVID-19
    pandemic, some of which are beyond our control and difficult to predict and could cause actual results to differ materially from those expressed or forecasted in the forward-looking statements.
    Our forward-looking statements are based upon our assumptions, which are based upon currently available information, including assumptions about our ability to manage difficulties associated
    with or related to the COVID-19 pandemic; the assumption that our theatre closures, hotel closures and restaurant closures are not expected to be permanent or to re-occur; the continued
    availability of our workforce; and the temporary and long-term effects of the COVID-19 pandemic on our business. Shareholders, potential investors and other readers are urged to consider
    these factors carefully in evaluating the forward-looking statements and are cautioned not to place undue reliance on such forward-looking statements. The forward-looking statements made
    herein are made only as of the date of this presentation and we undertake no obligation to publicly update such forward-looking statements to reflect subsequent events or circumstances.

2
INVESTOR PRESENTATION| NOVEMBER 2021 - The Marcus ...
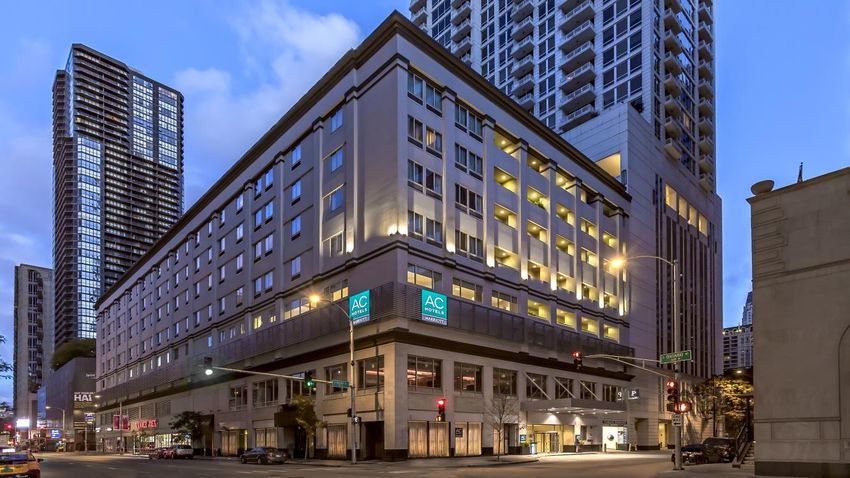
Non-GAAP Financial Measures
    Adjusted net earnings (loss) attributable to The Marcus Corporation, Adjusted net earnings (loss) per diluted common share attributable to The Marcus Corporation and Adjusted EBITDA
    have been presented in this press release as supplemental measures of financial performance that are not required by, or presented in accordance with, GAAP. The company defines
    Adjusted net earnings (loss) attributable to The Marcus Corporation as net earnings (loss) attributable to The Marcus Corporation adjusted to eliminate the impact of certain items that the
    company does not consider indicative of its core operating performance and the tax effect related to those items. The company defines Adjusted net earnings (loss) per diluted common
    share attributable to The Marcus Corporation as Adjusted net earnings (loss) attributable to The Marcus Corporation divided by diluted weighted average shares outstanding. The company
    defines Adjusted EBITDA as net earnings (loss) attributable to The Marcus Corporation before investment income or loss, interest expense, other expense, gain or loss on disposition of
    property, equipment and other assets, equity earnings or losses from unconsolidated joint ventures, net earnings or losses attributable to noncontrolling interests, income taxes and
    depreciation and amortization, adjusted to eliminate the impact of certain items that the company does not consider indicative of its core operating performance. Reconciliations of these
    measures to the equivalent measures under GAAP are set forth in the attached tables.

    Adjusted net earnings (loss) attributable to The Marcus Corporation, Adjusted net earnings (loss) per diluted common share attributable to The Marcus Corporation and Adjusted EBITDA
    are key measures used by management and the company’s board of directors to assess the company’s financial performance and enterprise value. The company believes that Adjusted net
    earnings (loss) attributable to The Marcus Corporation, Adjusted net earnings (loss) per diluted common share attributable to The Marcus Corporation and Adjusted EBITDA are useful
    measures, as they eliminate certain expenses that are not indicative of the company’s core operating performance and facilitate a comparison of the company’s core operating performance
    on a consistent basis from period to period. The company also uses Adjusted EBITDA as a basis to determine certain annual cash bonuses and long-term incentive awards, to supplement
    GAAP measures of performance to evaluate the effectiveness of its business strategies, to make budgeting decisions, and to compare its performance against that of other peer companies
    using similar measures. Adjusted net earnings, Adjusted diluted earnings per share and Adjusted EBITDA are also used by analysts, investors and other interested parties as performance
    measures to evaluate industry competitors.
    Adjusted net earnings (loss) attributable to The Marcus Corporation, Adjusted net earnings (loss) per diluted common share attributable to The Marcus Corporation and Adjusted EBITDA
    are non-GAAP measures of the company’s financial performance and should not be considered as alternatives to net earnings (loss) or diluted earnings (loss) per share as a measure of
    financial performance, or any other performance measure derived in accordance with GAAP and they should not be construed as an inference that the company’s future results will be
    unaffected by unusual or non-recurring items. Additionally, Adjusted net earnings (loss) attributable to The Marcus Corporation and Adjusted EBITDA are not intended to be measures of
    liquidity or free cash flow for management’s discretionary use. In addition, these non-GAAP measures exclude certain non-recurring and other charges. Each of these non-GAAP measures
    has its limitations as an analytical tool, and you should not consider them in isolation or as a substitute for analysis of the company’s results as reported under GAAP. In evaluating Adjusted
    net earnings (loss) attributable to The Marcus Corporation, Adjusted net earnings (loss) per diluted common share attributable to The Marcus Corporation and Adjusted EBITDA, you should
    be aware that in the future the company will incur expenses that are the same as or similar to some of the items eliminated in the adjustments made to determine Adjusted net earnings
    (loss) attributable to The Marcus Corporation, Adjusted net earnings (loss) per diluted common share attributable to The Marcus Corporation and Adjusted EBITDA, such as acquisition
    expenses, preopening expenses, accelerated depreciation, impairment charges and other adjustments. The company’s presentation of Adjusted net earnings (loss) attributable to The
    Marcus Corporation, Adjusted net earnings (loss) per diluted common share attributable to The Marcus Corporation and Adjusted EBITDA should not be construed to imply that the
    company’s future results will be unaffected by any such adjustments. Definitions and calculations of Adjusted net earnings (loss), Adjusted diluted earnings (loss) per share and Adjusted
    EBITDA differ among companies in our industries, and therefore Adjusted net earnings (loss), Adjusted diluted earnings (loss) per share and Adjusted EBITDA disclosed by the company
    may not be comparable to the measures disclosed by other companies.

3
INVESTOR PRESENTATION| NOVEMBER 2021 - The Marcus ...
A Leader in Lodging and Entertainment
  Founded in 1935 and headquartered in Milwaukee, Wisconsin

                                                                                         LTM by Division
                                                                                                              6%

                                                                              48% Revenues*                  Operating
                                                                                               52%             Loss
• Fourth largest U.S. exhibitor
• 1,064 screens at 85 locations in 17 states                                                                    94%

                                                         Fiscal 2019 by Division(1) – Pre-Pandemic

                                                                                                 12%
                                                              32%                                                     22%

• Portfolio of 19 distinctive properties                          Revenues*                     Operating
                                                                                                 Income
                                                                                                                         Adjusted
                                                                                                                         EBITDA
• Manage ~5,400 rooms in 9 states                                                68%
                                                                                                       88%                     78%

 4                                                      (1) As of December 26, 2019
                                                        * Revenues exclude Corporate of 0.1%
INVESTOR PRESENTATION| NOVEMBER 2021 - The Marcus ...
Company Overview
FY 2019 Revenues:                                     LTM Revenues:
     $820.9M                                            $325.9M

    FY 2019 Adjusted                                     LTM Adjusted
        EBITDA:                                            EBITDA:
     $155.2M(1)                                        $(21.9)M(1)

      FY 2019 Adj.                                        LTM Adj.
     EBITDA Margin:                                    EBITDA Margin:
        18.9%(1)                                           (6.7)%(1)

      Market Cap:                                                     Since
     ~$616.3M                                                         1993
         (as of 11/4/2021)

      (1) Adjusted EBITDA is a Non-GAAP measurement equal to operating income plus depreciation and
      amortization, impairment charges, non-cash share-based compensation and certain non-recurring
5     expenses. Refer to non-GAAP reconciliation in the appendix for further information;
INVESTOR PRESENTATION| NOVEMBER 2021 - The Marcus ...
Diversified
       business
       platform
                      Outperform respective
                      markets and industries

                           Focused and disciplined
                           growth strategy

    Investment                 Strong balance sheet
                               with significant
      Thesis                   liquidity

                            Significant real estate
                            assets

                       Long-term track
                       record of
                       success
     Consistent
     shareholder returns
6
INVESTOR PRESENTATION| NOVEMBER 2021 - The Marcus ...
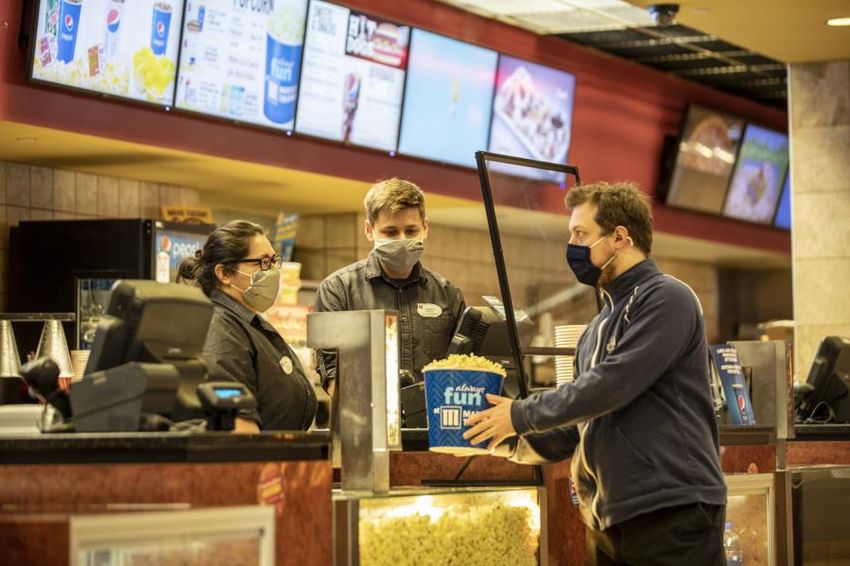
Strong, Stable Senior Management Team

 Gregory S. Marcus        Thomas F. Kissinger       Douglas A. Neis      Rolando B. Rodriguez       Michael Evans            Kim M. Lueck              John E. Murray
    President and         Senior Executive Vice       Executive Vice         Executive Vice        President, Marcus    Chief Information Officer   Vice President Human
Chief Executive Officer    President, General      President and Chief   President, The Marcus      Hotels & Resorts        Joined in 1997                Resources
 Joined March 1992        Counsel and Secretary      Financial Officer       Corporation and     Joined January 2020                                 Joined in April 2016
                           Joined August 1993     Joined February 1986    Chairman, President     More than 20 years
                                                                            and CEO, Marcus       industry experience
                                                                          Theatres Corporation
                                                                           Joined August 2013
                                                                            ~40 years industry
                                                                               experience

  7
INVESTOR PRESENTATION| NOVEMBER 2021 - The Marcus ...
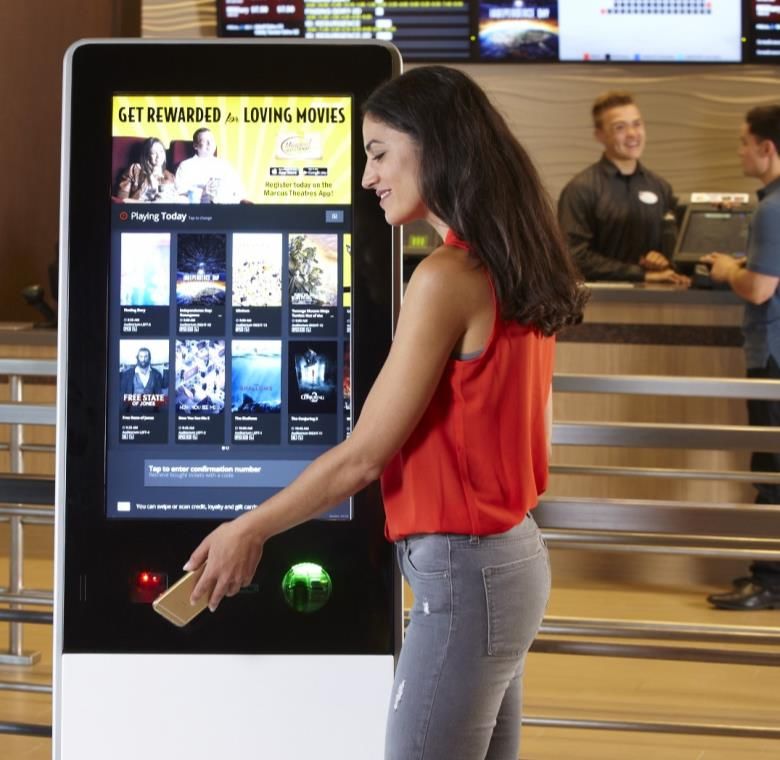
The Marcus Corporation Returns to Profitability
in Q3 2021
                      Operating income of $6.3 million
                          Net income of $1.8 million
                      Adjusted EBITDA of $24.5 million
      Marcus Theatres                         Marcus Hotels & Resorts
• Theatre revenues, as a pct. of 2019      • Hotel revenues, as a pct. of 2019
  revenues, increased to ~59%                revenues, increased to 88% during
  during Q3 2021                             Q3 2021
• Significantly improved operating         • Operating income of $13.5 million
  loss in third quarter of fiscal 2021     • $17 million of Adjusted EBITDA
• $11 million of Adjusted EBITDA           • Second straight quarter of
8                                            positive Adjusted EBITDA
INVESTOR PRESENTATION| NOVEMBER 2021 - The Marcus ...
85-Year History of Prudent Balance Sheet
and Liquidity Management
• Approach has been and will remain thoughtful, opportunistic, and
  focused long-term
    • Match our debt portfolio to our asset base
    • Assets primarily of fixed and long-lived assets
    • Strive to have a significant portion of our debt portfolio fixed and
      long

9
INVESTOR PRESENTATION| NOVEMBER 2021 - The Marcus ...
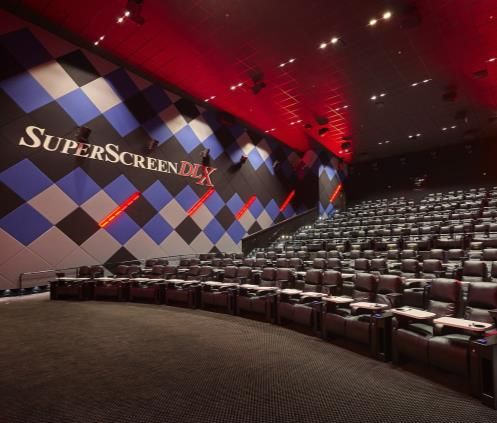
Entered Pandemic from Position of Strength
• Historically strong and consistent cash flow                                                                                                                         Debt Ratios
• Approx. $197 million in cash and revolving credit                                                               50%                       Debt/Capitalization %                    Net Debt to Adjusted EBITDA Ratio         10
  availability (as of 9/30/2021)
• Income tax refund of approximately $22 million                                                                                    40%                                                                              40%
                                                                                                                  40%                                                                                                          8
  expected in fourth quarter of fiscal 2021                                                                                                                                                                  37%

                                                                                                                                                           33%
• Amended Credit Agreement, extended term loan
  and added convertible senior notes to capital                                                                   30%                                                                                                          6
                                                                                                                                                                                   26%
  structure in Sept. 2020 (see appendix for details)
• Amended Credit Agreement on 7/13/2021 and
                                                                                                                  20%                                                                                                          4
  made an early payment on term loan facility,
  reducing the balance of the facility to $50 million
                                                                                                                                      2.2
  and extending the term loan facility’s maturity date
                                                                                                                  10%                                                                                                          2
  to Sept. 2022                                                                                                                                               1.5                  1.3

• Continue to be positioned to meet obligations as
  they come due and sustain operations throughout                                                                  0%                                                                                                          0
  2021 and 2022, even if properties continue to                                                                               12/28/2017              12/27/2018             12/26/2019              12/31/2020    9/30/2021
  generate significantly reduced revenues
     Note: Adjusted EBITDA is a non-GAAP measurement equal to operating income plus depreciation/amortization, impairment charges and certain nonrecurring expenses. Net debt is a non-GAAP
10   measurement equal to short-term borrowings plus long-term debt net of debt issuance costs, minus cash and cash equivalents. Refer to non-GAAP reconciliation in the appendix for further information.
Unique Real Estate Ownership Profile
 In addition to our owned hotels, unlike most of our peers, we own the underlying real estate for the majority of our theatres

• Real estate ownership enables us to      100%
  quickly react to changing theatre trends
                                                                           23%
• Reduces our monthly fixed lease                                                                                     38%
  payments                                       75%

• Provides significant underlying credit
  support                                                                                                                               91%
                                                 50%
• Surplus real estate may be monetized if                                  77%
  opportunities arise                                                                                                 62%
                                                 25%
     • $13.6 million of asset sales
       proceeds in 2020 and 2021 YTD
                                                                                                                                         9%
                                                  0%
     • Possibility of $15-30 million of
                                                                        Marcus                                 Marcus                Peer Group*
       additional sales of surplus and
                                                                        (legacy)                           w/ Movie Tavern
       non-core real estate during next
       12-15 months                                                                                       Owned             Leased

                                                   *Represents an estimate of AMC, Regal and Cinemark combined,
                                                    based upon available public filings.
11
                                                   Note: Marcus percentages based upon number of screens as of 9/30/2021
Marcus Theatres

12
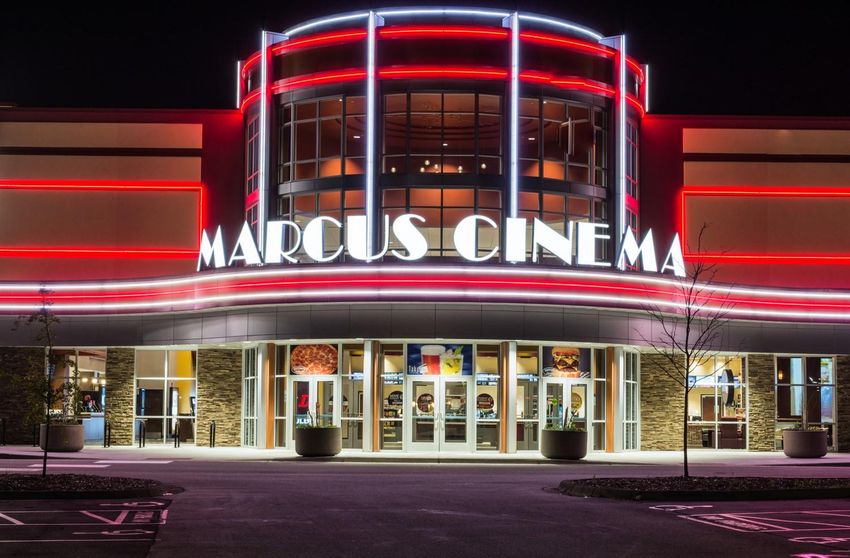
Leading U.S. Theatre Exhibitor
                                                                       Marcus Theatres by Location(1)
                                                  1,064 screens                      ND

                            Fourth
                                                                                      2
                                                                                           MN
                                                  at 85 locations in                       10         WI
                                                                                                                        NY
                                                                                                                         1

                            largest                  17 states(1)
                                                                                                      23
                                                                                             IA                    PA
                                                                                     NE                             4
                                                                                              5               OH
                                                                                      7                IL      2
                        U.S. exhibitor                                          CO
                                                                                 1           MO         8   KY
                                                                                                                   VA
                                                                                                                    1
                                                                                              9              1

                                                                                                 AR
                                                                                                  1
                                                                                                              GA
                                                                                      TX         LA            3
                                                                                       3          3

                36
            Added                           Acquisition of Movie       Marcus Theatres by Screen(1)
     theatres, 425                       Tavern on February 1, 2019
     screens and 10                      added 208   screens                         ND
                                                                                     24

                                            in 9 states in the
                                                                                           MN
     states during the                                                                     126     WI
                                                                                                   289
                                                                                                                        NY
                                                                                                                        11
                                                                                                                   PA
      past six years                            South/East                                  IA
                                                                                     NE
                                                                                            62               OH    36
                                                                                     83                IL

                                         Increased screen                       CO                    130    34    VA
                                                                                10           MO             KY      8
                                                                                             127            13

                                           count by 23%                                          AR
                                                                                                 11           GA
                                                                                      TX         LA           28
                                                                                      33         33

13   (1)   As of September 30, 2021
Domestic Attendance & Box Office (Pre-Pandemic)
                      14                                                                                              3
                                          Box Office Revenue
                      12                  Box office Revenue in recession years                                       2.5
                                          Attendence
                      10
                                                                                                                      2
US Box Office ($bn)

                                                                                                                            Admissions (bn)
                      8
                                                                                                                      1.5
                      6

                                                                                                                      1
                      4

                                                                                                                      0.5
                      2

                      0                                                                                               0

              Source: National Association of Theatre Owners                                 DVD
                                                                                  Internet
            14                                                                               Online Video Streaming
Long History of Growth and Outperformance
      Our investments in amenities and implementation of innovative operating and marketing strategies
      resulted in historically strong performance

                            Box Office Results(1)                                                                         Concessions Revenue                                                     Ticket Revenue per
                                                                                                                            per person YoY                                                        person YoY Growth
10%
                                                                  8.6%
                                                                                                                                Growth
                  8.2%
8%                                                      6.8%
                                                                                                              30.0%                                       27.6%                           7.0%
                                                                                                                                                                                                                          6.0%              6.1%
6%                                                                                                            25.0%                                                                       6.0%

                                                                                                                                                                                          5.0%
4%                                                                                                            20.0%
        1.8%                                                                                                                                                                    15.7%     4.0%                    3.4%
2%                                                                                                            15.0%
                                                                                                                                                                                                          3.2%
                                                                                                                                                                                          3.0%    2.6%
0%                                                                                                                                                                                        2.0%
                                                                                                              10.0%
-2%           2016                  2017                    2018                      2019                                           6.4%       6.9%                6.8%
                                                                                                                           5.1%                                                           1.0%
                                          -1.0%                                                                 5.0%                                                                                                             -0.4%
-4%                           -2.6%
                                                                                                                                                                                          0.0%
                                                                                                                                                                                                    (2)     (3)     (4)    (5)                (5,7)
                                                                                                                                                                                                                                    (5,6)
                                                                                                                0.0%                                                                      -1.0%
-6%                                                                                         -5.5%
                                                                                                                               (2)       (3)       (4)       (5)        (5,6)     (5,7)
                                                                            -6.0%
-8%
                                           U.S.              Marcus
        (1)   Represents change in admission revenues compared to prior year.       (4)   Excludes Movie Tavern theatres.
              Source for U.S. numbers: Comscore. Comparisons data for               (5)   Includes Movie Tavern theatres.
              U.S. market was not available for the final three quarters of 2020.   (6)   All theatres were closed during most of Q2 and Q3.
        (2)   Excludes Marcus Wehrenberg Theatres.                                  (7)   Compared to the first half of fiscal 2020; comparisons to the second quarter of
  15    (3)   Includes Marcus Wehrenberg Theatres                                         fiscal 2020 are not applicable because the majority of theatres were closed
Created Industry-Leading Theatre Guest Experience
    Invested ~$570 Million in New and Existing Assets Since June 2013
     Recliner                                                                  Food and
                                                  PLF Screens                                             Acquisitions                   New Theatres
     Seating                                                                   Beverage
•   76% of company-                         •     76% of company-         •   62% of first-run        •   ~60% of existing           •   BistroPlex in-theatre
    owned theatres                                owned, first run            theatres offer one or       circuit via acquisitions       dining concept:
•   80% of screens                                theatres                    more in-lobby dining    •   Movie Tavern:                  Greendale, Wis.
•   Highest percentage                      •     Highest among top           concepts (excluding         208 Screens in nine            (June 2017)
    among the top                                 chains                      Movie Tavern                states (Feb. 2019)         •   New Movie Tavern by
    chains                                  •     120 PLF screens,            theatres)               •   Wehrenberg Theatres:           Marcus – Brookfield,
                                                  including proprietary   •   36% offer in-theatre        197 Screens in four            Wis. (Oct. 2019)
                                                  UltraScreen DLX® and        dining                      states (Dec. 2016)
                                                  SuperScreen DLX®        •   59% offer bars and
                                                  brands                      lounges

    16   Note: Data as of September 30, 2021 unless otherwise noted
Active Promotions and Loyalty Programs

           Value Pricing              Magical Movie Rewards     Alternative Programming

                                        4.3 Million loyalty
                                    customers and growing (1)

17   (1)   As of November 1, 2021
Technology Improving Our
Business
• New point-of-sale system
• New website ticketing engine
• New Marcus Theatres App
• Handheld technology for order taking
     – New: F&B ordering via App/Kiosk
• Using data from Movio to understand
  customer preferences/habits and target
  rewards and promotions
     – Opportunities in advanced data analytics to
       further transform data into information
• New labor forecasting tools

18
Remaining 2021 Film Slate Appears Very Strong*
     • Division experienced its best month at the box office in the COVID era in October 2021
       with films like “Venom: Let There Be Carnage,” “The Addams Family 2,” “No Time To
       Die,” “Halloween Kills,” and “Dune”
                                                                 Remaining Q4 2021 Films

                                              Eternals           Clifford The Big Red Dog      King Richard

                                       Ghostbusters: Afterlife       House of Gucci               Encanto

                                          West Side Story        Spider-Man: No Way Home           Sing 2

                                          The King’s Man         The Matrix Resurrections   A Journal For Jordan

19    * Film slate subject to change
Encouraging 2022 Film Slate*
                                                                        2022 Films
                                                                  Fantastic Beasts: The
              The 355                        Ambulance                                               Lightyear                Halloween Ends
                                                                  Secrets of Dumbledore
                                                                  Doctor Strange In The      Transformers: Rise of the
               Scream                       The Batman                                                                           The Flash
                                                                  Multiverse Of Madness              Beasts
                                                                                                                           Black Panther: Wakanda
              Morbius                       Turning Red               DC Super Pets          Minions: The Rise of Gru
                                                                                                                                   Forever

              Moonfall                Downton Abbey: A New Era       Legally Blonde 3        Thor: Love and Thunder               Creed III

         The Black Phone                    The Lost City          John Wick: Chapter 4             Black Adam                    Avatar 2

         Death on the Nile              Sonic The Hedgehog 2        Top Gun Maverick           Mission Impossible 7             Aquaman 2

                                                                                            Spider-Man: Into the Spider-
             Uncharted                      Bullet Train         Jurassic World: Dominion                                          Mario
                                                                                                   Verse Sequel

20   * Film slate subject to change
First Three Quarters of 2021
Results
• Outperformed the industry by 6
  percentage points during the first three
  quarters of fiscal 2021 and market
  share increased from 3.1% in 2019 to
  3.6% in 2021 YTD; believe this made
  Marcus Theatres one of the top
  performing theatre circuits during the
  quarter compared to the top 10 circuits
  in the U.S.
• Average admission price increased
  6.1% and average concession
  revenues per person increased by
  15.7% during the first three quarters
21
Outlook
• Increased vaccination rates and
  declining Covid cases has
  contributed to improved consumer
  confidence
• Film slate for remainder of 2021 and
  2022 is expected to be very strong
• Expect distributing films in a movie
  theatre to remain an important
  component of studios’ business
  model
• Pent-up demand and vaccination
  rates bodes well for continued
  long-term recovery
 22
Marcus Hotels & Resorts

23
Diverse Portfolio
     8 company majority-owned properties; manage 11 properties for other owners

          Grand Geneva Resort,               Skirvin Hilton,          AC Hotel Chicago Downtown,     Saint Kate – The Arts Hotel,
            Lake Geneva, WI                Oklahoma City, OK                   Chicago, IL                 Milwaukee, WI

       Lincoln Marriott Cornhusker,   Hilton Milwaukee City Center,        The Pfister Hotel,      Hilton Madison Monona Terrace,
                Lincoln, NE                  Milwaukee, WI                  Milwaukee, WI                   Madison, WI

24
Added New Management Contract
• Assumed management of The Coralville Hotel
  & Conference Center in Coralville, Iowa,
  effective 8/18/2021
• Hotel has been rebranded to Hyatt Regency
  Coralville Hotel & Conference Center
• Features 286 guest rooms, 57,588 square feet
  of meeting and convention space and a full
  dining experience
• Property will undergo a phased renovation
  following the brand transition focused on the
                                                  The Coralville Hotel & Conference Center,
  guest rooms and hotel restaurant                               Coralville, IA

• Expands company’s footprint into Iowa and a
  third “Big Ten” market

25
A Formidable Footprint
                                Marcus Hotels Locations
• Branded and independent
  first-class hotels
• Nearly 60 years of hotel
  management experience

 • 5,400 Rooms Managed
 • 200+ Meeting & Event Rooms
 • 40+ Restaurants & Lounges
 • 19 Managed Properties
 • 3 Luxurious Spas
 • 2 World Class Golf Courses
 • 1 Ski Hill
 • 1 Airport
 • 1 Escape Room Experience

26
A Leader in Our Markets and Industry
• Consistently outperforming our
  competitive sets                                                               Marcus Owned Market Share(1)

• Expertise in management,
                                   140.0
  development, historic                                                                                                                                           135.9
                                   135.0
  renovations, asset
                                   130.0
  repositioning and F&B            125.0

• Operational excellence –         120.0
                                                                                                                                                                  122.1
  consistently earn industry       115.0                               111.6                        110.4                                                                   113.5
                                                 110.0
                                                                                                                             108.1                                        107.7
  awards                           110.0
                                                                       110.8                                                                                      111.3
                                   105.0        107.9                                               108.5
                                                                                                                               106.2
                                                                                                                                                                          105.4
                                   100.0
                                                101.9                   100.7                       101.8                         101.7
                                    95.0
                                                                                                                                           (2)
                                        2016                            2017                       2018                     2019                           2020           2021
                                                                        RevPAR                   ADR                 Occupancy                      Fair Market Share

                                   (1)   Index value of 100.0 indicates fair market share. Value greater than 100.0 suggests greater than fair share of market.
27                                 (2)   Excludes Saint Kate – The Arts Hotel, which was closed for five months during the year.
Industry Performance
                                             (1)                                                                                                  (1)

                                                                                                                                                   (1)
                                                   (2)

28   (1)
     (2)
           Revenue per available room (“RevPAR”) represents the total room revenue divided by the total number of available rooms
           Occupancy represents the percentage of available rooms sold during a specified time period. Occupancy is calculated by dividing the number of rooms sold by rooms available.
                                                                                                                                                                                          Source: Smith Travel Research
Growth Opportunities
Opportunistically                    Adding New                        Enhancing Value                   Strong Food
Investing in New                     Management                        of Owned                          & Beverage
Hotels                               Contracts                         Properties                        Revenues
• MCS Capital, wholly owned          • Sought after property manager   • Maintain and enhance the        • F&B represented nearly 28% and
  investment entity                                                      value of our existing             33% of total division revenues for
                                     • Comprehensive portfolio
• Serves as investment fund                                              properties through thoughtful     FY 2020 and FY 2019, respectively
                                       of services hotel owners and
  sponsor, JV partner or sole                                            investments and renovations       (excluding cost reimbursements)
                                       developers need
  investor                                                             • Saint Kate – The Arts Hotel     • Developed and acquired
                                     • Assumed management of             opened in June 2019.              successful restaurant brands
• Able to make small equity
                                       Coralville Hotel & Conference     Innovative experiential arts
  investments in managed
                                       Center in Coralville, Iowa on     hotel in downtown Milwaukee,
  properties
                                       August 18, 2021                   Completely reimagined former
• Current environment may create
                                                                         company-owned branded
  opportunities
                                                                         hotel. Recipient of numerous
                                                                         national awards
                                       Coralville Hotel & Conference
                                                   Center

 Lincoln Marriott
Cornhusker Hotel                                                                        Hilton Madison
                                                                                        Monona Terrace

                                               Hyatt Regency               Saint Kate
                    Omaha Marriott             Schaumburg, IL
                      Downtown                                             Milwaukee

29
First Three Quarters of
2021 Results
• Outperformed comparable hotels by
  approximately 11 percentage points for the
  first three quarters of fiscal 2021
• Returned to profitability during the third
  quarter and first three quarters of fiscal
  2021; all company-owned hotels and
  resorts contributed to the improved
  operating results during fiscal 2021

30
Outlook
 •   Economic environment will impact future
     RevPAR trends; hotel revenues have
     historically tracked closely with GDP
 •   History (9/11, financial crisis) suggests
     business and group travel might take
     longer to recover
 •   Drive-to leisure demand expected to
     remain strong; Increase in vaccination
     rates may help future bookings
 •   Hotel supply growth will likely be limited
     – favorable for existing hotels
 •   Several hotels scheduled for
     reinvestment in next two to three years

31                                                The Garland, Los Angeles, CA
Shareholder Value Creation
Disciplined Historical Capital Allocation Strategy
• Opportunistically allocated over $925 million in capital from June 2013 to December 2019

                                                                 2% 2%

                                     3%
                              12%                           9%
                                                                            22%
                                                                                   M&A
     Operations                                                                    Theatre Cap Ex
                         9%                           12%                          Hotel Cap Ex
     Asset Sales
     Net Debt Proceeds
                                    Capital                      Capital           Net Debt Repayments
                                                                                   Dividends
     Stock Issuance      3%         Sources                       Uses
     Other                                                                         Share Repurchases
                                                                                   Other
                                                      15%
                                              73%

                                                                           38%

33
History of Returning Capital to Shareholders
• Annual cash dividend was $0.68 prior to
  suspension on 4/29/20 (3-year average yield of                     Annual Cash Dividends
  1.7%)
                                                      $0.7
• 45 years of consecutive dividends pre-COVID                                                        $0.64
                                                                                             $0.60
                                                      $0.6
• Special dividends in 2006 ($7.00) and 2012
  ($1.00)                                                                            $0.50
                                                      $0.5
                                                                             $0.45
• Repurchased over 3.9 million shares between
                                                                     $0.39
  2012 and 2016 at an average price of                $0.4
                                                             $0.35
  approximately $12
                                                      $0.3
• Amended credit agreement allows reduced
  dividends and/or share repurchases beginning        $0.2
  in the first quarter of 2022 and all restrictions
  on capital returns to shareholders are removed      $0.1
  entirely after the term loan is repaid and the
  company is in compliance with prior                 $0.0
  covenants                                                  2014    2015    2016    2017    2018    2019

34
Long-Term Value Maximization

      Theatre Expansion                  Hotel Expansion      Reinvesting in Existing Assets

 • Acquisitions                    • Joint Ventures           • Hotel & Theatre Renovations
 • New Builds                      • Management Contracts     • New Amenities & Features
                                   • Creation of a Fund       • F&B Innovations
                                                              • DreamLoungers, UltraScreen
                                                                DLX, SuperScreen DLX

     Divestitures of Assets            Operating Strategies    Capital Structure Strategies

 • Sale of Selected Hotels         • Revenue Enhancements     • Share Repurchases
   (may retain management)         • Cost Rationalization     • Dividend Policy
 • Selected Theatre                • Management               • Balance Sheet Management
   Replacement

                   Focused on Long-Term Shareholder Value
35
Financial Performance

36
Historical Financial Performance
                           Revenues                                                              Operating Income                                                                        Adjusted EBITDA
                                                                                                                                                                                                                                      (4)

                                 (in millions)                                                                                                                                                             (in millions)
                                                                                                                 (in millions)

                                                                                              Operating Income                         % of Revenues                         Adjusted EBITDA                         Adjusted EBITDA Margin %
$900
                                           $820.9                          $100                            $83.2                                            25%    $200                                                                        30%
                                                                                      $77.3      $83.2
$800                                                                                                                     68.2
                               $707.1
                                                                                                                                                                   $160                           $149.4 $155.2
$700               $653.6                                                    $50                            11.8%
                                                                                     11.8% 11.8%                         8.3%                               0%                         $132.7
$600      $653.6                                                                                                                                                            $117.2                                                             25%
                                                                                                                                                                   $120
                                                                              $0
$500                                                                                                               (1)           (2)
                                                                                                                                                            -25%
                                                                                       2016      2017       2018         2019          2020     LTM                 $80
$400                                                                       -$50                                                                                                                   21.1%                                        20%
                                                               $325.9
                                                                                                                                                                    $40     20.4% 20.3%
$300                                                $237.7                                                                                                  -50%
                                                                                                                                                                                                               18.9%
                                                                          -$100
$200                                                                                                                                                  (3)            $0
                                                                                                                                              $(110.7)                                                                                         15%
$100                                                                                                                                                        -75%             2016       2017       2018         2019        2020      LTM
                                                                          -$150                                                                                    -$40                                                              $(21.9)
  $0
            2016      2017      2018        2019      2020       LTM      -$200                                                    $(178.4)                 -100% -$80                                                                         10%
                                                                                                                                                                                                                           $(71.6)

(1)   Includes $2.2M of nonrecurring acquisition and preopening expenses and $3.7M of nonrecurring depreciation.
(2)   Includes impairment charge of $1.9 million and $9.3M of nonrecurring acquisition, preopening and initial startup losses.
(3)   Includes impairment charges of $18.9 million and net nonrecurring COVID-related favorable adjustments of $10.7 million.
(4)   Non-GAAP measurement equal to operating income plus depreciation and amortization, impairment charges, non-cash share-based compensation and certain non-recurring expenses. Refer to the non-GAAP
      reconciliation in the appendix for further information.
       37
Historical Results by Segment (in millions)
                                Revenues          (1)   (in millions)                                                     Operating Income (in millions)
                                                                                            2016-19
     $800                                                                                    CAGR     $125                        $13        $12
                                                                                                                   $15                                    $10
                                                           $227                              1.8%                                            $89
     $600                                                                                              $25         $72            $80                     $77
                               $221        $227
     $400          $215                                                                                                                                                            $(89)
                                                                                             19.2%     -$75                                                             $(121)
                                                           $556                    $156
     $200                      $401        $446                           $105                                                                                                      $(6)
                   $328                                                                                                                                                 $(44)
                                                                          $133     $169               -$175
           $0
                   2016        2017        2018            2019           2020     LTM                            2016           2017       2018         2019           2020        LTM

                              Theatres         Hotels & Resorts                                                                  Theatres        Hotels & Resorts

                        Adjusted EBITDA (in millions)
                                                                                                                           Capital Expenditures (in millions)
                       & Adjusted EBITDA Margin                                             2016-19
                                                                                             CAGR
     $175          30.0%    28.6%      29.0%                                        35.0%              $120
                                        $35       $37                                        5.8%                                  $21
     $125                    $31                  23.8%                                                $100
                   $32                                                              25.0%
                                                                                                        $80         $15
      $75          14.6%     14.2%     15.5%     16.4%
                                                                                    15.0%               $60
      $25                                                                                    10.4%                                 $94         $15          $32
                   $98      $115       $129      $132                       $14                         $40
                                                                                    5.0%                            $69
     -$25                                                       $(43)      $(23)                        $20                                    $44                         $5          $5
                                                                                                                                                            $32
                                                                $(17)                                    $0                                                               $16          $7
     -$75                                                                           -5.0%                                  (2)                                    (2)
                  2016      2017       2018      2019           2020        LTM                                     2016          2017        2018         2019           2020        LTM

                Theatres         Hotels & Resorts                       Theatre     Hotel                                          Theatres        Hotels & Resorts
                                                                                                       Note: Above charts do not include corporate segment. Adjusted EBITDA is a non-GAAP
     (1)    Excludes cost reimbursements                                                               measurement equal to operating income plus depreciation/amortization, impairment charges and
38   (2)    Excludes Wehrenberg and Movie Tavern acquisitions.                                         nonrecurring acquisition, preopening expenses and initial startup losses. Refer to non-GAAP
                                                                                                       reconciliation in the appendix for further information.
APPENDIX
Credit Agreement Amendment and Convertible Debt
Issuance
• Amended bank agreements, extended term loan by 5 months and adjusted
  covenants to provide for near- and medium-term uncertainly
     • Key component of amended bank agreements was opportunistically raising attractive
       capital that could ultimately replace the short-term term loan
• September 2020 issuance of 5% convertible unsecured notes due September
  2025 has the following advantages:
     • Effectively replaces short-term borrowings with 5-year junior capital
     • Cash interest payments will be significantly lower than other long-term options
     • Able to size the issuance appropriately, particularly for a company our size
     • Purchased a capped call in conjunction with our issuance to effectively increase the strike
       price of the convertible from 22.5% of our closing stock price to 100% of our closing stock
       price, significantly reducing any dilution concerns
     • Option to settle these notes at maturity with cash, equity or a combination thereof,
40     providing further ability to reduce any actual dilution at maturity
Future Dilution Minimized by Capped Call and
Repayment Options

41
First Three Quarters of Fiscal 2021
Financial Highlights
                                                                   First Three Quarters of Fiscal 2021 Financial Highlights
                                                                             (In thousands, except per share data)

                                                                                                                   13 Weeks Ended                                     39 Weeks Ended
                                                                                                                 Sept. 30,  Sept. 24,                              Sept. 30,   Sept. 24,
                                                                                                                   2021       2020                                   2021        2020

                                 Total revenues                                                             $      145,862            $     33,591              $ 289,196 $                    200,984
                                 Operating income (loss)                                                             6,273                 (47,987)               (55,498)                    (123,249)
                                 Net earnings (loss)                                                                 1,759                 (39,440)               (49,737)                     (85,821)
                                 Net earnings (loss) per share                                                        0.06                   (1.30)                 (1.66)                       (2.84)
                                 Adjusted net earnings (loss)(1)                                                           275             (36,992)                  (49,403)                   (88,688)
                                                                                                      (1)
                                 Adjusted net earnings (loss) per share                                                  0.01                  (1.22)                    (1.64)                     (2.93)
                                 Adjusted EBITDA(1)                                                                  24,515                (25,808)                     5,830                   (43,804)

     (1)   Adjusted loss attributable to The Marcus Corporation, Adjusted loss per diluted common share attributable to The Marcus Corporation and Adjusted EBITDA reflect adjustments made by the company to eliminate
42         the favorable impact of government grants received and the impact of impairment charges during the fiscal 2021 periods, as well as the impact of a favorable income tax adjustment and certain nonrecurring property
           closure expenses, reopening expenses and impairment charges during the fiscal 2020 periods.
First Three Quarters of 2021 Financial Highlights
                              Reconciliation of Adjusted net earnings (loss) and Adjusted net earnings (loss) per diluted common share
                                                                              (Unaudited)
                                                                 (In thousands, except per share data)
                                                                                                                                        13 Weeks Ended                        39 Weeks Ended
                                                                                                                                     Sept. 30,       Sept. 24,            Sept. 30,        Sept. 24,
                                                                                                                                       2021             2020                 2021            2020
                          Net earnings (loss) attributable to The Marcus Corporation                                               $       1,759    $ (39,440)           $ (49,737) $         (85,821)
                          Add (deduct):
                            Adjustment to income taxes (a)                                                                                                   168                              (17,420)
                            Property closure/reopening expenses - theatres (b)                                                                -            1,173                    -           4,630
                            Property closure/reopening expenses - hotels (c)                                                                  -              443                    -           5,484
                            Impairment charges (d)                                                                                            -              765                3,732           9,477
                            Joint venture impairment charge (e)                                                                                              811                                   811
                            Government grants (f)                                                                                         (2,009)              -               (3,280)              -
                            Tax impact of adjustments to net earnings (g)                                                                    525            (912)                (118)         (5,849)
                            Adjusted net earnings (loss) attributable to The Marcus Corporation                                    $         275    $ (36,992)           $ (49,403) $         (88,688)

                          Weighted average shares outstanding - diluted                                                                  31,469          31,064               31,340           31,033

                          Net earnings (loss) per diluted common share attributable to The Marcus Corporation $                             0.06    $      (1.30)        $      (1.66) $         (2.84)
                          Adjusted net earnings (loss) per diluted common share attributable to
                            The Marcus Corporation                                                                                 $        0.01    $      (1.22)        $      (1.64) $         (2.93)

     a)   Reflects a nonrecurring adjustment to income taxes related to several accounting method changes and the impact of the CARES Act, which allows net operating loss carrybacks to a higher federal income tax rate year.
     b)   Reflects nonrecurring costs related to the required closure of all of the company's movie theatres due to the COVID-19 pandemic, plus subsequent nonrecurring costs related to reopening theatres.
     c)   Reflects nonrecurring costs related to the closure of the company's hotels and resorts due to reduced occupancy as a result of the COVID-19 pandemic, plus subsequent nonrecurring costs related to reopening hotels.
     d)   Impairment charges related to surplus theatre real estate for the fiscal 2021 periods and intangible assets (trade name) and several theatre locations for the fiscal 2020 periods.
     e)   Impairment charge related to an investment in a joint venture.
43   f)   Reflects a nonrecurring state government grant awarded to our theatres and hotels for COVID-19 relief.
     g)   Represents the tax effect related to adjustments (b), (c), (d), (e) and (f) to net earnings (loss), calculated using a statutory tax rate of 26.1% for the fiscal 2021 periods and 28.7% for the fiscal 2020 periods.
First Three Quarters of 2021 Financial Highlights
                                                                     Reconciliation of Net earnings (loss) to Adjusted EBITDA
                                                                                            (Unaudited)
                                                                                           (In thousands)
                                                                                                                                          13 Weeks Ended                        39 Weeks Ended
                                                                                                                                       Sept. 30,        Sept. 24,           Sept. 30,         Sept. 24,
                                                                                                                                         2021            2020                  2021            2020
                          Net earnings (loss) attributable to The Marcus Corporation                                                 $      1,759 $ (39,440)               $ (49,737) $ (85,821)
                          Add (deduct):
                           Investment income                                                                                                        7           (66)               (153)            (207)
                           Interest expense                                                                                                 4,600            4,132              14,350           10,177
                           Other expense                                                                                                       625             590                1,881           1,771
                           (Gain) loss on disposition of property, equipment and other assets                                                 (868)            251               (2,908)             299
                           Equity losses from unconsolidated joint ventures                                                                     -            1,054                    -           1,539
                           Net loss attributable to noncontrolling interests                                                                    -                   0                     0           (23)
                           Income tax expense (benefit)                                                                                        150        (14,508)             (18,931)         (50,984)
                           Depreciation and amortization                                                                                   17,730          18,690               54,203           56,568
                           Share-based compensation expenses (a)                                                                            2,521            1,108                6,673           3,286
                           Property closure/reopening expenses - theatres (b)                                                                   -            1,173                    -           4,630
                           Property closure/reopening expenses - hotels (c)                                                                     -              443                    -           5,484
                           Impairment charges (d)                                                                                               -              765                3,732           9,477
                           Government grants (e)                                                                                           (2,009)              -                (3,280)              -
                          Adjusted EBITDA                                                                                            $     24,515 $ (25,808)               $      5,830 $ (43,804)

     a)   Non-cash charges related to share-based compensation programs.
     b)   Reflects nonrecurring costs (primarily payroll) related to the required closure of all of the company's movie theatres due to the COVID-19 pandemic, plus subsequent nonrecurring costs related to reopening theatres.
     c)   Reflects nonrecurring costs related to the closure of the company's hotels and resorts due to reduced occupancy as a result of the COVID-19 pandemic, plus subsequent nonrecurring costs related to reopening hotels.
44   d)   Impairment charges related to surplus theatre real estate for the fiscal 2021 periods and intangible assets (trade name) and several theatre locations for the fiscal 2020 periods.
     e)   Reflects a nonrecurring state government grant awarded to our theatres and hotels for COVID-19 relief.
I N V E S T O R P R E S E N TAT I O N | N O V E M B E R 2 0 2 1
You can also read