Lakes Entrance Northern Growth Area Social Impact Assessment
←
→
Page content transcription
If your browser does not render page correctly, please read the page content below
APPENDIX 3

Lakes Entrance Northern Growth Area
                Social Impact Assessment
Lakes Entrance Northern Growth Area
                                                                           Social Impact Assessment

Acknowledgments
We acknowledge the traditional owners of the land, the Gunnai Kurnai people and pay our respects
to their elders past and present.

The time, expertise and local knowledge which community members, local service providers, and
government agencies have contributed to the process of the preparation of this report is greatly
appreciated. Thank you to everyone who assisted.

                                                                                        2|Pa g e
Lakes Entrance Northern Growth Area
Social Impact Assessment
Table of Contents
1 SUMMARY........................................................................................................................................... 1
2 INTRODUCTION ................................................................................................................................... 3
2.1 DEFINITIONS ............................................................................................................................................. 3
2.2 LEGISLATIVE FRAMEWORK FOR SIAS IN VICTORIA.............................................................................................. 5
2.3 POLICY CONTEXT ........................................................................................................................................ 5
3 SCOPING OF THE DEVELOPMENT.......................................................................................................... 7
3.1 DESCRIPTION OF THE PROPOSED PROJECT ........................................................................................................ 7
3.2 CHARACTERISTICS OF THE LAKES ENTRANCE AREA............................................................................................. 9
3.3 LOCAL INDUSTRY ...................................................................................................................................... 19
4 UNDERSTANDING THE FUTURE COMMUNITY ..................................................................................... 21
4.1 ASSESSMENT ASSUMPTIONS ....................................................................................................................... 21
4.2 OTHER INFLUENCING FACTORS ................................................................................................................... 21
4.3 GROWTH SCENARIOS ................................................................................................................................ 21
4.4 FRAMEWORK FOR ASSESSING THE IMPACTS OF THE DEVELOPMENT .................................................................... 22
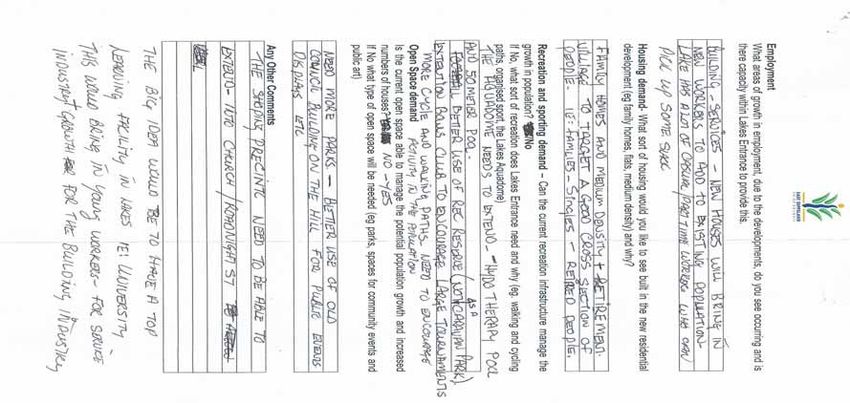
5 THE VIEWS OF THE COMMUNITY........................................................................................................ 24
5.1 OVERVIEW OF THE CONSULTATION PROCESS ................................................................................................. 24
5.2 KEY ISSUES .............................................................................................................................................. 24
5.3 OTHER ISSUES.......................................................................................................................................... 26
6 ASSESSMENT OF THE SOCIAL IMPACTS............................................................................................... 28
6.1 OVERVIEW .............................................................................................................................................. 28
6.2 GROUPS/INDIVIDUALS THAT WILL BE IMPACTED BY THE DEVELOPMENT PROPOSAL ................................................. 28
6.3 CONSIDERATION OF FACTORS WHICH CONTRIBUTE TO WELL‐FUNCTIONING COMMUNITIES ...................................... 30
7 MAPPING OF SERVICES AND FACILITIES.............................................................................................. 33
7.1 OVERVIEW .............................................................................................................................................. 34
7.2 DETERMINING THE SCOPE AND QUANTUM OF COMMUNITY INFRASTRUCTURE ..................................................... 34
7.3 SOCIAL AND HEALTH INFRASTRUCTURE ......................................................................................................... 35
7.4 RECREATION FACILITIES ............................................................................................................................. 36
7.5 PUBLIC OPEN SPACE ................................................................................................................................. 38
7.6 LIBRARY/ COMMUNITY MEETING SPACES ..................................................................................................... 38
7.7 EMERGENCY SERVICES PROVISION ............................................................................................................... 39
7.8 PUBLIC TRANSPORT .................................................................................................................................. 39
7.9 VEHICLE TRAFFIC ...................................................................................................................................... 40
7.10 HOUSING................................................................................................................................................ 40
7.11 POPULATION AND SERVICE DEMAND............................................................................................................ 40
7.12 SOCIAL INFRASTRUCTURE AUDIT ................................................................................................................. 41
7.13 INFRASTRUCTURE AND SERVICE REQUIREMENTS .............................................................................................. 41
7.14 ASSESSING THE VALIDITY OF ASSUMPTIONS OVER TIME..................................................................................... 41
8 RECOMMENDATIONS......................................................................................................................... 53
9 REFERENCES ...................................................................................................................................... 57
APPENDIX 1. PROJECTED POPULATION GROWTH TO 2025 BY SINGLE AGE GROUPS .................................... 58
APPENDIX 2. EMPLOYMENT PROFILE (ABS, 2006) ...................................................................................... 59
APPENDIX 3 SURVEY TOOL ......................................................................................................................... 60
APPENDIX 4 COMMUNITY GROUPS AND ORGANISATIONS ......................................................................... 61
i|P a g e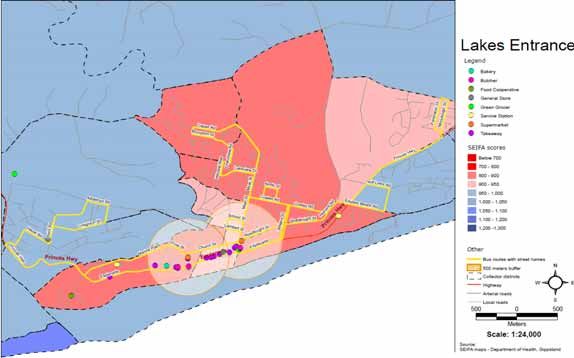
Lakes Entrance Northern Growth Area
Social Impact Assessment

List of Tables
TABLE 1:     POPULATION OF LAKES ENTRANCE, 2006 ..................................................................................................... 10
TABLE 2:     AGE OF POPULATION, LAKES ENTRANCE, 2006.............................................................................................. 10
TABLE 3:     MEDIAN STATISTICS –LAKES ENTRANCE (ABS 2006, EAST GIPPSLAND SHIRE COUNCIL ‐COMMUNITY PROFILE, 2012)10
TABLE 4:     POPULATION PROJECTION 2006‐2025 –LAKES ENTRANCE .............................................................................. 11
TABLE 5:     POPULATION GROWTH BY AGE GROUPING TO 2025 ...................................................................................... 12
TABLE 6:     SEIFA SCORES BY CENSUS COLLECTOR DISTRICTS (CDS), 2006 ........................................................................ 13
TABLE 7:     HOUSING TYPE (ABS 2006)..................................................................................................................... 14
TABLE 8:     DWELLING TYPE (ABS 2006) ................................................................................................................ 15
TABLE 9:     FAMILY STRUCTURE (ABS, 2006)............................................................................................................... 16
TABLE 10:    UNEMPLOYMENT RATE BY STATISTICAL LOCAL AREA 2007‐2011 (DEEWR SMALL AREA STATISTICS) ..................... 17
TABLE 11:    SOCIAL IMPACT ASSESSMENT MATRIX ......................................................................................................... 33
TABLE 12:    TYPE OF COMMUNITY INFRASTRUCTURE ....................................................................................................... 34
TABLE 13:    QUANTITATIVE ANALYSIS OF SOCIAL/COMMUNITY INFRASTRUCTURE ACROSS THREE DEMOGRAPHIC SCENARIOS ........ 43
TABLE 14:    MAJOR SOCIAL INFRASTRUCTURE AUDIT ………………………………………………………………………………………45

List of Figures
FIGURE 1:        LAND DEVELOPMENT PARCELS AND NUMBER OF POTENTIAL LOTS .................................................................... 7
FIGURE 2:        LAKES ENTRANCE URBAN LOCALITY SHOWING ABS CENSUS COLLECTION DISTRICT BOUNDARIES .......................... 9
FIGURE 3:        POPULATION PROJECTION (CURRENT GROWTH) 2014‐2025 ...................................................................... 12
FIGURE 4:       LAKES ENTRANCE CENSUS COLLECTION DISTRICTS (CCD) ............................................................................ 13
FIGURE 5:       PART TIME EMPLOYMENT BASED ON ABS (2006)...................................................................................... 18
FIGURE 6:       OCCUPATION TYPE COMPARISON BAIRNSDALE/LAKES ENTRANCE (BASED ON ABS CENSUS 2006)...................... 18
FIGURE 7:       IMAGES OF LAKES ENTRANCE FORESHORE ................................................................................................. 19
FIGURE 8:        ESPLANADE RETAIL AREA BETWEEN MYER STREET AND CARPENTER STREET .................................................... 20
FIGURE 9:        COMMUNITY LISTENING POST ............................................................................................................... 24
FIGURE 10:       MAPPING OF RETAIL FOOD OUTLETS, PUBLIC TRANSPORT AND WALKABILITY .................................................... 32
FIGURE 11:      LAKES AQUADOME LEISURE CENTRE AND LAKES ENTRANCE YOUTH AND RECREATION CENTRE ........................... 37
FIGURE 12:      LAKES ENTRANCE FORESHORE ................................................................................................................ 38

ii | Page
Lakes Entrance Northern Growth Area
                                                                               Social Impact Assessment

1   Summary
The development of a number of parcels of land within the Lakes Entrance Northern Growth Area
has provided an opportunity to reflect on the social, economic and environmental context of the
Lakes Entrance community. The proposed level of development will, over time have a significant
impact on the local community and may provide an opportunity for the town to undertake growth
which is not dependant on existing challenges of inundation and climate change. The level of
uncertainty on these latter issues is providing a barrier to social and economic stability and hence
there is an opportunity for advocacy on behalf of the community to make progress towards a
greater definition of the future of the town.
The study has found a community with a number of strengths and challenges and an understanding
of its own complexity and vulnerability. The positive support for the proposed residential
development also reflects the community’s desire for “progress” and “growth”. It indicates a sense
of engagement by the community in its future development and provides an insight into the level of
commitment to maintaining the viability of a town often a reflection of its historical context.
 The key facets of the social/community infrastructure which have informed the SIA
recommendations are as follows:‐
The community has poor internal transport connections and is reliant on vehicle use to provide
access to the retail area, education, and recreation and health services. Walking is actively
encouraged along the foreshore area but infrastructure to support greater access to facilities is
unconnected and poorly signposted. The proposed development can play a major role in improving
the connectivity and walkability across the community and as a link between the foreshore and
major trails and walkways to the north of Lakes Entrance
Lakes Entrance has extensive social/community infrastructure which reflects its historical growth
over a long period of time although most of the infrastructure is either ageing, unable to expand to
service increased demand or is physically disparate and poorly integrated across the community. Key
areas for examination were the provision of early year’s education services, the location of
emergency services, the connectivity to the diverse recreation opportunities and the potential to
improve coordination of services and facilities to maximize service provision across the age groups.
The community is, in some small areas, amongst the lowest percentiles of advantage in East
Gippsland. The education and employment levels, especially in professional/sub professional
occupations are low and household incomes are low compared with East Gippsland and Victorian
averages. Economic growth is limited to the main employment generators, tourism and fisheries,
and both are reliant on seasonal variability. Casualisation of the local employment market, resultant
from these major employers, drives much of the lower household income rates. There are therefore
a number of potentially vulnerable families in Lakes Entrance. The need to support and grow access
to public education, health and welfare services within the town will be a key driver in developing
future social/community infrastructure.
The ageing of the East Gippsland community is well documented and the level is equal to and will
potentially be above the municipal rate over time if there was to be no change in the existing
demographic patterns. The uptake of the proposed development and the demographic that is
attracted to it will depend on the economic, social and environmental development of Lakes
Entrance. The high level of separate housing is indicative of the housing profile in rural and regional
towns, with the high level of tourism accommodation generally targeted at the caravan parks and
smaller motel units. The development of a greater diversity in the housing stock is required to
provide for variations in household types, with the potential for older residents to move to medium
density housing and to release more affordable family size housing on to the market.

                                                                                            1|Pa g e
Lakes Entrance Northern Growth Area Social Impact Assessment The health and wellbeing of the community is reflective of that for the East Gippsland Shire. Primary health occasions of service per 1,000 population is 76.7% above the Victorian average, reflecting the health service demand and the rural and regional health delivery model existing in East Gippsland. In 2008, 66.5% of males in the Shire met the physical activity guidelines, similar to Victorian males (61.0%), however only 51.0% of females in the Shire met the physical activity guidelines, lower than Victorian females (59.7%). The percentage of females in the Shire classified as completing an insufficient amount of physical activity (38.2%) was higher than Victorian females (27.2%). The percentage of persons at risk of short‐term harm from alcohol consumption is 31% higher than the Victorian average. Increased access to public health infrastructure is supported within the study and there is evidence to show that the demand for services will continue. Improved access to recreational opportunities will contribute to a healthier community as will opportunities for increased social interaction and economic growth. The recommendations developed from the assessment, are designed to support a strong and viable Lakes Entrance community which is to grow as the result of the cumulative effects of the proposed residential developments. The many social and environmental challenges outlined within this study provide for the opportunity to adapt to a changing landscape and to ensure that the social infrastructure supports the community into the future. 2 | Page
Lakes Entrance Northern Growth Area
                                                                                Social Impact Assessment

2     Introduction
The East Gippsland Shire Council has been presented with a number of potential residential
developments in Lakes Entrance for which it has decided to produce an Overall Development Plan
(ODP), in an area now defined as the Lakes Entrance Northern Growth Area.
Council has also decided to undertake a number of studies to establish appropriate baseline
information from which to define a series of recommendations by which the future development of
the proposed residential land can be guided.
A major component of the proposed studies will be the assessment of the social impact of the
proposed development. This process has been designed to follow Council’s Draft Social Impact
Assessment Guidelines for Development Applications and considers the various impacts of the
proposed residential developments on the local community and its social infrastructure.
This document provides an explanatory discussion on the principles and practice of Social Impact
Assessment as it relates to the proposal for residential development in the Lakes Entrance Northern
Growth Area. It also examines the evidence of existing social support and infrastructure and, in
reference to population projection data, makes recommendations for adaptations to change
resulting from the proposed residential development

2.1    Definitions
Social infrastructure
Social Infrastructure refers to:‐
       “the community facilities, services and networks which help individuals, families, groups
       and communities meet their social needs, maximise their potential for development and
       enhance community wellbeing.
       They include:
       ¾ universal facilities and services such as education, training, health, open space,
         recreation and sport, safety and emergency services, religious, arts and cultural
         facilities, and community meeting places
       ¾ lifecycle‐targeted facilities and services, such as those for children, young people and
         older people
       ¾ targeted facilities and services for groups with special needs, such as families,
         people with a disability and Indigenous and culturally diverse people
(South East Queensland Regional Plan 2005‐2026 Implementation Guideline No.5: Social infrastructure
planning)
Social Impact Assessment
Social Impact Assessment (SIA) is defined as:‐
       “the processes of analysing, monitoring and managing the intended and unintended
       social consequences, both positive and negative, of planned interventions (policies,
       programs, plans, projects) and any social change processes invoked by those
       interventions. Its primary purpose is to bring about a more sustainable and equitable
       biophysical and human environment” (International Association of Impact Assessment,
       2010).
Developments impact on communities across a spectrum of conditions and responses and can result
in changes to how people live, work and interact with each other, their culture, community and

                                                                                             3|Pa g e
Lakes Entrance Northern Growth Area
Social Impact Assessment
environment, as well as their health and wellbeing. Developments can also impact on people’s fears
and aspirations, including their perceptions about their safety. Understanding and managing the
long‐term effects of these changes is central to supporting the development of sustainable
communities in the long term and mitigation against any negative impacts.
A number of factors have led to the introduction of social impact assessments as part of the planning
approval process. These include:
• Council is committed to promote and implement the community’s vision for strong, vibrant,
sustainable and productive communities;
• Growth and change is occurring across a number of communities, as Council encourages
economic growth;
• Increasing land prices encourages sub‐division of farming land for residential development,
particularly in coastal communities;
• Environmental changes are occurring, as a result of climate change impact, with increasing
devastation from bushfires and floods. There is a need to manage these changes and support
communities in the longer term;
• There is increasing divides in socio‐economic status between communities in the municipality,
with disadvantage and poverty increasing in socially isolated communities and increasing wealth
and prosperity in the coastal and more accessible areas of the municipality. There is a need to
manage the potential displacement of existing low income residents to more isolated areas
where land is affordable;
• Council has a process for economic and environmental assessments. Given the definition of
“sustainable communities” outlined in the Ministerial Guidelines (Ministerial Guidelines for
Assessment of Environmental Effects, Department of Sustainability and Environment, 2006) and
the East Gippsland Shire Council Plan 2009‐2013, there is a need to develop a more robust
process for assessing social impacts.
The SIA process will:
• Enable an integrated planning process to occur, complementing the economic and
environmental assessments which are currently required;
• Provide a systemic assessment of the cumulative effect of multiple development proposals in
local communities;
• Introduce better outcomes for communities, linking the planning process to the directions of the
Council Plan;
• Promote the “liveability” of the Shire; and
• Ensure that potential negative impacts are reduced through effective management and the
opportunities for potential positive impacts are maximised.
Social Impact Assessments can
• Identify and maximise the positive community health and wellbeing impacts and opportunities
that development, policy changes and infrastructure can bring;
• Identify, avoid and minimise, through changes to project design and implementation, the
unintended negative community health and wellbeing impacts that can arise;
• Identify relevant Federal, State and local Government regulations and policies which may impact
on the project;
4 | PageLakes Entrance Northern Growth Area
Social Impact Assessment
• Identify existing community issues, including gaps in services and infrastructure, which could
amplify the impact of a proposed project and affect its viability;
• Provide a process through which the project can work in partnership with council and local
health and wellbeing service providers to jointly alleviate any existing social or health concerns
or potential negative social impacts;
• Contribute to broader community and local stakeholder involvement and engagement that can
build trust, draw out any community concerns and generate dialogue about the best ways that
the project can benefit local communities;
• Provide a balanced and integrated approach between social, economic and environmental
outcomes;
• Provide an equitable, transparent and evidence‐based approach to planning and funding
community infrastructure and development activities to protect and enhance sustainable local
livelihoods and communities;
• Assist to jointly negotiate those aspects of community health and wellbeing which are the
responsibility of the project and those aspects which are the responsibility of council and other
levels of government;
• Help to manage project sustainability and viability.
2.2 Legislative framework for SIAs in Victoria
The guidelines for Social Impact Assessment, developed by Council, cover the process for meeting
the social objectives of land use and development planning, in accordance with the Act.
The legislative framework for SIAs and authority of Local Government to require SIAs to be
undertaken for selected developments, is contained in the Planning and Environment Act Victoria
1987:
• Section 4: Objectives;
Objective 2 (d): to ensure that the effects on the environment are considered and
provide for explicit consideration of social and economic effects when decisions are
made about the use and development of land;
• Section 12: Duties and powers of planning authorities;
Section 12 (2) (c): may take into account its social effects and economic effects. and
• Section 60: What matters must be considered by a responsible authority.
Section 60 (1A) (a): Before deciding on an application, the responsible authority, if the
circumstances appear to so require, may consider— any significant social and economic
effects of the use or development for which the application is made.
2.3 Policy context
The policy contexts that will can inform or direct the proposed residential development include:‐
• Planning and Environment Act 1987
• East Gippsland Planning Scheme ‐ especially relating to the vision and objectives for Lakes
Entrance :‐
“Lakes Entrance will continue its role as the largest coastal town in the Gippsland area,
with a strong focus on commercial fishing and recreational boating activities. The
5|Pa g eLakes Entrance Northern Growth Area
Social Impact Assessment
protection and enhancement of environmental and landscape values will be a key
priority.
Residents will enjoy an easily accessible town with a variety of housing types,
employment opportunities and retail and commercial uses” (Clause 21.06, EGPS, 2012)
• Healthy by Design‐ Heart Foundation
• Disability Discrimination Act
• East Gippsland Community Wellbeing Plan
6 | PageLakes Entrance Northern Growth Area
Social Impact Assessment
3 Scoping of the development
3.1 Description of the proposed project
This Social Impact Assessment study includes six individual parcels of land which are being viewed
collectively to ensure that the cumulative impacts of the developments are considered. These are
illustrated in Figure 1 and include a parcel of land which is owned by the East Gippsland Shire
Council, the location of Council’s Lakes Entrance Offices.
Figure 1: Land development parcels and number of potential lots
Land Owner Number of Lots
Goff/Berlingeri 59
Beloti/Geomin 280
J&C Guillot 176
McColley 30
Painter/Dixon Developments 210
East Gippsland Shire 23
The land is mostly sloping towards the south with a number of prominent gullies. It is situated at the
northern edge of the township and in some parts is adjacent to existing residential areas. There is a
golf course, cemetery and a small existing area of residential development within the study area.
The area is bordered by Ostlers Rd, Colquhoun Rd and Palmers Rd.
7|Pa g eLakes Entrance Northern Growth Area
Social Impact Assessment
View of Lakes Entrance Cemetery, Palmers Rd
View South from Ostlers Road
As there are a number of land development proposals within the study, the Social Impact
Assessment will necessarily view the cumulative effects of all proposals on the Lakes Entrance
community and its social infrastructure. As such, the assessment becomes more complex because of
a number of variables which need to be taken into account such as the timing of the potential land
development releases and the effects of those releases over a period of 20 years. The timeframe is
chosen to relate to the current scope of demographic projections ie to 2025/6.
The East Gippsland Shire Council Draft Social Impact Assessment Guidelines for Development
Applications sets out a mechanism to develop a picture of the future effects of development
proposals. Although the guidelines provide the best evidence based approach to assessment of
social impact of development applications we must be aware that this process is predictive.
Assumptions and conclusions are based on available information and the opportunities to interpret
and reflect on possible population and demographic projections.
8 | PageLakes Entrance Northern Growth Area
Social Impact Assessment
3.2 Characteristics of the Lakes Entrance Area
3.2.1 Physical
The Lakes Entrance Study Area is 2,807 hectares with a population density of 1.74 people per
hectare. This SIA will use the same geographic definition previous studies on land use in Lakes
Entrance, ABS category of ‘Urban Locality” ((Urban Enterprise, 2010) (see Figure 2).
Figure 2: Lakes Entrance Urban Locality showing ABS Census Collection District boundaries
3.2.2 Climate Change and Land Inundation in Lakes Entrance
The main town centre of Lakes Entrance has been subject to interim planning controls due to the
issues of land inundation from flooding. This effect, in conjunction with planning considerations and
concerns for climate change on low lying areas, has led to the development of a number of studies
to examine the vulnerability of the community to environmental change.
The social impact of climate change in Lakes Entrance has yet to be quantified. However, the
community is concerned about the effects of climate change on their town and way of life, their
property values and their ability to adapt to a potentially difficult and challenging environment.
Importantly, some health, education and community service provision and the majority of the
commercial and tourism infrastructure are situated in or close to the areas where inundation and
sea level rise is predicted to have the most significant effect.
3.2.3 Population characteristics
To effectively plan for social infrastructure which is able to meet the needs of the community into
the future, it is important to understand the profile of the communities which are the subject of the
study.
Existing demographic information is available from a number of sources, all of which are reliant on
the Australian Bureau of Statistics (ABS) which derive their data from the national census
undertaken every five years. The current information is sourced from the 2006 census which will be
superseded by the 2011 census data, available from July 2012. There are also a number of
predictive measures such as the Estimated Resident Population (ERP) which provides estimated
population growth using a number of economic and social measures. These data are available to
2025 through a number of Commonwealth and State government agencies (Department of Health,
Department of Planning and Community Development).
9|Pa g eLakes Entrance Northern Growth Area
Social Impact Assessment
Table 1 shows the total population of Lakes Entrance, at the time of the 2006 Census. These data
indicate that the total population of the town at that time was just over 5,500. Table 2 shows the
breakdown of the population in 2006 (Census 2006, ABS).
Table 1: Population of Lakes Entrance, 2006
Person Lakes % of total % of total % of total % of total
Characteristics Entrance persons in persons in East persons in persons in
Lakes Gippsland Shire Victoria Australia
Entrance
Total persons 5,548 100%
(excluding
overseas visitors)
Males 2,691 48.5% 49.2% 50.9% 49.4%
Females 2,857 51.5% 50.8% 49.1% 50.6%
Aboriginal 205 3.7% 2.9% 0.6% 2.3%
persons
Table 2: Age of population, Lakes Entrance, 2006
Age Groups Lakes % of total % of total % of total % of
Entrance persons in persons in East persons in total
Lakes Gippsland Shire Victoria persons
Entrance in
Australia
0‐4 years 303 5.5% 5.3% 6.2% 6.3%
5‐14 years 633 11.4% 13.1% 13.1% 13.5%
15‐24 years 552 9.9% 10.2% 13.7% 13.6%
25‐54 years 1,805 32.5% 35.2% 42.6% 42.2%
55‐64 years 841 15.2% 15.2% 10.7% 11.0%
65 years and 1,413 25.5% 21.0% 13.7% 13.3%
over
To understand some of the drivers for social and economic determinants, we have provided an
examination of a number of medians (i.e. the middle ranking of all values) and provided comparative
information for East Gippsland, Victoria and Australia (see Table 3).
Table 3: Median statistics –Lakes Entrance (ABS 2006, East Gippsland Shire Council ‐Community Profile,
2012)
Medians Lakes East Victoria Australia
Entrance Gippsland
Shire
Median age of persons (years) 47 45 37 37
Median individual income $326 $357 $456 $466
($/weekly)
Median family income $702 $868 $1,170 $1,171
($/weekly)
10 | PageLakes Entrance Northern Growth Area
Social Impact Assessment
Median household income $588 $653 $1,022 $1,027
($/weekly)
Median housing loan $962 $867 $1,252 $1,300
repayment ($/monthly)
Median rent ($/weekly) $140 $132 $185 $190
Average number of persons 1.1 1.1 1.1 1.1
per bedroom
Average household size 2.2 2.3 2.6 2.6
Observations from the Population and Median data
These data indicate that Lakes Entrance is a town dominated by older people, with a quarter of the
population aged 65 years of age or older. The older persons (55 and older) count is higher for Lakes
Entrance than all comparative measures, being almost double the national average. This has the
effect of raising the median age of the community.
Younger people under 25 are under‐represented in the community in comparison to Victorian
averages with the 15‐24 age group most affected
There are a larger percentage of Aboriginal people in the Lakes Entrance area. It is generally
accepted by service agencies in the area that the census statistics are an under‐estimation of the
Indigenous population and that the actual number is likely to be up to double the census count.
Individual incomes are below municipal and state medians with family incomes at 60% of the
Victorian average
The cost of owning a house and renting a house in Lakes Entrance is proportionately higher when
considered with household incomes
3.2.4 Anticipated Population Change
Table 4 shows the estimated population for the Bairnsdale Statistical Local Area (SLA) as compiled by
the Australian Bureau of Statistics (ABS). The Lakes Entrance population projection is derived from
adjusting the population by the percentage growth of the SLA which encompasses the area from
Bairnsdale to Lakes Entrance.
Table 4: Population Projection 2006‐2025 –Lakes Entrance
Bairnsdale SLA 2006 2012 2016 2021 2025
Population 26,192 28,591 30,028 31,715 32,927
% increase per 1.8 1.0 1.1 0.8
annum
Lakes Entrance 5,548 6,047 6,349 6,698 6,965
Population
Projection
Source: ABS
3.2.5 Population Projection by Age
Population by age is a determinant of social infrastructure planning. The number of people who are
expected to live in the Lakes Entrance study area is predicated on natural birth/death balance and
11 | P a g eLakes Entrance Northern Growth Area
Social Impact Assessment
ageing of the population using the Bairnsdale Statistical Local Area growth pattern (Table 4,
represented graphically by age in Chart 1.)
Figure 3: Population Projection (current growth) 2014‐2025
160.0
140.0
120.0
Population
100.0 2025
2020
80.0
2016
60.0 2014
40.0
20.0
0.0
0 10 20 30 40 50 60 70 80 90
Age
Source: ABS 2006
The graph indicates the growth of the community by age groups. The outstanding elements of the
graph are the high level of the 60+ age group, which remains the dominant grouping across the
period to 2025. Equally evident are the low numbers of young people in the 20‐30 age grouping.
The above table is a benchmark from which we need to extrapolate the addition of the extra
population produced by the proposed residential land development. If we assume that the
proposed developments have 30 dwellings purchased each year, for the current estimated lot yield
of 750‐900, there would be approximately 25‐30 years of residential supply in the overall
development. If we use the most common persons per household data for Lakes Entrance (2.2) we
would have an extra 66 people in the community per annum. The breakdown of the age groupings,
based on current profiling for the study area, is shown below (Table 6).
Table 5: Population Growth by Age Grouping to 2025
Age Grouping % of Population Number/annum Number after 25
years
0‐4 5.5 3.6 91
5‐14 11.4 7.5 188
15‐24 9.9 6.5 163
25‐34 32.5 21.5 538
55‐64 15.2 10.0 250
64+ 25.5 16.8 420
Total 100 65.9 1650
12 | PageLakes Entrance Northern Growth Area
Social Impact Assessment
3.2.6 Social and Economic Indicator for Advantage (SEIFA)
The SEIFA rating provides a comparative tool to estimate the relative advantage and disadvantage of
individual communities. It operates with a set of indicators which provide a measure that makes
comparisons against the average Australian level of advantage, which is set at 1000. Lakes Entrance
has a mix of SEIFA ratings which are provided here at the Census Collection District level (areas of
225 houses, on average) and shown below (Figure 3). The numbers on the chart below represent
collector districts.
Figure 4:Lakes Entrance Census Collection Districts (CCD)
2040302
2040303 2040301
2040312
2040311
2040315
2040305
2040310
2040309
2040304
Source: ABS
Socioeconomic factors such as income, employment, education, social support and housing are all
intricately linked to the health and wellbeing of the community. Disentangling the relationships
between wellbeing of a community and these factors is complex because the causal direction is
often unclear. For example, people who have higher levels of education are more likely than others
to be employed in white‐collar or professional jobs, and also tend to have higher incomes than
unskilled workers. Therefore, some of the connection between income and health is due to the
indirect effects of education and occupation. Education promotes skills and knowledge that can help
an individual understand information and seek services to improve their health. Further, illness or
disability can contribute to unemployment, which in turn results in reduced income. (Australia’s
Health 2010, AIHW).
Table 6: SEIFA scores by Census Collector Districts (CDs), 2006
CDs Index of Relative Index of Relative Index of Index of Usual
Socio‐economic Socio‐Economic Economic Education and Resident
Advantage and Disadvantage Resources Occupation Population
Disadvantage
Score Decile Score Decile Score Decile Score Decile
2040301 900 2 941 3 962 4 865 1 724
2040302 846 1 854 1 844 1 873 1 575
13 | P a g eLakes Entrance Northern Growth Area
Social Impact Assessment
CDs Index of Relative Index of Relative Index of Index of Usual
Socio‐economic Socio‐Economic Economic Education and Resident
Advantage and Disadvantage Resources Occupation Population
Disadvantage
Score Decile Score Decile Score Decile Score Decile
2040303 894 2 896 2 896 2 924 3 615
2040304 78 2 896 2 892 2 900 2 339
2040305 931 3 977 4 985 5 895 2 670
2040309 873 1 885 2 869 1 891 2 328
2040310 901 2 918 2 925 3 901 2 292
2040311 858 1 888 2 922 2 847 1 711
2040312 953 4 1,000 5 995 5 921 3 459
2040313 922 3 963 3 965 4 921 3 512
Source: ABS 2006
Some observations from the SEIFA scores for Lakes Entrance
Collection District (CD) 2040302, which rates as the lowest overall SEIFA score (846), in Lakes
Entrance and at the 4th percentile mark in Victoria, encompasses the majority of the Overall
Development Plan area. Neighbouring CD’s around the proposed developments, have SEIFA scores
one closer to 900 (13th percentile) and one at 858 (5th percentile).
3.2.7 Housing and Family Structure Data
Comparison has been made between the Lakes Entrance study area, East Gippsland and Victoria in
order to understand the makeup of the current housing stock and family makeup.
Table 7: Household Type, Lakes Entrance (ABS 2006)
Number of Family Non‐family Total % of total % of total % of total
persons households households dwellings dwellings dwellings
usually Lakes East Victoria
resident: Entrance Gippsland
One 0 669 669 30.0 27.0 24.5
Two 867 50 917 41.0 40.9 33.2
Three 248 6 254 11.5 12.0 15.9
Four 212 0 212 9.6 11.8 16.3
Five 118 0 118 5.4 5.3 7.1
Six or more 34 0 34 1.5 2.2 3.0
Total 1,479 725 2,204 100 100 100
14 | PageLakes Entrance Northern Growth Area
Social Impact Assessment
Table 8: Dwelling Type, Lakes Entrance (ABS 2006)
Dwelling Type Dwellings Persons % of total % of total % of total
dwellings dwellings dwellings
Lakes Entrance East Gippsland Victoria
Separate house 1,822 4,319 82.7 89.7 77.5
Semi‐detached, row or
terrace house,
townhouse etc. with:
• One storey 38 57
• Two or more storeys 7 11
Total 45 68 2.0 2.6 9.2
Flat, unit or apartment:
• In a one or two 268 406
storey block
• In a three storey 0 0
block
• In a four or more 0 0
storey block
• Attached to a house 0 0
Total 268 406 12.3 5.5 12.6
Other dwelling:
• Caravan, cabin, 61 99
houseboat
• Improvised home, 0 0
tent, sleepers out
• House or flat 6 20
attached to a shop,
office, etc.
Total 67 119 3.0 2.2 0.7
Dwelling structure not 0 0
stated
Total 2,204 4,912 100 100 100
Source: ABS (2006)
15 | P a g eLakes Entrance Northern Growth Area
Social Impact Assessment
Table 9: Family Structure (ABS, 2006)
Enumerated data 2006 Lakes 2006 2006 East 2001 2001 2001 East Change
Entrance Lakes Gippsland Lakes Lakes Gippsland 2001 to
number Entrance Shire % Entrance Entrance Shire % 2006
number
% %
Couples with child(ren) 408 22.6 25.3 435 25.3 28 ‐27
under 15 years
Couples with child(ren) 170 9.4 9.9 168 9.8 9.7 1
15 years and over
Total couples with 578 31.9 35.2 604 35 37.7 ‐26
child(ren)
One parent families 188 10.4 8.7 181 10.5 9.1 6
with child(ren) under
15 years
One parent families 89 4.9 5 74 4.3 5 16
with child(ren) 15
years and over
Total one parent 277 15.3 13.7 255 14.8 14.1 22
families
Couples without 942 52.1 50.2 840 48.8 47 101
child(ren)
Other families 12 0.7 0.9 24 1.4 1.1 ‐12
Total families 1,809 100 100 1,724 100 100 85
One family households 1,765 65.9 67.6 1,676 63.5 66.4 89
Two or more family 11 0.4 0.5 14 0.5 0.3 ‐3
households
Total family 1,776 66.3 68.1 1,690 64 66.7 86
households
Lone person 741 27.7 27.2 690 26.1 26.3 50
households
Group households 72 2.7 2.3 63 2.4 2.3 10
Other not classifiable 89 3.3 2.4 197 7.5 4.7 ‐109
households
Total households 2,678 100 100 2,640 100 100 38
Source: ABS
Observations from Housing and Family Structure Data
• Over 33% of households are classed as non‐family households, above the East Gippsland and
Victorian levels.
• Two person households are the largest group which reflects the number of older couples living
without children.
16 | PageLakes Entrance Northern Growth Area
Social Impact Assessment
• Four persons, family households are only 9.6% of the housing types compared with 16.3% for
Victoria.
• 83% of housing is separate housing which is above the Victorian average by 14%. This high
percentage reflects the traditional development of housing in rural towns.
• Couples with children under 15 years of age have declined from 2001 to 2006 possibly reflecting
the lack of local employment or lack of affordable family housing. Renting accounts for 26% of
housing slightly higher than the Regional Victoria average and almost 3% above the East
Gippsland figures. House purchasing (22%) was lower than East Gippsland (26%) and much lower
than Regional Victoria (32%).
• One parent families have increased from 2001‐2006 whereas the East Gippsland numbers have
reduced overall
3.2.8 Employment
Information on the current employment status of the Lakes Entrance study area is provided by the
Department of Education, Employment and Workplace Relations (DEEWR). Since December 2011
the unemployment rate has fallen across most of East Gippsland as represented below in Table 9.
Table 10: Unemployment rate by Statistical Local Area 2007‐2011 (DEEWR Small Area Statistics)
Statistical December December March June September December
Local Area 2007 2010 2011 2011 2011 2011
Bairnsdale 6.6 5.5 5.4 5.2 5.3 4.9
(includes
Lakes
Entrance)
Orbost 6.9 6.7 6.7 6.5 6.6 6.3
South 4.5 5.7 5.7 5.6 5.7 5.2
West
Rural 5.1 4.5 4.3 4.1 3.9 3.8
Balance
As a town with extensive reliance on seasonal employment attached to the major industries of
fishing and tourism, there are a large number of part time positions. This is represented in Fig 5 and
highlights the difference between Lakes Entrance employment
17 | P a g eLakes Entrance Northern Growth Area
Social Impact Assessment
Figure 5: Part time employment based on ABS (2006)
70
60
50
40
% Employed Full Time
30 Employed Part Time
20
10
0
Lakes Victoria East
Entrance Gippsland
Source: ABS
An examination of the major occupation types (Fig 6) suggests that the employment in Lakes
Entrance provides less work for professionals than in a comparison with Bairnsdale and a greater
percentage offering of technicians/trades positions and labourers. This reflects the SEIFA index
characteristics of the Lakes Entrance community (see Section 3.2.6).
Figure 6: Occupation Type Comparison Bairnsdale/Lakes Entrance (based on ABS Census 2006)
800
700
600
Number
500 Lakes Entrance
400
300 Bairnsdale
200
100
0
administrative
Technicians/Trades
Professionals
Managers
Machinery
Labourers
Operators
Personal Service
Sales
Clerical &
Community/
Occupation Type
Source: ABS 2006
18 | PageLakes Entrance Northern Growth Area
Social Impact Assessment
3.3 Local Industry
3.3.1 Tourism
Tourism is the one of the major industries in Lakes Entrance and brings an average of $170,000,000
into the economy of the town. There has been considerable investment in tourism in recent years
with $9m invested in 2008. In 2010 this had reduced to $1.2m.
Ninety percent of tourists who visit East Gippsland are from other parts of Victoria, mainly from the
eastern suburbs. Council’s Visitor Information Centre is a key component of tourism development
and promotion.
Figure 7:Images of Lakes Entrance foreshore
The top five activities that tourists engage in while visiting East Gippsland are (in order):
• To eat at restaurants
• To visit friends and relatives
• To go shopping
• Go to the beach
• General sightseeing
Despite the current robustness of the industry, tourism faces a challenge from the impact of climate
change and sea‐level rises. Modelling indicates that by 2040, large areas of the low lying land in
Lakes Entrance will have an increased risk of inundation on a regular basis (Gippsland Coastal Board).
This may affect the major retail and commercial businesses of Lakes Entrance which support the
tourism effort in the town.
3.3.2 Fishing Industry
The other major industry in Lakes Entrance is fishing. This includes both commercial lake fishing and
off‐shore fishing. Current data (Lakes Entrance Fishermen's Co‐operative Society Limited) indicates:
• There are 80‐100 vessels in the fishing fleet in Lakes Entrance;
• The fishing industry employs 20 full time and 40‐50 casual employees; for each 2 jobs in the
fishing industry there is 1 extra job which is a flow on effect of those positions. The high level of
casual positions supports the data provided above on the casualisation of labour in the Lakes
Entrance economy
• 4.5 million kilos of fish are caught annually; and
• Lakes Entrance is the largest supplier to the Melbourne Fish Market
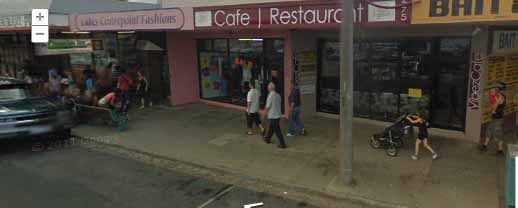
19 | P a g eLakes Entrance Northern Growth Area Social Impact Assessment 3.3.3 Other Industry A small industrial area in Whiters Street is located in what was originally to be on the “outskirts of town”. This area is now landlocked by residential development, including the proposed development. There are a number of small to medium business in the building/building supply trades, mechanical services and waste management located within the area but there is little room for expansion. This has necessitated Council to undertake a study into identifying the provision of further industrial land in Lakes Entrance. 3.3.4 Retail The retail areas of Lakes Entrance are contained between The Esplanade and the areas of Church Street, Marine Parade and Roadknight Street. There are two supermarkets and a general department store, a range of restaurants, cafes and boutique shops. There is also a white goods retailer in Church Street and a Post Office on The Esplanade. The Esplanade is the main retail area with small businesses operating in Myer Street between The Esplanade and Church Street and the supermarket and department store located in a large area between The Esplanade and Church Street. There are a small number of businesses operating in the streets between The Esplanade and Church Street. Retail businesses in Lakes Entrance are impacted by the seasonality of being a holiday destination, with the summer population swelling to nearly 30,000. This means that the four months over summer are extremely busy and profitable; the remaining eight months of the year are considerably less busy with the consequence of reduced income and poorer employment opportunities. The need for increased resilience of small business has emerged as a priority for Lakes Entrance. Figure 8: Esplanade retail area between Myer Street and Carpenter Street 20 | Page
Lakes Entrance Northern Growth Area
                                                                                  Social Impact Assessment

4     Understanding the Future Community
4.1     Assessment Assumptions
Assessing the quantum of the community infrastructure and the impacts of the development for the
existing community requires an understanding of the nature of the growth. At this stage, the nature
of the development is not confirmed. However, a number of assumptions underpin this assessment
and influence the growth. These include:
•     The new development will target permanent residents;
•     The overall number of new lots will be between 750 and 900, dependent on lot yield per
      hectare. This represents 1650 – 2,000 people, based on the average household size of 2.2;
•     The calculations on the uptake of the new dwellings will be discussed using three population
      growth scenarios. These scenarios provide an opportunity to develop a picture of the community
      dependent on a number of specific social and economic factors. Recent land use studies for
      Lakes Entrance (Urban Enterprise 2010) have suggested that the average number of new
      dwellings approved each year is 74 with 43 approved in Residential 1 Zone areas.

4.2     Other Influencing Factors
A number of other factors will influence the growth in the northern area of Lakes Entrance. These
include:
•     The Merrangbaur Heights proposal situated immediately east of the proposed development,
      although not specifically part of the study, will have an impact on the community established in
      the Northern Growth Area. This development is proposed to provide approximately 162 lots
      with an additional area designated for a retirement village, although the village is not part of the
      developer’s current considerations.
•     The timeframe for the release of land is not known and is dependent on the commercial
      decisions made by the developers. This means that the increase in population may occur over a
      ten to twenty year period or may occur more rapidly;
•     The nature of the housing is not known and is dependent on the demographic of the population
      growth. This will impact on any predictions regarding the nature of the additional community
      infrastructure.

4.3     Growth Scenarios
Three growth scenarios have been developed and are used as the basis for the assessment. All
assume that the development will be completed within ten to twenty years, i.e., the population in
Lakes Entrance will increase by between 1650 – 2,000 people by 2022‐32. These scenarios are:
Scenario One
Population composition remains equivalent to the existing. This assumes that the new residents will
parallel the existing community and will primarily be older residents, with some younger families.
Scenario Two
The new development attracts families with children, increasing the proportion of children and
young people in the community to the levels equivalent to Bairnsdale.
Scenario Three
The new development attracts families with children and young people, increasing the proportion of
children and young people to the levels equivalent to the whole of the State.

                                                                                              21 | P a g e
Lakes Entrance Northern Growth Area
Social Impact Assessment
Achievement of Scenarios Two and Three require complementary economic development strategies
targeted at expanding the industry base of Lakes Entrance and/or surrounding areas. The
development will not attract families unless there are employment opportunities within a
reasonable commuting distance.
All three scenarios have been modelled for capacity assessment against existing infrastructure
benchmarks (Table 13, p. 43)
4.4 Framework for Assessing the Impacts of the Development
4.4.1 Working towards achieving the directions of Council
East Gippsland Shire Council is committed to working with the community to build on the natural
beauty of the municipality and the attributes of the local communities – to working with
communities to achieve its vision, outlined in “Unlocking the Future – Long Term Community Vision
2030”. This vision is centred on three themes, which together with principles of good governance,
form the four strategic objectives of the Council Plan, 2009‐13. These are:
• Liveability: Strong and vibrant communities create healthy, productive and fulfilling places to
live:
¾ Cohesive Communities: Cohesive communities with a strong sense of identity involved in the
development and implementation of shared vision;
¾ Active, Healthy and Safe: An active, health and safe engaged in recreational, arts and
cultural activities;
¾ Diverse and Connected: Services and facilities that support community diversity and
connectivity, and promote quality lifestyles.
• Productivity – Investment and visitation develop a sustainable and prosperous economy:
¾ Economic Environment: A vibrant and dynamic environment in which to do business;
¾ Development: Infrastructure and information systems that support and attract diverse
economic and social development in the region.
• Sustainability – proactive leadership and strategic partnerships protect and enhance our
quality environment
¾ Community: Communities equipped for sustainable living
¾ Natural Environment: a sustainable, healthy and diverse natural environment
¾ Built Environment: a built environment that is adequately maintained and is sensitive to the
region’s natural attributes.
• Governance – strong leadership and prudent management of democratic and legislative
requirements deliver good governance outcomes:
¾ Financial sustainability – well managed finances to maintain financial sustainability;
¾ Strong leadership and advocacy – a responsible organisation that works actively with the
community providing strong leadership and advocacy;
¾ Open and Accountable: an open and accountable system of governance that reflects the
highest level of good management.
Council is committed to ensuring that any proposed development in the municipality contribute to
the achievement of this community vision and the delivery of the strategic objectives. Social
22 | PageLakes Entrance Northern Growth Area
Social Impact Assessment
considerations of such changes are thus this critical. These directions are the key drivers of this
assessment.
4.4.2 Social Impact Assessment Matrix
A range of different services and infrastructure are required to support the development and
maintenance of sustainable and healthy communities across the age spectrum. Table 11 (p.33)
outlines a Social Impact Assessment Matrix which was developed as part of Council’s SIA guidelines.
The elements of the matrix have been described within the body of the report and provide the
evidence to assess the impacts of the developments in the Northern Growth Area of Lakes Entrance.
Dimensions of the Matrix
The dimensions of the matrix describe the key factors which contribute to healthy and sustainable
communities. Using these dimensions, a systematic approach can be taken to:
• Describe the current characteristics of the community across the age cohorts;
• Understand the impacts of changes in relation to the dimensions for particular population
cohorts;
• Quantify and describe the strategies to be developed to manage the impacts.
23 | P a g eYou can also read