Lead Isotopes in North American Precipitation Record the Presence of Saharan Dust - AMS Journals
←
→
Page content transcription
If your browser does not render page correctly, please read the page content below
Article
Lead Isotopes in North American Precipitation
Record the Presence of Saharan Dust
Sean R. Scott, Jason P. Dunion, Mark L. Olson, and David A. Gay

                                ABSTRACT: Atmospheric dust is an important mass transfer and nutrient supply process in Earth
                                surface ecosystems. For decades, Saharan dust has been hypothesized as a supplier of nutrients
                                to the Amazon rainforest and eastern North America. However, isotope studies aimed at detecting
                                Saharan dust in the American sedimentary record have been ambiguous. A large Saharan dust
                                storm emerged off the coast of Africa in June 2020 and extended into the southeastern United
                                States. This storm provided a means to evaluate the influence of Saharan dust in North America
                                confirmed by independent satellite and ground observations. Precipitation samples from 17 sites
                                within the National Atmospheric Deposition Program (NADP) were obtained from throughout the
                                southeastern United States prior to, during, and after the arrival of Saharan dust. Precipitation
                                samples were measured for their lead (Pb) isotopic composition, total Pb content, and 210Pb activity
                                using multicollector inductively coupled plasma mass spectrometry. We measured a significant
                                isotopic shift (approximately 0.7% in the 208Pb/206Pb relative to the 207Pb/206Pb) in precipitation
                                that peaked in late June 2020 when the dust blanketed the southeastern United States. However,
                                the magnitude and short time period of the isotopic shift would make it difficult to detect in
                                sedimentary records.

                                KEYWORDS: Atmosphere; Africa; North America; Dust or dust storms

https://doi.org/10.1175/BAMS-D-20-0212.1
Corresponding author: Sean R. Scott, srscott4@wisc.edu
Supplemental material: https://doi.org/10.1175/BAMS-D-20-0212.2
In final form 25 August 2021
©2022 American Meteorological Society
For information regarding reuse of this content and general copyright information, consult the AMS Copyright Policy.

                AMERICAN METEOROLOGICAL SOCIETY                                                                        F E B R UA RY 2 0 2 2 E281
                                                                                                                   Unauthenticated | Downloaded 06/16/22 10:56 AM UTC
AFFILIATIONS: Scott—Wisconsin State Laboratory of Hygiene, University of Wisconsin–Madison, Madison,
Wisconsin; Dunion—Cooperative Institute for Marine and Atmospheric Studies, University of Miami,
and Hurricane Research Division, NOAA/Atlantic Oceanographic and Meteorological Laboratory, Miami,
Florida; Olson and Gay—National Atmospheric Deposition Program, Wisconsin State Laboratory of
Hygiene, University of Wisconsin–Madison, Madison, Wisconsin
D
ust transport continuously blankets Earth, spreading nutrients across land and ocean
surfaces, and affecting the composition and radiative heat budget of the atmosphere.
The magnitude of dust transport and deposition varies through time; ice core records
indicate glacial cycles control the overall atmospheric dust budget (Petit et al. 1981),
while short-term variations result from seasonal weather patterns (Goudie 1983). Growing
recognition of the importance of natural dust in Earth’s biogeochemical cycles has resulted in
numerous studies documenting continental and ocean basin scale transport across thousands
of kilometers. For example, Asian dust is transported across the Pacific (Duce et al. 1980;
Sassen 2002; Ewing et al. 2010) and regulates nutrient supply in the montane landscapes
of the western United States (Aciego et al. 2017). Dust from Saharan Africa is distributed
throughout the Mediterranean (Ganor and Mamane 1982), and across the Atlantic Ocean
(Prospero and Carlson 1972; Chiapello et al. 1995), supplying nutrients to the Amazon basin
(Swap et al. 1992; Yu et al. 2015), the Caribbean (Muhs et al. 1990; Kumar et al. 2018), and
the eastern United States (Perry et al. 1997).
Detection, tracking, and predictions of modern dust sources and emissions rely on remote
sensing (e.g., Washington et al. 2003; Baddock et al. 2009; Rayegani et al. 2020), climatic data
(Tegen et al. 2004), and geochemical (Erel and Torrent 2010; Torfstein et al. 2017) and min-
eralogical (Schütz and Sebert 1987) indicators. Isotopes, especially radiogenic isotope ratios
of strontium (Sr), neodymium (Nd), hafnium (Hf), and lead (Pb) may provide characteristic
identification of dust sources (Grousset and Biscaye 2005; Aarons et al. 2017), although long
distance transport can complicate isotopic systematics due to dust differentiation (i.e., pref-
erential removal of heavier minerals/particulates as distance from the dust source increases;
Aarons et al. 2013). Tracking of dust influence in distal regions is further complicated by
mixing with local dust sources. Fortunately, local isotopic characteristics can be derived from
precipitation (Graney and Landis 2013; Sherman et al. 2015) and in situ atmospheric aerosols
(Bollhöfer and Rosman 2000, 2001) can provide a local atmospheric baseline composition
that can be used to evaluate potential changes associated with dust influence, provided that
the influence of distal dust or particle sources can be excluded. Nevertheless, evaluation of
long-term trends of atmospheric deposition in a specific area can be challenged by complicated
mixing relationships with local sources.
The Saharan Desert is the largest source of dust on Earth (Goudie 1983) with the Bodélé
Depression being the most prominent source within the region (Goudie and Middleton 2001).
Due to the influence of Saharan dust on Amazonian nutrient supply, Abouchami et al. (2013)
sought to use Pb isotopic data to evaluate temporal changes in dust supply in the sedimentary
record. In this study, Abouchami et al. (2013) compared isotopic compositions of source dust of
the Bodélé Depression to Amazonian sediments, and they were unable to identify the Saharan
dust signal presumably due to “consumption” of the dust by tropical weathering. Likewise,
Escobar et al. (2013) did not detect the presence of a significant Saharan dust component in lake
sediments in Florida. A study combining isotopic measurements with independent observations
of the presence of Saharan dust transported across the Atlantic Ocean would therefore provide
insight into the lack of isotopic evidence for Saharan dust influence in the sedimentary record.
In June 2020, a large Saharan dust storm was observed in satellite imagery, which showed
the dust crossing the Atlantic Ocean and spreading throughout the Caribbean Sea, Gulf of
AMERICAN METEOROLOGICAL SOCIETY F E B R UA RY 2 0 2 2 E282
Unauthenticated | Downloaded 06/16/22 10:56 AM UTCMexico, and the southeastern United States. Ground based observations of red skies and poor
air quality were reported throughout the region. This event provided a unique opportunity to
utilize existing infrastructure of the National Atmospheric Deposition Program (NADP; see
appendix A) to evaluate the presence of Saharan dust in atmospheric precipitation. Satellite
observations were critical for coordination of sample collection, allowing for sampling sites
to be targeted prior to arrival of the dust storm. The primary goal of this collaboration was to
determine the effects of Saharan dust on the isotopic composition of atmospheric Pb deposi-
tion using preexisting NADP infrastructure.
Here, we present stable Pb isotopic composition, total Pb content, and 210Pb activity data
in precipitation samples from before, during, and after the arrival of Saharan dust across the
southeastern United States (Fig. 1). These data allow for high-precision characterization of
background atmospheric Pb isotopic compositions, which in turn allow for detection of an
ephemeral signal associated with the Saharan dust storm. This study provides additional
support for NADP as a rapid response network for atmospheric changes occurring at short
time scales.
Constraints on the isotopic composition of North American atmospheric lead
Sedimentary records across the United States, as well as coral and oceanographic data,
show that atmospheric Pb contents peaked in the 1970s and 1980s, but since the cessation
of the use of leaded gasoline, atmospheric Pb concentrations have generally decreased (e.g.,
Eisenreich et al. 1986; Callender and Van Metre 1997; Kamenov et al. 2009; Kelly et al. 2009;
Boyle et al. 2014; Zurbrick et al. 2018). Pb isotopic shifts in sediments correspond temporally to
the use of leaded gasoline (Escobar et al. 2013), but are otherwise largely controlled by general
industrial anthropogenic inputs since the start of the Industrial Revolution (Graney et al. 1995).
While sedimentary records provide constraints on changes in atmospheric Pb isotope com-
positions through time, they can be complicated due to mixing of background atmospheric
deposition of both local and distal point sources of pollution. Anthropogenic contamination
sources carry a significant influence on isotopic composition and anthropogenic compo-
nents can be separated from the natural “geogenic” background by chemical leaching (e.g.,
Shirahata et al. 1980; Hamelin et al. 1989; Kumar et al. 2014, 2018). However, sedimentary
records do not provide a means to examine short-term excursions (on the order of days) in
lead isotopic composition that have little leverage on the overall Pb budget.
The direct atmospheric Pb isotopic composition in North American has been evalu-
ated in studies focused on aerosols (e.g., Bollhöfer and Rosman 2001), precipitation (e.g.,
Graney and Landis 2013; Sherman et al. 2015), and snowpack (Simonetti et al. 2000a,b). These
datasets indicate that the primary sources of today’s atmospheric Pb are derived from indus-
trial activities, smelting, and coal burning (Graney and Landis 2013; Sherman et al. 2015).
Isotopic datasets, either in the sedimentary record, precipitation, and/or aerosols, show that
atmospheric Pb isotopic composition is not a single point, but rather an isotopic trend that
varies across the landscape due to changes in proximity to different industrial sources.
The North American atmospheric trend line
In many cases, datasets of atmospheric Pb composition have been produced by either single-
collector inductively coupled plasma mass spectrometry (ICPMS) (Graney and Landis 2013;
Sherman et al. 2015) or multicollector thermal ionization mass spectrometry (TIMS)
(Bollhöfer and Rosman 2000, 2001); however, a high-precision analysis using multicollector
inductively coupled plasma mass spectrometry (MC-ICPMS) of direct atmospheric Pb compo-
sition is lacking. In this study we used a NeptunePlus MC-ICPMS with an Aridus 3 desol-
vating nebulizer system to enhance sensitivity, allowing us to produce high-precision isotopic
data on relatively low total Pb quantities (as low as 12 ng; see appendix B for methods).
AMERICAN METEOROLOGICAL SOCIETY F E B R UA RY 2 0 2 2 E283
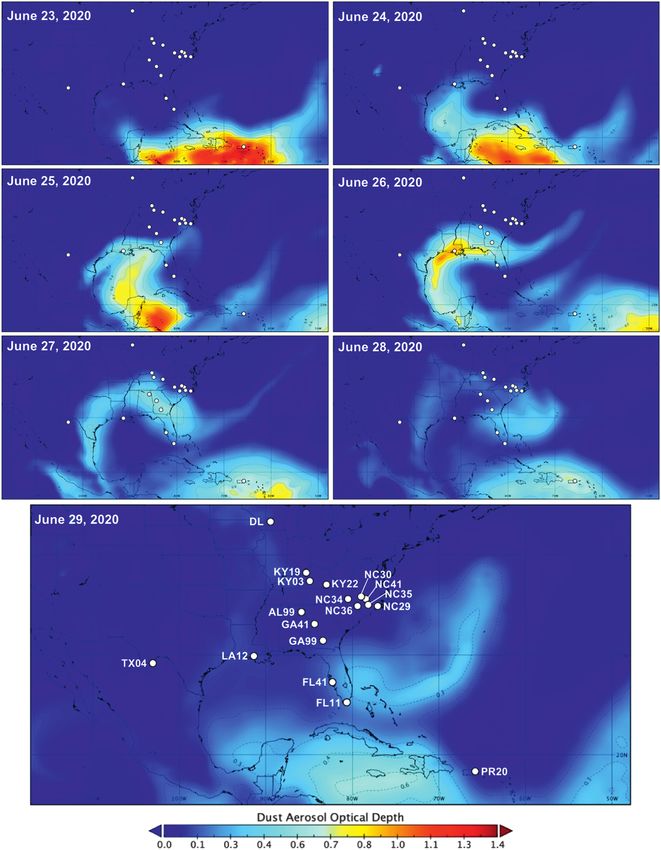
Unauthenticated | Downloaded 06/16/22 10:56 AM UTCFig. 1. Dust aerosol optical depth from 23 to 29 Jun 2020 from the Navy Aerosol Analysis and
Prediction System (NAAPS). Weekly sample collection of precipitation from this interval occurred
on 30 Jun 2020. All sites contained Pb isotopic evidence for Saharan dust influence as indicated
by the median ∆208/206 value of 0.0068 (see text for explanation). Sites shown on the 29 Jun
2020 image correspond to the sample sites in the data table in the online supplement (https://
doi.org/10.1175/BAMS-D-20-0212.2). DL = Devil’s Lake, Wisconsin.
Pb isotopic compositions of the precipitation samples have generally comparable composi-
tions to previous North American sample sets (Fig. 2). However, the relatively high 208Pb/206Pb
in some samples tend toward dust compositions that closely resemble residual particulate
compositions measured in Cape Verde aerosols during summer incursions of the Saharan air
layer (Kumar et al. 2018). Deviations in precipitation Pb isotopic composition are correlated to
AMERICAN METEOROLOGICAL SOCIETY F E B R UA RY 2 0 2 2 E284
Unauthenticated | Downloaded 06/16/22 10:56 AM UTCindependent observations of Saharan dust spreading across the sampling area, motivating a
more precise evaluation of the timing and magnitude of these isotopic deviations.
Using our high-precision Pb isotope data in samples collected prior to the arrival of the
Saharan dust storm, we establish the North American atmospheric trend line (NATL), and
argue that deviations from this trend line are the result of non–locally produced atmospheric
dust inputs in our dataset. This approach is similar to that of Hart (1984), who established
the “Northern Hemisphere reference line” to discriminate between compositionally variable
midocean ridge basalts, and has also been applied in studies of external atmospheric influ-
ences in snow layers (e.g., Bory et al. 2014). In the case of the NATL, high-precision Pb data
are critical for evaluating changes in atmospheric composition. Pb isotopic compositions from
the same sample locations are not necessarily the same through time, but should lie on the
same trend line during time periods of predominately local dust inputs to the atmosphere.
The equation for the NATL reference line is
208
Pb 206
PbNATL = 1.6665( 207 Pb 206
Pb) + 0.6616.(1)
The vertical deviation along the y axis from this line can be used to determine external
atmospheric inputs in the measured 208Pb/206Pb of a sample (208Pb/206PbM), e.g., from Saharan
dust, expressed in delta notation as
∆208/206 = 208 Pb 206
Pb M – 208 Pb 206
PbNATL .(2)
This metric can then be used to evaluate the presence of foreign atmospheric inputs through
time. The ∆208/206 value should be nearly zero when only local dust sources are present in the
atmosphere, whereas this number should deviate from zero in the presence of foreign dust inputs.
Isotopic compositions of Saharan dust samples collected from Cape Verde showed that particulates
from Saharan dust storms contain components of both anthropogenic and geologically derived
Pb. The NATL trends toward the anthropogenic components documented by Kumar et al. (2018),
while the geological components sit above the NATL in Fig. 2. Therefore, the ∆208/206 value is
positive when geologically derived Saharan dust is present in the North American atmosphere.
Impact of Saharan dust
Calculated ∆208/206 through time for the southeastern U.S. precipitation samples reveal a
characteristic shift in Pb isotopic composition associated with Saharan dust (Fig. 3). Samples
with end collection dates of 16 and 23 June 2020 have ∆208/206 less than 0.002, with the
exception of one sample from Big Bend, Texas (site TX04; 23 June 2020), and a sample from
El Verde, Puerto Rico (site PR20; 23 June 2020). These earlier arrival times are consistent with
Satellite observations from the NASA Suomi National Polar-Orbiting Partnership satellite
system (www.nasa.gov/feature/goddard/2020/nasa-noaa-s-suomi-npp-satellite-analyzes-
saharan-dust-aerosol-blanket) showing that these two sites were under the spreading Sahara
dust in the atmosphere earlier in the sampling period than the other sites. These samples
reflect isotopic ratios in this first week consistent with ratios influenced by the Saharan dust
and seen at all other sites in the next 7-day period. The sampling operator noted the presence
of “dense desert dust” over Puerto Rico during this collection date, providing observational
confirmation of the influence of Saharan dust on the atmospheric Pb isotopic composition.
Desert dust was not noted in the Texas sampling data; however, the total Pb content of the
Texas sample was approximately an order of magnitude greater than the median Pb content
for all samples (1.12 ng g−1 vs a median of 0.075 ng g−1).
During the primary influx of Saharan dust across the southeastern United States, ∆208/206
values were higher relative to values from the previous sampling intervals. For sampling
AMERICAN METEOROLOGICAL SOCIETY F E B R UA RY 2 0 2 2 E285
Unauthenticated | Downloaded 06/16/22 10:56 AM UTCintervals ending on 30 June 2020, ∆208/206
values ranged from 0.0031 at site AL99 to
0.0218 at site PR20, with a median value of
0.0068. In the week after the peak (end col-
lection dates of 7–8 July 2020), some sites
returned to predust compositions while
others maintained some degree of elevated
∆208/206 up to 0.0064 in FL41, with a me-
dian value of 0.0029. These data show that
the maximum influence of Saharan dust oc-
curred during the sampling interval from 23
to 30 June 2020, and that the peak of Saha-
ran dust impact is relatively short, probably
spanning less than 2 weeks.
Unlike the isotopic compositions, total
Pb content and 210Pb activities generally did Fig. 2. Diagram showing the trend line for ² 08Pb/ ² 06Pb vs
not change across the southeastern United ² 07Pb/ ² 06Pb for North American atmospheric samples and
States during the peak of Saharan dust Saharan dust source samples. Isotopic trends result from
mixing of various geogenic and anthropogenic sources
influence. There were two exceptions, one
that vary depending on the sampling region, sources that
being the TX04 (1.12 ng g−1 Pb) sample with can be distinguished by chemical processing procedures
an end collection date of 23 June 2020, and (e.g., Kumar et al. 2018). The labile component reflects an-
the PR20 sample (0.306 ng g−1 Pb) with an thropogenic Pb, whereas the residual component is what
end collection date of 30 June 2020. These remains after the labile component has been removed by
elevated total Pb contents also correspond acid leaching. Foreign geogenic atmospheric inputs, such
as dust from the Bodélé Depression or other geogenic
to higher 210Pb activities. Excluding these
Saharan dust sources, cause a deviation in atmospheric Pb
samples, 210Pb activities ranged from 0.014 isotopic composition away from typical North American at-
to 0.129 Bq kg−1, and are generally consistent mospheric compositions. The North American atmospheric
with 210Pb activities in precipitation (e.g., trend line (NATL) used in this study is shown for reference,
Settle et al. 1982). These data indicate that and intersects the anthropogenic component represented
while the Saharan dust impacted the stable by the labile Pb ratios in Cape Verde aerosols collected
during a Saharan air layer incursion. Data sources: North
Pb isotopic composition, it did not have a sig-
American aerosols (Bollhöfer and Rosman 2001), Great Lakes
nificant impact on the Pb content or 210Pb ac- precip. (Sherman et al. 2015), North American snowpack
tivity of the atmosphere. This lack of impact (Simonetti et al. 2000a,b), Cape Verde (Kumar et al. 2018),
on the total and radioactive Pb components of Bodélé Depression (Abouchami et al. 2013).
the atmosphere is consistent with the largely
geological origins of Saharan dust suggested
in recent isotopic studies of North Atlantic dust sources (e.g., Conway et al. 2019), and shown
isotopically when comparing our dataset to the isotopic compositions of residual particulate
components from Kumar et al. (2018).
The lack of significant change in the total Pb flux due to this Saharan dust event provides
insight into observations made in previous studies aimed at detecting such dust influence us-
ing Pb isotopes in sedimentary records. This dust storm influenced the southeastern U.S. sites
for approximately 2 weeks, accounting for about 4% of the yearly Pb budget, with an associated
isotopic shift of ~0.7% (i.e., median ∆8/6 = 0.0068). These basic metrics, along with the fre-
quency of storms of this magnitude, suggests that an isotopic signal for Saharan dust would be
difficult to detect in the sedimentary record. Even if the depositional system is able to preserve
the dust in place (e.g., in lake sediments), the isotopic leverage of this dust is unlikely to have
a significant impact on the isotopic compositions preserved in the sedimentary record con-
sistent with observations by Abouchami et al. (2013) in the Amazon and Escobar et al. (2013)
in Florida. Therefore, soil/sediment studies of dust impacts using Pb isotopes are unlikely
AMERICAN METEOROLOGICAL SOCIETY F E B R UA RY 2 0 2 2 E286
Unauthenticated | Downloaded 06/16/22 10:56 AM UTCto provide a robust met-
ric of dust influence in
these landscapes. Given
the recognized impor-
tance of atmospheric
dust transport through-
out Earth’s history, we
argue that Pb isotopes
are best suited to detect
short-term atmospheric
changes in “real-time”
samples, and additional
Fig. 3. Isotopic shift in precipitation samples due to influence of Saharan dust as
chemical and isotopic recorded by the ∆208/206 value. (a) Diagram showing ∆208/206 vs the end col-
parameters are neces- lection date over week-long sampling intervals. The filled black circles indicate
sary for detecting dust samples used to calculate the NATL measured in southeastern U.S. precipitation
components in the sedi- prior to arrival of the Saharan dust. The peak of dust influence occurred in the
mentary record. sampling interval from 23 to 30 Jun 2020, where all samples deviated to higher
∆208/ 206. (b) ² 08Pb/ ² 04Pb vs ² 06Pb/ ² 04Pb for samples in this study, Cape Verde
aerosol samples collected during a Saharan dust incursion during summer 2013
Summary split into the labile (anthropogenic) and residual (geologic) portions by acid
Atmospheric dust leaching (Kumar et al. 2018), Bodélé Depression dust (Abouchami et al. 2013),
storms are responsible and the NATL. The solid line is a linear regression fit to the same samples used
for sig nif icant mass to calculate the NATL for ² 08Pb/ ² 06Pb vs ² 07Pb/ ² 06Pb. Devil’s Lake was sampled for
transfer across Earth’s quality control purposes and falls on the NATL, consistent with its endorheic
characteristics.
surface, but efforts to
detect an isotopic dust
signal in the sedimen-
tary record have been ambiguous. In this study, we took advantage of a large Saharan dust
storm that crossed the Atlantic Ocean and blanketed the southeastern United States. Rapid
response and coordination with NADP helped establish a predust background, which was
then used to detect an isotopic shift in precipitation samples collected when the Saharan dust
arrived. This shift lasted for ~2 weeks and did not cause changes in total Pb content, likely due
to the primarily geological source of the dust. The relatively low flux of Pb suggests that
dust storms of this frequency and magnitude would have little leverage on the sedimentary
isotopic record. However, we did detect a shift in the Pb isotopic composition (indicated by
a change in the 208Pb/206Pb relative to the 207Pb/206Pb, referred to as the ∆208/206) consistent
with previously published data on geologically sourced Saharan dust. This study also pro-
vides further support for utilizing NADP infrastructure to detect rapid, short-term changes in
atmospheric conditions. Longer-term studies using NADP infrastructure that utilize isotopic
composition data over longer time periods could provide a more quantitative analysis of the
total quantities of dust being deposited over a given area. In addition, such studies could
document ongoing changes in dust flux associated with changing climate and weather pat-
terns that are expected to occur in the future.
Acknowledgments. We thank the staff of the National Atmospheric Deposition Program (http://nadp.
slh.wisc.edu/), specifically Amy Mager, for quickly reacting to requests for sample preservation. Wafa
Abouchami, as well as two anonymous reviewers, provided critical feedback that greatly improved
the quality of the manuscript.
AMERICAN METEOROLOGICAL SOCIETY F E B R UA RY 2 0 2 2 E287
Unauthenticated | Downloaded 06/16/22 10:56 AM UTCAppendix A: National Atmospheric Deposition Program
NADP was organized by the U.S. State Agricultural Experiment Stations as a precipitation
chemistry monitoring network in 1977, and has expanded over time to include several net-
works of monitoring stations that provide atmospheric deposition data across the United
States. The largest grid is the National Trends Network (NTN) operating 263 sites that provide
long-term records of precipitation chemistry away from urban areas and point sources of pol-
lution. Samples are collected weekly, with a wet deposition only system that opens to a bucket
collector during precipitation events. One exception is the PR20 site that also collected some
dry deposition during the sampling period (i.e., the bucket was open to the atmosphere con-
tinuously). Samples are transferred in the field to low-density polyethylene (LDPE) containers
cleaned at the Central Analytical Laboratory (CAL) housed at the Wisconsin State Laboratory
of Hygiene (WSLH). On arrival at the CAL, aliquots are transferred for the primary NTN analy-
ses and separate aliquots are stored in the sample archive. Excess precipitation was set aside
for analyses in this study. NADP transferred from the University of Illinois to WSLH in 2018.
NADP is well suited for detection of atmospheric events due to its spatial coverage. Previ-
ous efforts to identify short-term atmospheric anomalies include the detection of fission
products after the Fukushima Dai-ichi Nuclear Power Station incident of 12 March 2011
(Wetherbee et al. 2012).
Appendix B: Analytical methods
The primary goal of the analytical methods used for this study were to detect an atmospheric
signal while minimizing the complexity of sample processing procedures. To achieve this
goal, the excess precipitation samples set aside from the NADP NTN were transferred to the
Trace Elements Clean Laboratory (TECL) at WSLH in their primary 1-L Nalgene LDPE sample
bottles. To resuspend any dust that had settled on the bottoms of the containers, samples
were shaken, then transferred gravimetrically to cleaned 1-L Teflon perfluoroalkoxy alkane
(PFA) jars. Total sample weights ranged from ~200 to 950 g. The samples were then taken to
dryness over ~2 days on a hotplate at 110°C in a high-efficiency particulate air (HEPA)-filtered
laminar-flow hood. To assess any possible contamination from the long drying period, empty
1 L PFA jars were placed in the hood during the drying procedure and treated as unknowns.
Cleaned NADP sampling bottles were also tested for Pb contamination by filling bottles with
18.2 MΩ cm H2O, sitting for approximately 4 days, then transferring the H2O to 1-L PFA jars
and taken to dryness.
Reference materials with comparable matrices were not available, and we opted to collect
two separate lake water samples from Devil’s Lake, Wisconsin, in 2-L PFA bottles for an assess-
ment of quality control for Pb isotopic compositions. Devil’s Lake was chosen because it is
endorheic, suggesting that its isotopic composition should reflect local atmospheric signals.
The Devil’s Lake samples were treated as unknowns using the same procedures as those used
for the precipitation samples. We also used National Research Council–Canada reference
material SLRS-6 (river water) for quality control for the total Pb contents measured by isotope
dilution. Approximately 5-mL aliquots of SLRS-6 were weighed into 23-mL PFA jars for this
purpose. All samples were processed using Optima Grade acids and Type 1 (18.2 MΩ cm) H2O.
After drying, samples were redissolved in 9.9 mL of 16-M HNO3 and 0.1 mL of 29-M HF. One
milliliter of this sample solution was transferred to a separate 23-mL PFA jar, and spiked with
a known quantity of 206Pb isotopic tracer for isotope dilution analysis (along with the SLRS-6
aliquots). The isotope dilution aliquot and remaining 9-mL bulk sample (isotopic composition
aliquot) were both dried, then redissolved in either 0.6 mL of 1-M HBr (isotope dilution) or
1.8 mL of 1-M HBr (isotopic composition) for Pb purification after Strelow and Torien (1966).
Sample solutions were loaded onto BioRad Polyprep columns containing 0.6 mL of previously
cleaned AG1-X8 anion exchange resin conditioned in 1-M HBr. After loading, the bulk sample
AMERICAN METEOROLOGICAL SOCIETY F E B R UA RY 2 0 2 2 E288
Unauthenticated | Downloaded 06/16/22 10:56 AM UTCmatrix was eluted using washes of 0.6, 1.2, 1.2, and 4.8 mL of 1-M HBr. Pb was collected in
previously cleaned 15-mL PFA jars using two 0.6-mL washes of H2O, followed by two 3.6-mL
washes of 1-M HNO3. Purified Pb solutions were dried, then redissolved in 2% (0.5-M) HNO3
in preparation for isotopic analysis using MC-ICPMS.
All isotopic analyses were performed on the NeptunePlus MC-ICPMS (Thermo Fisher Scien-
tific Inc., Waltham, Massachusetts) housed in the TECL at WSLH. Samples were introduced
into the plasma in 2% HNO3 using an Aridus 3 desolvating nebulizer system (Teledyne Cetac)
with the Jet sampler cone and X skimmer cone configuration. Three isotopic measurements
were completed for each sample. The first analysis used the unspiked samples to measure the
stable Pb isotopic composition. Thallium (Tl) was added to each sample to correct for mass bias
using the exponential fractionation law and assuming 205Tl/203Tl = 2.387. The 206Pb, 207Pb, and
208
Pb were measured on the high 1, high 2, and high 3 Faraday cups, respectively, and 204Pb
was measured on the low 1 Faraday cup. 205Tl was measured on the center Faraday cup, and
203
Tl was measured on the low 2 Faraday cup. The low 3 Faraday cup was used to monitor for
Hg interferences by measuring the 202Hg isotope. Isotope ratios were measured in static mode
for 60 cycles of 8-s integrations. The international Pb reference material NBS981 was measured
periodically, and final isotope ratios are reported relative to NBS981 values of Thirlwall (2002).
Final analyte concentrations were 10 ppb Pb + 3 ppb Tl. All samples and NBS981 standards
were corrected for on-peak baselines by measuring a blank 2% HNO3 solution before every
sample and standard analysis. One bottle of the Devil’s Lake water gave 208Pb/206Pb = 2.0490
± 0.0010 and 207Pb/206Pb = 0.8329 ± 0.0004 (2 std dev, n = 3). A second bottle of Devil’s Lake
water was analyzed once, and gave 208Pb/206Pb = 2.0412 and 207Pb/206Pb = 0.8283, a value
distinct from the first bottle. These samples were unfiltered, and their variations likely reflect
different proportions of unfiltered solids present in the lake water. However, both samples
have ∆208/206 within 0.001 of the NATL, consistent with local atmospheric origins.
The second analysis used the spiked samples to measure the 208Pb/206Pb ratio for the isotope
dilution calculation for total Pb content. The procedure was similar to that used for the stable
isotopic composition measurements (i.e., Tl-normalization and seven Faraday collectors), except
samples were analyzed for 30 cycles of 4-s integrations. The NBS981 standard was measured
before and after every sample (sample-standard bracketing), and the final 208Pb/206Pb ratio
for the isotope dilution calculation was normalized to the NBS981 value of Thirlwall (2002).
Final analyte concentrations were 1–5 ppb Pb + 1 ppb Tl. All samples and NBS981 standards
were corrected for on-peak baselines by measuring a blank 2% HNO3 solution before every
sample and standard analysis. Results for SLRS-6 gave 0.173 ± 0.003 ng g−1 Pb (1 std dev, n = 4),
consistent with the certificate value of 0.170 ± 0.026 µg L−1. Results for the three analyses of
one bottle of Devil’s Lake water were 0.030 ± 0.001 ng g−1 Pb (1 std dev, n = 3). The second
bottle was measured at 0.019 ng g−1 Pb, confirming the heterogeneity of the unfiltered lake
water indicated by the isotopic compositions.
The third analysis used the remaining unspiked sample solutions to measure the 210Pb/208Pb
ratio for calculation of the 210Pb activity. The analytical procedure followed methods described
in Scott et al. (2019); the central secondary electron multiplier/retarding potential quadrupole
(SEM/RPQ) was used to measure the 210Pb beam and the low 2 Faraday cup was used to measure
the 208Pb. Small remaining sample volumes prevented direct measurement of the 208Pb tail
on 210Pb. Instead, samples were corrected for tailing of 208Pb onto 210Pb by measuring the
abundance sensitivity at 2 amu (55 ppb) in an NBS981 standard and using this to correct the
210
Pb counts based on the 208Pb intensity in each sample. Prior to the analyses, a 234U beam
was used to calculate the transmission factor for the RPQ. 210Pb/208Pb ratios were measured in
static mode for 10 cycles of 4-s integrations. All samples were corrected for on-peak baselines
using a blank 2% HNO3 solution. The final 210Pb activity was calculated using the stable Pb
isotopic composition and total Pb content measured by isotope dilution. Scott et al. (2019)
AMERICAN METEOROLOGICAL SOCIETY F E B R UA RY 2 0 2 2 E289
Unauthenticated | Downloaded 06/16/22 10:56 AM UTCestimated uncertainties for this method at ~30% due to the large tail corrections and uncer- tainty in transmission. The standard deviation of three measurements of one bottle of Devil’s Lake water was ~8.0% for the final 210Pb activity in Bq kg-1. Procedural and bottle testing blanks were analyzed for Pb contents and isotopic composi- tions; however, Pb blanks did not provide sufficient material for an accurate measurement of the blank Pb isotopic composition. Total procedural blanks that included the blank PFA jar drying procedure amounted to
References
Aarons, S. M., S. M. Aciego, and J. D. Gleason, 2013: Variable Hf–Sr–Nd radiogenic Ganor, E., and Y. Mamane, 1982: Transport of Saharan dust across the eastern
isotopic compositions in a Saharan dust storm over the Atlantic: Implications Mediterranean. Atmos. Environ., 16, 581–587, https://doi.org/10.1016/0004-
for dust flux to oceans, ice sheets and the terrestrial biosphere. Chem. Geol., 6981(82)90167-6.
349–350, 18–26, https://doi.org/10.1016/j.chemgeo.2013.04.010. Goudie, A. S., 1983: Dust storms in space and time. Prog. Phys. Geogr., 7, 502–
—, M. A. Blakowski, S. M. Aciego, E. I. Stevenson, K. W. W. Sims, S. R. Scott, and 530, https://doi.org/10.1177/030913338300700402.
C. Aarons, 2017: Geochemical characterization of critical dust source regions —, and N. J. Middleton, 2001: Saharan dust storms: Nature and consequences.
in the American West. Geochim. Cosmochim. Acta, 215, 141–161, https://doi. Earth-Sci. Rev., 56, 179–204, https://doi.org/10.1016/S0012-8252(01)00067-8.
org/10.1016/j.gca.2017.07.024. Graney, J. R., and M. S. Landis, 2013: Coupling meteorology, metal concen-
Abouchami, W., and Coauthors, 2013: Geochemical and isotopic characterization trations, and Pb isotopes for source attribution in archived precipitation
of the Bodélé Depression dust source and implications for transatlantic dust samples. Sci. Total Environ., 448, 141–150, https://doi.org/10.1016/j.scito-
transport to the Amazon basin. Earth Planet. Sci. Lett., 380, 112–123, https:// tenv.2012.07.031.
doi.org/10.1016/j.epsl.2013.08.028. —, A. N. Halliday, G. J. Keeler, J. O. Nriagu, J. A. Robbins, and S. A. Norton,
Aciego, S. M., and Coauthors, 2017: Dust outpaces bedrock in nutrient supply to 1995: Isotopic record of lead pollution in lake sediments from the northeast-
montane forest ecosystems. Nat. Commun., 8, 14800, https://doi.org/10.1038/ ern United States. Geochim. Cosmochim. Acta, 59, 1715–1728, https://doi.
ncomms14800. org/10.1016/0016-7037(95)00077-D.
Baddock, M. C., J. E. Bullard, and R. G. Bryant, 2009: Dust source identification Grousset, F. E., and P. E. Biscaye, 2005: Tracing dust sources and transport pat-
using MODIS: A comparison of techniques applied to the Lake Eyre basin, terns using Sr, Nd, and Pb isotopes. Chem. Geol., 222, 149–167, https://doi.
Australia. Remote Sens. Environ., 113, 1511–1528, https://doi.org/10.1016/ org/10.1016/j.chemgeo.2005.05.006.
j.rse.2009.03.002. Hamelin, B., F. E. Grousset, P. E. Biscaye, and A. Zindler, 1989: Lead isotopes in
Bollhöfer, A., and K. J. R. Rosman, 2000: Isotopic source signatures for atmospheric trade wind aerosols at Barbados: The influence of European emissions over the
lead: The Southern Hemisphere. Geochim. Cosmochim. Acta, 64, 3251–3262, North Atlantic. J. Geophys. Res., 94, 16 243–16 250, https://doi.org/10.1029/
https://doi.org/10.1016/S0016-7037(00)00436-1. JC094iC11p16243.
—, and —, 2001: Isotopic source signatures for atmospheric lead: The Hart, S. R., 1984: A large-scale isotope anomaly in the Southern Hemisphere mantle.
Northern Hemisphere. Geochim. Cosmochim. Acta, 65, 1727–1740, https:// Nature, 309, 753–757, https://doi.org/10.1038/309753a0.
doi.org/10.1016/S0016-7037(00)00630-X. Kamenov, G. D., M. Brenner, and J. L. Tucker, 2009: Anthropogenic versus natural
Bory, A. J.-M., W. Abouchami, S. J. G. Galer, A. Svensson, J. N. Christensen, and P. control on trace element and Sr–Nd–Pb isotope stratigraphy in peat sedi-
E. Biscaye, 2014: A Chinese imprint in insoluble pollutants recently deposited ments of southeast Florida (USA), ~1500 AD to present. Geochim. Cosmo-
in central Greenland as indicated by lead isotopes. Environ. Sci. Technol., 48, chim. Acta, 73, 3549–3567, https://doi.org/10.1016/j.gca.2009.03.017.
1451–1457, https://doi.org/10.1021/es4035655. Kelly, A. E., M. K. Reuer, N. F. Goodkin, and E. A. Boyle, 2009: Lead concentrations
Boyle, E. A., and Coauthors, 2014: Anthropogenic lead emissions in the ocean: and isotopes in corals and water near Bermuda, 1780–2000. Earth Planet. Sci.
The evolving global experiment. Oceanography, 27 (1), 69–75, https://doi. Lett., 283, 93–100, https://doi.org/10.1016/j.epsl.2009.03.045.
org/10.5670/oceanog.2014.10. Kumar, A., W. Abouchami, S. J. G. Galer, V. H. Garrison, E. Williams, and M. O.
Callender, E., and P. C. Van Metre, 1997: Reservoir sediment cores show U.S. Andreae, 2014: A radiogenic isotope tracer study of transatlantic dust
lead declines. Environ. Sci. Technol., 31, 424A–428A, https://doi.org/10.1021/ transport from Africa to the Caribbean. Atmos. Environ., 82, 130–143,
es972473k. https://doi.org/10.1016/j.atmosenv.2013.10.021.
Chiapello, I., G. Bergametti, B. Gomes, and B. Chatenet, 1995: An additional —, —, —, S. P. Singh, K. W. Fomba, J. M. Prospero, and M. O. Andreae,
low layer transport of Sahelian and Saharan dust over the north-eastern 2018: Seasonal radiogenic isotopic variability of the African dust outflow to
tropical Atlantic. Geophys. Res. Lett., 22, 3191–3194, https://doi.org/ the tropical Atlantic Ocean and across to the Caribbean. Earth Planet. Sci.
10.1029/95GL03313. Lett., 487, 94–105, https://doi.org/10.1016/j.epsl.2018.01.025.
Conway, T. M., D. S. Hamilton, R. U. Shelley, A. M. Aguilar-Islas, W. M. Landing, N. Muhs, D. R., C. A. Bush, K. C. Stewarts, T. R. Rowland, and R. C. Crittenden, 1990:
M. Mahowald, and S. G. John, 2019: Tracing and constraining anthropogenic Geochemical evidence of Saharan dust parent material for soils developed on
aerosol iron fluxes to the North Atlantic Ocean using iron isotopes. Nat. Com- quaternary limestones of Caribbean and western Atlantic islands. Quat. Res.,
mun., 10, 2628, https://doi.org/10.1038/s41467-019-10457-w. 33, 157–177, https://doi.org/10.1016/0033-5894(90)90016-E.
Duce, R. A., C. K. Unni, B. J. Ray, J. M. Prospero, and J. T. Merrill, 1980: Long-range Perry, K. D., T. A. Cahill, R. A. Eldred, and D. Dutcher, 1997: Long-range transport
atmospheric transport of soil dust from Asia to the tropical North Pacific: of North African dust to the eastern United States. J. Geophys. Res., 102,
Temporal variability. Science, 209, 1522–1524, https://doi.org/10.1126/sci- 11 225–11 238, https://doi.org/10.1029/97JD00260.
ence.209.4464.1522. Petit, J.-R., M. Briat, and A. Royer, 1981: Ice Age aerosol content from East Antarc-
Eisenreich, S. J., N. A. Metzer, and N. R. Urban, 1986: Response of atmospheric tic ice core samples and past wind strength. Nature, 293, 391–394, https://
lead to decreased use of lead in gasoline. Environ. Sci. Technol., 20, 171–174, doi.org/10.1038/293391a0.
https://doi.org/10.1021/es00144a010. Prospero, J. M., and T. N. Carlson, 1972: Vertical and areal distribution of Saharan
Erel, Y., and J. Torrent, 2010: Contribution of Saharan dust to Mediterranean soils dust over the western equatorial North Atlantic Ocean. J. Geophys. Res., 77,
assessed by sequential extraction and Pb and Sr isotopes. Chem. Geol., 275, 5255–5265, https://doi.org/10.1029/JC077i027p05255.
19–25, https://doi.org/10.1016/j.chemgeo.2010.04.007. Rayegani, B., S. Barati, H. Goshtasb, S. Gachpaz, J. Ramezani, and H. Sarkheil, 2020:
Escobar, J., T. J. Witmore, G. D. Kamenov, and M. A. Riedinger-Whitmore, 2013: Sand and dust storm sources identification: A remote sensing approach. Ecol.
Isotope record of anthropogenic lead pollution in lake sediments of Florida, Indic., 112, 106099, https://doi.org/10.1016/j.ecolind.2020.106099.
USA. J. Paleolimnol., 49, 237–252, https://doi.org/10.1007/s10933-012- Sassen, K., 2002: Indirect climate forcing over the western US from Asian dust
9671-9. storms. Geophys. Res. Lett., 29, 1465, https://doi.org/10.1029/2001GL014051.
Ewing, S. A., J. S. Christensen, S. T. Brown, R. A. VanCuren, S. S. Cliff, and Schütz, L., and M. Sebert, 1987: Mineral aerosols and source identification. J.
D. J. DePaolo, 2010: Pb isotopes as an indicator of the Asian contribution Aerosol Sci., 18, 1–10, https://doi.org/10.1016/0021-8502(87)90002-4.
to particulate air pollution in urban California. Environ. Sci. Technol., 44, Scott, S. R., and Coauthors, 2019: The application of abundance sensitivity fil-
8911–8916, https://doi.org/10.1021/es101450t. ters to the precise and accurate measurement of uranium series nuclides
AMERICAN METEOROLOGICAL SOCIETY F E B R UA RY 2 0 2 2 E291
Unauthenticated | Downloaded 06/16/22 10:56 AM UTCby plasma mass spectrometry. Int. J. Mass Spectrom., 435, 321–332, Tegen, I., M. Werner, S. P. Harrison, and K. E. Kohfeld, 2004: Relative im-
https://doi.org/10.1016/j.ijms.2018.11.011. portance of climate and land use in determining present and future
Settle, D. M., C. C. Patterson, K. K. Turekian, and J. K. Cochran, 1982: Lead pre- global soil dust emission. Geophys. Res. Lett., 31, L05105, https://doi.
cipitation fluxes at tropical ocean sites determined from 210Pb measurements. org/10.1029/2003GL019216.
J. Geophys. Res., 87, 1239–1245, https://doi.org/10.1029/JC087iC02p01239. Thirlwall, M. F., 2002: Multicollector ICP-MS analysis of Pb isotopes using a
Sherman, L. S., J. D. Blum, J. T. Dvonch, L. E. Gratz, and M. S. Landis, 2015: The use 207pb-204pb double spike demonstrates up to 400 ppm/amu systematic er-
of Pb, Sr, and Hg isotopes in Great Lakes precipitation as a tool for pollution rors in Tl-normalization. Chem. Geol., 184, 255–279, https://doi.org/10.1016/
source attribution. Sci. Total Environ., 502, 362–374, https://doi.org/10.1016/ S0009-2541(01)00365-5.
j.scitotenv.2014.09.034. Torfstein, A., and Coauthors, 2017: Chemical characterization of atmospheric dust
Shirahata, H., R. W. Elias, C. C. Patterson, and M. Koide, 1980: Chronological varia- from a weekly time series in the north Red Sea between 2006 and 2010. Geochim.
tions in concentrations and isotopic compositions of anthropogenic atmo- Cosmochim. Acta, 211, 373–393, https://doi.org/10.1016/j.gca.2017.06.007.
spheric lead in sediments of a remote subalpine pond. Geochim. Cosmochim. Washington, R., M. Todd, N. J. Middleton, and A. S. Goudie, 2003: Dust-storm
Acta, 44, 149–162, https://doi.org/10.1016/0016-7037(80)90127-1. source areas determined by the total ozone monitoring spectrometer and
Simonetti, A., C. Gariépy, and J. Carignan, 2000a: Pb and Sr isotopic compositions surface observations. Ann. Assoc. Amer. Geogr., 93, 297–313, https://doi.
of snowpack from Québec, Canada: Inferences on the sources and deposition org/10.1111/1467-8306.9302003.
budgets of atmospheric heavy metals. Geochim. Cosmochim. Acta, 64, 5–20, Wetherbee, G. A., D. A. Gay, T. M. Debey, C. M. B. Lehmann, and M. A. Nilles, 2012:
https://doi.org/10.1016/S0016-7037(99)00207-0. Wet deposition of fission-product isotopes to North America from the Fuku-
—, —, and —, 2000b: Pb and Sr isotopic evidence for sources of shima Dai-ichi incident, March 2011. Environ. Sci. Technol., 46, 2574–2582,
atmospheric heavy metals and their deposition budgets in northeastern https://doi.org/10.1021/es203217u.
North America. Geochim. Cosmochim. Acta, 64, 3439–3452, https://doi. Yu, H., and Coauthors, 2015: The fertilizing role of African dust in the Amazon
org/10.1016/S0016-7037(00)00446-4. rainforest: A first multiyear assessment based on data from Cloud-Aerosol
Strelow, F. W. E., and F. V. S. Toerien, 1966: Separation of lead(II), from bismuth(III), Lidar and Infrared Pathfinder Satellite Observations. Geophys. Res. Lett., 42,
thallium(III), cadmium(II), mercury(II), gold(III), platinium(IV), palladium(II), 1984–1991, https://doi.org/10.1002/2015GL063040.
and other elements by anion exchange chromatography. Anal. Chem., 38, Zurbrick, C. M., and Coauthors, 2018: Dissolved Pb and Pb isotopes in the North
545–548, https://doi.org/10.1021/ac60236a006. Atlantic from the GEOVIDE transect (GEOTRACES GA-01) and their decadal
Swap, R., M. Garstang, and S. Greco, 1992: Saharan dust in the Amazon basin. evolution. Biogeosciences, 15, 4995–5014, https://doi.org/10.5194/bg-15-
Tellus, 44B, 133–149, https://doi.org/10.3402/tellusb.v44i2.15434. 4995-2018.
AMERICAN METEOROLOGICAL SOCIETY F E B R UA RY 2 0 2 2E292
Unauthenticated | Downloaded 06/16/22 10:56 AM UTCYou can also read


