LONG-TERM PERTURBATION OF THE PERIPHERAL IMMUNE SYSTEM MONTHS AFTER SARS-COV-2 INFECTION
←
→
Page content transcription
If your browser does not render page correctly, please read the page content below
Ryan et al. BMC Medicine      (2022) 20:26
https://doi.org/10.1186/s12916-021-02228-6

 RESEARCH ARTICLE                                                                                                                                   Open Access

Long-term perturbation of the peripheral
immune system months after SARS-CoV-2
infection
Feargal J. Ryan1†, Christopher M. Hope2,3†, Makutiro G. Masavuli4†, Miriam A. Lynn1†, Zelalem A. Mekonnen4,
Arthur Eng Lip Yeow4, Pablo Garcia-Valtanen4, Zahraa Al-Delfi4, Jason Gummow5, Catherine Ferguson6,
Stephanie O’Connor7, Benjamin A. J. Reddi7, Pravin Hissaria6, David Shaw6, Chuan Kok-Lim6,8,
Jonathan M. Gleadle9,10, Michael R. Beard11, Simon C. Barry2,3*†, Branka Grubor-Bauk4*† and David J. Lynn1,10*†

  Abstract
  Background: Severe acute respiratory syndrome coronavirus 2 (SARS-CoV-2) is a highly infectious respiratory virus
  which is responsible for the coronavirus disease 2019 (COVID-19) pandemic. It is increasingly clear that recovered
  individuals, even those who had mild COVID-19, can suffer from persistent symptoms for many months after
  infection, a condition referred to as “long COVID”, post-acute sequelae of COVID-19 (PASC), post-acute COVID-19
  syndrome, or post COVID-19 condition. However, despite the plethora of research on COVID-19, relatively little is
  known about the molecular underpinnings of these long-term effects.
  Methods: We have undertaken an integrated analysis of immune responses in blood at a transcriptional, cellular,
  and serological level at 12, 16, and 24 weeks post-infection (wpi) in 69 patients recovering from mild, moderate,
  severe, or critical COVID-19 in comparison to healthy uninfected controls. Twenty-one of these patients were
  referred to a long COVID clinic and > 50% reported ongoing symptoms more than 6 months post-infection.

* Correspondence: simon.barry@adelaide.edu.au;
branka.grubor@adelaide.edu.au; david.lynn@sahmri.com
†
 Feargal J. Ryan, Christopher M. Hope, Makutiro G. Masavuli, Miriam A. Lynn
contribued equally as first authors. Simon C. Barry, Branka Grubor-Bauk and
David J. Lynn contributed equally as senior authors.
2
 Women’s and Children’s Health Network, North Adelaide, SA, Australia
4
 Viral Immunology Group, Adelaide Medical School, University of Adelaide
and Basil Hetzel Institute for Translational Health Research, Adelaide, SA,
Australia
1
 Precision Medicine Theme, South Australian Health and Medical Research
Institute, Adelaide, SA 5001, Australia
Full list of author information is available at the end of the article

                                        © The Author(s). 2022 Open Access This article is licensed under a Creative Commons Attribution 4.0 International License,
                                        which permits use, sharing, adaptation, distribution and reproduction in any medium or format, as long as you give
                                        appropriate credit to the original author(s) and the source, provide a link to the Creative Commons licence, and indicate if
                                        changes were made. The images or other third party material in this article are included in the article's Creative Commons
                                        licence, unless indicated otherwise in a credit line to the material. If material is not included in the article's Creative Commons
                                        licence and your intended use is not permitted by statutory regulation or exceeds the permitted use, you will need to obtain
                                        permission directly from the copyright holder. To view a copy of this licence, visit http://creativecommons.org/licenses/by/4.0/.
                                        The Creative Commons Public Domain Dedication waiver (http://creativecommons.org/publicdomain/zero/1.0/) applies to the
                                        data made available in this article, unless otherwise stated in a credit line to the data.
Ryan et al. BMC Medicine (2022) 20:26 Page 2 of 23 Results: Anti-Spike and anti-RBD IgG responses were largely stable up to 24 wpi and correlated with disease severity. Deep immunophenotyping revealed significant differences in multiple innate (NK cells, LD neutrophils, CXCR3+ monocytes) and adaptive immune populations (T helper, T follicular helper, and regulatory T cells) in convalescent individuals compared to healthy controls, which were most strongly evident at 12 and 16 wpi. RNA sequencing revealed significant perturbations to gene expression in COVID-19 convalescents until at least 6 months post-infection. We also uncovered significant differences in the transcriptome at 24 wpi of convalescents who were referred to a long COVID clinic compared to those who were not. Conclusions: Variation in the rate of recovery from infection at a cellular and transcriptional level may explain the persistence of symptoms associated with long COVID in some individuals. Keywords: SARS-CoV-2, COVID-19, Immunity, RNA-Seq, T cell, Antibody responses, Convalescent patients, Immunophenotyping, Long COVID, Post-acute sequelae of COVID-19 (PASC), Post COVID-19 condition, Infection Background Flow cytometric analysis of peripheral blood samples Coronavirus disease 2019 (COVID-19) is caused by the se- collected from convalescents in the USA (median 29 vere acute respiratory syndrome coronavirus 2 (SARS- days post-infection) has revealed altered frequencies of CoV-2), a highly infectious respiratory virus responsible innate and adaptive immune cell populations including for the ongoing global pandemic. COVID-19 usually pre- CD4+ and CD8+ T cell activation and exhaustion marker sents as an asymptomatic or mild to moderate respiratory expression in recovered individuals [15]. A similar study infection in previously healthy individuals with symptoms in Singapore (median 34 days post-infection) found in- that include fever, cough, headache, fatigue, myalgia, diar- creased levels of circulating endothelial cells and effector rhoea, and anosmia [1, 2]. However, in older individuals T cells in those recovering from active disease [16]. or in those with prior co-morbidities such as obesity or Single-cell RNA sequencing (scRNA-Seq) of peripheral cardiovascular disease, COVID-19 can quickly develop blood mononuclear cells (PMBC) from a small (n = 10) into a severe and life-threatening disease requiring urgent cohort of patients that were 7–14 days post-recovery also intensive care support. While the death toll from COVID- found an increased ratio of classical CD14+ monocytes 19 has been devastating (> 4.8 million as of 5 October with high inflammatory gene expression, decreased 2021 according to the Johns Hopkins University Corona- CD4+ and CD8+ T cells, and significantly increased virus Resource Center [3]), the vast majority of those in- plasma B cells [17]. scRNA-Seq profiling of PBMC gene fected fortunately do recover, with case fatality rates in expression in a larger cohort of recovering individuals most countries falling below 3%. It is now increasingly (n = 95) found those with severe disease (n = 36) had clear, however, that recovered individuals, even those who decreased plasmacytoid dendritic cells (pDCs) and in- had mild COVID-19, can suffer from persistent symptoms creased levels of proliferative effector memory CD8+ for many months after infection [4], which is commonly T cells, relative to healthy controls [18]. A potential referred to as long COVID. For example, a cohort study of limitation of this study, however, was that samples COVID-19 patients (median age 57) discharged from hos- from recovered individuals were not collected at uni- pital in Wuhan, China, 6 months prior, reported that 63% form timepoints during recovery, instead samples of patients presented with fatigue or muscle weakness, were collected between 9 and 126 days post-infection 23% sleep difficulties, and 23% anxiety or depression [5]. (on average 44.5 days). Longitudinal profiling of the Individuals who were previously severely ill during their transcriptome of PBMC collected from individuals (n hospital stay have ongoing impaired pulmonary function = 18) during treatment, convalescence, and recovery and abnormal chest imaging. Similar reports continue to phases of infection (up to 10 weeks post-infection) re- pour in from around the world [6–11]. While the majority vealed that relative to acute disease, recovery from of these reports involve patients who were hospitalised COVID-19 was marked by decreased expression of with COVID-19, persistent, albeit milder and less- genes involved in the interferon response, humoral frequent, symptoms have also been reported in non- immunity, and increased signatures indicative of T hospitalised individuals months after recovery [12]. These cell activation and differentiation [19]. However, these reports resemble similar post-infectious syndromes after responses were not compared with healthy controls. other infections, such as Ebola [13] and SARS-CoV-1 [14], Another recent study longitudinally profiled immune and suggest that there may be a long-lasting dysregulation cell populations and the blood transcriptome in > 200 of the immune response in individuals recovering from SARS-CoV-2-infected patients over 12 weeks from COVID-19. symptom onset to recovery [20]. They compared the
Ryan et al. BMC Medicine   (2022) 20:26                                                                          Page 3 of 23

blood transcriptome in 2-time bins (0–24 and 25–48 days         male, 36 female) representing a range of prior mild, mod-
from symptom onset) and found substantial changes rela-         erate, severe, and critical COVID-19 cases were recruited
tive to uninfected controls in immune cell populations and      (Table S1). COVID-19 disease severity was scored as per
increased expression of genes involved in immunometabo-         NIH descriptors [21] where 5 = “asymptomatic”, 4 =
lism and inflammation, which persisted after infection.         “mild”, 3 = “moderate”, 2 = “severe”, and 1 = “critical”
   Here, we have performed anti-receptor-binding domain         (Table S1). Blood samples were collected from convales-
(RBD) and anti-Spike serology, comprehensive multi-             cents at 12, 16, and 24 weeks (± 14 days) post the date of
parameter immunophenotyping, and transcriptome-wide             their initial PCR-positive test. Participation at each time-
RNA sequencing on blood collected from individuals recov-       point was determined by availability to attend follow-up
ering from mild/moderate or severe/critical COVID-19 at         sample collection clinics. Convalescent patients were re-
12, 16, and 24 weeks after their first positive SARS-CoV-2      quested to complete a retrospective questionnaire detail-
PCR test, as well as age-matched healthy controls (HCs).        ing self-reported symptoms related to long COVID at
Our analyses reveal robust but heterogenous humoral im-         each of the sampling timepoints in this study (Additional
munity in convalescents until at least 6 months post-           file 10). The survey was administered at approximately 18
infection. Deep immunophenotyping highlighted profound          months (mean 70.4 weeks, min 61 weeks, max 74 weeks)
changes in immune cell populations in COVID-19 conva-           post-infection. Additionally, we obtained clinical data indi-
lescents compared with HCs, particularly at 12 and 16           cating which convalescent individuals were referred to a
weeks post-infection (wpi). Furthermore, RNA sequencing         long COVID clinic run by the South Australian State
revealed significant changes in whole blood gene expression     health service (SA Health). The long COVID clinic pro-
for up to 24 wpi, even in individuals that had mild disease     vides a pathway of care focused on comprehensive clinical
without hospitalisation. Significant differences in gene ex-    care, psychological support, and rehabilitation to patients
pression were also identified at 24 wpi in convalescent indi-   living with long-term sequelae of COVID-19 disease.
viduals who were referred to a long COVID clinic                Patients were offered referral to this clinic at their
compared to those who were not. These data suggest that         18-month study visit, as the clinic was only estab-
SARS-CoV-2 infection leads to persistent changes to the         lished around that time. Clinical assessments from
peripheral immune system long after the infection is            this clinic are ongoing. Healthy controls (n = 14) in
cleared, which has important potential implications for un-     the same ranges of age and sex as the COVID-19
derstanding symptoms associated with long COVID. These          convalescent cohort were also recruited. Healthy con-
changes to the peripheral immune system could have impli-       trols had no respiratory disease, no positive COVID-
cations for how individuals recovering from infection re-       19 PCR test in 2020/21, no known significant sys-
spond to vaccination or other challenges encountered in         temic diseases, and negative anti-Spike and anti-RBD
this period and persistent immune activation may also ex-       serology. Blood (54 ml/individual) was collected in
acerbate other chronic conditions.                              serum separator (acid citrate dextrose (ACD)) tubes
                                                                or ethylenediaminetetraacetic acid (EDTA) tubes and
Methods                                                         processed for serum, peripheral blood mononuclear
Patient recruitment                                             cells (PBMCs), and plasma isolation. 2.5 mL of blood
Study participants were recruited via the Central Adelaide      for RNA sequencing was collected into PAXgene®
Health Network (CALHN). The study was performed in              tubes (762165 BD, North Ryde, Australia) and stored
accordance with the ethical principles consistent with the      at − 80 °C until processing. C-reactive protein (CRP)
latest version of the Declaration of Helsinki (version For-     titres were assayed by a National Association of Test-
taleza 2013) and Good Clinical Practice (GCP) and ac-           ing Authorities Australia-certified commercial path-
cording to the National Health and Medical Research             ology service (SA Pathology, Adelaide, Australia).
Council (NHMRC) Guidelines for Research published in
the National Statement on the Ethical Conduct in Human          SARS-CoV-2 PCR testing
Research (2007; updated 2018). The protocol was ap-             Extraction of RNA was achieved from nasopharyngeal
proved by CALHN Human Research Ethics Committee,                swabs using the Automated MagMAX nucleic acid ex-
Adelaide, Australia (Approval No. 13050). Inclusion cri-        traction protocol (Thermo Fisher) and RNA subjected to
teria were PCR-confirmed SARS-CoV-2 infection from              a one-step qRT-PCR using a Roche light cycler LC408II
nasopharyngeal swabs (which occurred in March & April           using cycle conditions described by Corman et al. [22].
of 2020 for all participants), the ability to attend study
follow-up visits, and voluntary informed consent. The           SARS-CoV-2 protein purification and ELISA
study size was determined in a pragmatic fashion by op-         Prefusion SARS-CoV-2 ectodomain (isolate WHU1,
portunistically recruiting as many participants as possible.    residues1-1208) with HexaPro mutations [23] (kindly
A total of 69 COVID-19 convalescent individuals (35             provided by Adam Wheatley) and SARS-Cov-2 receptor-
Ryan et al. BMC Medicine (2022) 20:26 Page 4 of 23
binding domain (RBD) with C-terminal His-tag [24] (resi- 1000). The stained PBMC were washed with 200 μL of
dues 319-541; kindly provided by Florian Krammer) were FACS wash, centrifuged 300×g for 4 min and fixed with
overexpressed in Expi293 cells and purified by Ni-NTA af- 200 μL FACS Fix for 20 min, RT, in dark. Fixed cells
finity and size-exclusion chromatography. Recombinant were then centrifuged 300×g for 4 min, washed in
proteins were analysed via a standard SDS-PAGE gel to 200 μL FACS wash then spun 300×g for 4 min, and re-
check protein integrity. Gels were stained with Comassie suspended in 50 μL FACS wash. The cells were resus-
Blue (Invitrogen) for 2 h and de-stained in distilled water pended and transferred to tubes before being analysed
overnight. MaxiSorp 96-well plates were coated overnight using a BD FACS Symphony within 3 days of staining/
at 4 °C with 5 μg/mL of recombinant RBD or S proteins. fixing.
After blocking with 5% w/v skim milk in 0.05% Tween-20/
PBS (PBST) at room temperature, serially diluted (heat Flow cytometry data acquisition and analysis
inactivated) sera were added and incubated for 2 h at room To control for batch effects, the BD FACS symphony
temperature. Plates were washed 4 times with 0.05% PBST lasers were calibrated with dye conjugated standards
and secondary antibodies added. Secondary antibodies were (Cytometer Set &Track beads) run every day. All sam-
diluted in 5% skim milk in PBST as follows: Goat anti- ples were acquired with all 28 PMTs recording events.
Human IgG (H + L) Secondary Antibody, HRP (1:30,000; All PMT voltages were adjusted to unstained negative
Invitrogen); Mouse Anti-Human IgG1 Fc-HRP (1:5000, control baseline typically log scale 102. Antibodies were
Southern Biotech), Mouse Anti-Human IgG3 Hinge-HRP titrated for optimal signal over background so that sin-
(1:5000; Southern Biotech); goat anti-human IgM HRP (1: gle positive stains sat within log scale 103–105 of desig-
5000; Sigma): anti-human IgA HRP antibody (1:5000; nated PMT. Compensation was set with beads matched
Sigma) and incubated for 1 hour at room temperature. to each panel antibody combination using spectral
Plates were developed with 1-Step™ Ultra TMB Substrate compensation using FlowJo Software V10. Exported
(Thermo Fisher) and stopped with 2 M sulphuric acid. OD FCS files had compensation values adjusted manually
readings were read at 450 nm on a Synergy HTX Multi- post-acquisition on a file-by-file basis in FCS express
Mode Microplate Reader. AUC calculation was performed v6. Once compensated, low data quality events were ex-
using Prism GraphPad, where the X-axis is half log10 of cluded based upon time acquired (at the sample acqui-
sera dilution against OD450 on Y-axis. sition start and before sample exhaustion), with further
time exclusion gates based on blockages or unexplained
PBMC isolation loss of events for a period of time during acquisition.
Post plasma centrifugation, the white blood cell pack Events that were highly positive for LIVE/DEAD stain-
was harvested, pooled into 1 × 50 ml falcon tube, diluted ing were removed from subsequent analysis, to prevent
in 2% FCS/PBS up to 35 ml and overlayed onto 15 ml exclusion of live monocytes, which take up more live/
Ficoll, centrifuged for 20 min, 1000×g, RT, no brake. The dead dye per cell than T cells, giving a high back-
PBMC were isolated, washed in 2% FCS/PBS, centri- ground. Events were gated for FCS-H/A as well as SSC-
fuged at 480×g for 10 min at RT, PBMC resuspended in H/A linearity, and restricted FSC-W and SSC-W values
50 ml 2% FCS/PBS, manually counted using trypan blue for doublet discrimination. Live single cells were then
exclusion assay. For deep immunophenotyping 2 × 10⁶ broadcast on SSC-A / FSC-A plot to determine size
cells were plated across 4 wells (5 × 10⁵ per well) of a and complexity. Lymphocyte, monocyte, and granulo-
96-well plate. The 50-ml tube was then spun at 300×g cyte gates were based on physical parameters (unless a
for 10 min, the pellet was resuspended in ½ volume of lineage-specific antibody was added). Populations of
FCS with ½ volume of 20% DMSO/80% FCS added cells were expressed as a proportion of the highest
dropwise to final cell concentration of 1 × 10⁷ per ml. order lineage gate (namely: lymphocytes, monocytes,
The samples were stored 800 μL–1.8 ml per vial placed and granulocytes). See Additional file 11 for representa-
in a CoolCell at − 80 °C. The frozen PBMC tubes were tive gating strategy. For parameters measured in healthy
transferred to liquid nitrogen for long-term storage controls and COVID-19 samples at 12 weeks, 16 weeks
within 1–7 days. and 24 weeks, a Wilcoxon rank sum test was used to as-
sess statistical significance with the Benjamini and
Flow cytometry staining Hochberg method employed to correct for multiple
The 96-well plate was centrifuged at 300×g for 4 min, comparisons. Statistical significance was determined as
the plate was inverted on paper towel, and the PBMC FDR < 0.05.
pellets were stained with 30 μL of 1 of 3 master-mixes of
antibodies (lineage, 15 color; memory, 8 color; T helper/ RNA extraction and library preparation
Treg, 14 color) for 20 min RT, in dark, which included a RNA extraction and genomic DNA elimination was car-
co-stain of BD LIVE/DEAD fixable dye (stained at 1: ried out using the PAXgene® Blood RNA kit (762164,Ryan et al. BMC Medicine (2022) 20:26 Page 5 of 23
Qiagen, Feldbachstrasse, Germany) as per the manufac- T cells, or CD8+ T cells), we additionally fit the fre-
turer’s instructions. Final elution was done into 80 μL quency of each population in each individual into the
RNase-free water. A further RNA precipitation reaction EdgeR model and reperformed the differential gene ex-
was carried out. Briefly, RNA was resuspended 2.5 × pression and pathway overrepresentation analysis. Gene
100% ethanol and 10% sodium acetate and spun at Set Enrichment Analysis (GSEA) was carried out using
12,000×g for 30 min at 4 °C. Samples were washed in the camera function in the EdgeR library with the Mo-
75% ethanol. Pellets were air dried and resuspended in lecular Signatures Database (MSigDB) R package
40 μL RNase-free water and total RNA yield was deter- (msigdbr v7.4.1). Blood transcriptional module (BTM)
mined by analysis of samples using a TapeStation (Agi- analysis was carried using a pre-defined set of modules
lent) and Qubit (Thermo Fisher Scientific, Australia). defined by Li et al. as an alternative to pathway-based
Total RNA was converted to strand-specific Illumina analyses [32]. Gene Set Variation Analysis (GSVA) [33]
compatible sequencing libraries using the Nugen Univer- was used to calculate a per sample activity score for each
sal Plus Total RNA-Seq library kit from Tecan (Manne- of the modules (excluding unannotated modules labelled
dorf, Switzerland) as per the manufacturer’s instructions as “TBA”). limma v3.46.0 was used to identify modules
(MO1523 v2) using 12 cycles of PCR amplification for that were differentially active. Pearson correlation ana-
the final libraries. An Anydeplete probe mix targeting lysis was performed using the Hmisc v4.4-2 package in R
both human ribosomal and adult globin transcripts to determine correlations between anti-Spike and anti-
(HBA1, HBA2, HBB, HBD) was used to deplete these RBD antibody titres, flow cytometry data, and BTM ac-
transcripts. Sequencing of the library pool (2 × 150 bp tivity scores. Correlation networks were exported to
paired-end reads) was performed using 2 lanes of an S4 Cytoscape v3.8.1 for visualisation.
flowcell on an Illumina Novaseq 6000.
Results
RNA-Seq analysis To assess the long-term effects of SARS-CoV-2 infection
Sequence read quality was assessed using FastQC ver- on the peripheral immune system, blood samples were
sion 0.11.4 [25] and summarised with MultiQC version collected from 69 recovering/convalescent COVID-19
1.8 [26] prior to quality control with Trimmomatic ver- individuals at 12, 16, and 24 weeks (± 14 days) post-
sion 0.38 [27] with a window size of 4 nucleotides and infection (wpi) (Fig. 1A). Blood samples were also col-
an average quality score of 25. Following this, reads lected from n = 14 seronegative healthy controls (HCs)
which were < 50 nucleotides after trimming were dis- with no history of prior SARS-CoV-2 infection. COVID-
carded. Reads that passed all quality control steps were 19 convalescent individuals were classified according to
then aligned to the Human genome (GRCh38 assembly) the NIH classification of disease severity [21] as mild (n
using HISAT2 version 2.1.0 [28]. The gene count matrix = 50), moderate (n = 6), severe (n = 7), or critical (n = 6)
was generated with FeatureCounts version 1.5.0-p2 [29] (Table S1). All participants were discharged from hos-
using the union model with Ensembl version 101 anno- pital prior to sample collection (58% of participants were
tation. The count matrix was then imported into R ver- hospitalised during acute COVID-19). Convalescents
sion 4.0.3 for further analysis and visualisation in with mild illness spent a median of 1.5 days hospitalised
ggplot2 v2.3.3. Counts were normalised using the (min = 0, max = 10), moderate illness 2 days (min = 1,
trimmed mean of M values (TMM) method in EdgeR max = 7), severe illness 12 days (min = 3, max = 16), and
version 3.32 and represented as counts per million critical illness 13 days (min = 8, max = 82). HCs were
(cpm) [30]. Prior to multidimensional scaling analysis age- and sex-matched with mild/moderate convalescent
and generation of heatmaps, svaseq v3.38 was applied to individuals; however, as expected based on previous re-
remove batch effects and other unwanted sources of ports, severe/critical convalescent individuals were older
variation in the data [31]. Differential gene expression and mostly male (Fig. 1B,C). The presence of post-acute
analysis was performed using the glmLRT function in sequelae of COVID-19 (PASC) was assessed retrospect-
EdgeR adjusting for sex and batch (run) in the model. ively through a symptom questionnaire (Additional file
Genes with < 3 cpm in at least 15 samples were excluded 10) which was completed by 83% (n = 57) of the conva-
from the differential expression analysis. Pathway and lescent individuals. Fatigue was the most commonly re-
Gene Ontology (GO) overrepresentation analysis was ported symptom (40.4%) followed by dyspnea (35.1%),
carried out in R using a hypergeometric test. To assess if worsened memory/concentration (35.1%), and decreased
differential gene expression was primarily driven by dif- muscle strength (33.3%) (Table 1). The prevalence and
ferences in the proportion of any major immune cell type of self-reported symptoms was consistent with long
population (i.e. LD granulocytes, LD neutrophils, COVID symptoms reported in other studies [34] and
CXCR3+ neutrophils, monocytes, lymphocytes, CD56++ aligned with which individuals were referred to a dedi-
NK cells, CD19+ B cells, CD3+ T cells, NKT cells, CD4+ cated long COVID clinic (n = 21, 30.4% of patients).Ryan et al. BMC Medicine (2022) 20:26 Page 6 of 23 Fig. 1 Anti-Spike and anti-RBD-specific antibodies at 12, 16, and 24 weeks post-infection (w.p.i.). A Blood sample collection timepoints. B Age and C sex distribution of healthy controls (HC) in comparison to mild/moderate and severe/critical COVID-19 convalescents. D Anti-Spike and E anti- RBD-specific IgG, IgG1, IgG3, IgM, and IgA titres at 12, 16, and 24 w.p.i. End point titres are reported as area under the curve (AUC). The mean is denoted by the horizontal black lines. Seronegative samples were assigned a value of 0.1. Red dashed lines represent the mean AUC + 2 SD in HC for each isotype. F–K Antibody titres subdivided by disease severity. L–M Pearson correlations between anti-Spike and anti-RBD antibody subclass titres at each timepoint. Statistical significance was assessed in B,F–K using Wilcoxon rank sum tests. ns = non-significant. * P < 0.05, ** P < 0.01, *** P < 0.001 Referral to a long COVID clinic was not significantly as- uniquely placed for the assessment of immune responses sociated with subject age (Wilcox rank sum test, P = in COVID-19 convalescents due a negligible risk of re- 0.1), sex (Fisher’s exact test, P = 0.9), or COVID-19 se- infection or changes to the immune system induced by verity (Fisher’s exact test, P = 0.09). All samples in this vaccination. study were collected in South Australia where early and strict international and interstate border control mea- COVID-19 convalescents have robust anti-Spike and anti- sures eliminated community transmission of the virus RBD antibody responses for at least 6 months post- during the sample collection period [35]. None of the infection participants had received a COVID-19 vaccine at the Anti-SARS-CoV-2 Spike and receptor-binding domain time of sample collection. This cohort was therefore (RBD) total IgG, IgG1, IgG3, IgM, and IgA responses
Ryan et al. BMC Medicine   (2022) 20:26                                                                              Page 7 of 23

Table 1. The proportion of patients self-reporting long COVID-associated symptoms
                                                                            Number of Subjects                Percent of subjects
General                       Referred to long COVID clinic                 21                                30.4
                              Any reported symptoms?                        33                                57.9
Non-specific                  Fatigue                                       23                                40.4
                              Dyspnoea                                      20                                35.1
                              Decreased muscle strength                     19                                33.3
                              Worsened sleep quality                        16                                28.1
                              Palpitations                                  4                                 7.0
                              Dizziness                                     4                                 7.0
                              Hair loss                                     6                                 10.5
Neuropsychiatric              Anxiety/depression                            14                                24.6
                              Worsened memory/concentration                 20                                35.1
Pain                          Headache                                      10                                17.5
                              Chest pain                                    7                                 12.3
                              Joint pain                                    6                                 10.5
                              Myalgia                                       6                                 10.5
Oral/pharyngeal               Worsened sense of smell/taste                 11                                19.3
                              Difficulty swallowing /sore throat            5                                 8.8
Gastrointestinal              Diarrhoea                                     4                                 7.0
                              Nausea                                        3                                 5.3
                              Vomiting                                      1                                 1.8

were evaluated in convalescent individuals at 12, 16, and          significantly correlated at all timepoints (Fig. 1L–N).
24 wpi (Fig. 1D,E, Table S1). The titres of Spike-specific         Anti-Spike and anti-RBD total IgG1 and IgG3 levels
IgG were diverse but largely stable over time (Fig. S1A-           were significantly correlated at 24 wpi only. In summary,
C), although there was a trend for anti-Spike IgG1 titres          anti-Spike and anti-RBD antibody titres were generally
to decline over time (Fig. S1B). The seropositivity of             positively correlated with COVID-19 disease severity, in
Spike-specific serum IgM and IgA gradually diminished              accordance with previous observations [36–38].
over time (Fig. S1D-E). Overall, the kinetics for anti-
RBD antibodies were similar to those observed for anti-            Deep immunophenotyping reveals persistent alterations
Spike antibodies (Fig. S1F-J), though anti-RBD IgG3 and            in immune cell populations in COVID-19 convalescents up
IgM appeared to decline more rapidly than anti-Spike               to 24 weeks post-infection
antibodies. We also compared the levels of anti-Spike              We used a multi-parameter flow cytometry approach to
and anti-RBD circulating antibodies between individuals            identify and enumerate ~ 130 different immune cell sub-
recovering from mild/moderate versus severe/critical               populations in PBMC collected from COVID-19 convales-
COVID-19. Anti-Spike total IgG and IgG3 levels at 12,              cent individuals at 12, 16, and 24 wpi and from HCs (Table
16, and 24 wpi were significantly higher in severe/critical        S2; Additional file 11). Flow cytometry was performed on
convalescents compared to those with previous mild/                PBMC rather than whole blood to enrich for rarer immune
moderate disease (Fig. 1F–H). Anti-Spike IgG1 and IgA              cell populations and to facilitate comparison with the ma-
levels were significantly higher in severe/critical conva-         jority of other studies assessing immune phenotypes in
lescents at 24 wpi only (Fig. 1H). There was no detect-            COVID-19 patients or convalescents. Our analysis included
able difference in RBD-specific antibody responses                 deep immunophenotyping of the CD4 and CD8 compart-
between individuals recovering from mild/moderate or               ments, interrogating their maturation status, and in the
severe/critical disease at 12 or 16 wpi (Fig. 1I,J). At 24         CD4 compartment, interrogation of T helper (Th) lineage
wpi, severe/critical convalescent individuals maintained           subsets, T regulatory (Treg) subsets, and T follicular helper
significantly higher anti-RBD IgG, IgG3, and IgM levels            (Tfh) subsets using a combination of chemokine receptor
compared to individuals with previous mild/moderate                expression patterns to resolve Th-lineages (Th1, 2, 17, 1/7,
COVID-19 disease (Fig. 1K). Anti-Spike and anti-RBD                9, 22, 2/22). Immune cell populations were first categorised
total IgG levels (but not other antibody subclasses) were          into 10 major lineages (Fig. 2A). Each cell type was further
Ryan et al. BMC Medicine (2022) 20:26 Page 8 of 23 Fig. 2 Flow cytometry analysis of major immune cell populations in peripheral blood mononuclear cells (PMBCs) collected from COVID-19 convalescents at 12, 16, and 24 weeks post-infection (w.p.i.) and from healthy controls (HC). A Heatmap representing the frequency of immune cell populations in HC and in convalescents. Brighter red color represents higher frequency. B–D Volcano plots of immune cell populations at each timepoint. Horizontal line represents FDR = 0.05. Populations shown in red or blue were significantly (FDR < 0.05) increased or decreased (fold change > 1.5-fold), respectively, in convalescents. E–M The proportion of selected immune cell populations at 12, 16, and 24 w.p.i. compared to HC. Statistical significance was assessed using Wilcoxon rank sum tests. P values were adjusted for multiple testing using the Benjamini-Hochberg method. ns = non-significant. * FDR < 0.05, ** FDR < 0.01, *** FDR < 0.001 segregated based on functional marker characteristics in- observed significantly increased CD38+CD27+ memory B cluding activation or maturation status. Differences in these cells at 16 wpi (Fig. 2A). When interrogating CD4+ T cell major lineages, compared with HCs, were most strongly maturation, we observed a significant reduction in both the evident at 12 wpi, but some populations were still signifi- CD4+ and CD8+ compartments at 12 and 16 wpi (Fig. cantly different at 24 wpi (Fig. 2A–D, Table S2). While 2B,C). CD4+ effector memory (EM) pools were significantly there was significant lymphopenia evident in convalescent reduced (Fig. 2H), and we also observed a significant reduc- individuals at 12 and 16 wpi (Fig. 2E), CD3+ T cells were tion in migratory central memory (CM) CD4+ T cells, de- significantly increased at 12 wpi, when expressed either as a fined as CCR7+CD62L−, at all timepoints (Fig. 2I). percentage of lymphocytes (Fig. 2F) or as a percentage of The NK cell compartment was also altered in conva- live cells (data not shown). CD19+ B cells were also signifi- lescents at 12 and 16 wpi (Fig. 2A–C) with CD56++ NK cantly increased at 12 and 16 wpi (Fig. 2G). We also cells, for example, significantly elevated at 12 and 16 wpi
Ryan et al. BMC Medicine   (2022) 20:26                                                                         Page 9 of 23

(Fig. 2J). We also observed a significant increase in total    convalescents (Fig. 3B–D, Table S2). We observed a sig-
granulocytes at all 3 timepoints post-infection (Fig. 2A–      nificant decrease in Th9 cells at all timepoints (Fig. 3E).
D), and for low-density (LD) neutrophils at 12 and 16          Th9 cells are implicated in autoimmune pathologies in-
wpi (Fig. 2K). CXCR3+ LD neutrophils, which are ac-            cluding airway damage and are predicted to home to
tively recruited to sites of tissue damage [39], were ele-     sites of inflammation including the lung. It is plausible
vated in convalescents at 12 wpi but returned to baseline      that decreased proportion in the PBMC reflect homing
by 16 wpi (Fig. 2A). Interestingly, CD14+CD16+ neutro-         to the lung, or transdifferentiating into pathologic Th17
phils were significantly decreased at 12 and 16 wpi (Fig.      cells [43]. There was also a significant increase in Th2/
2A). While total monocyte proportions were not signifi-        22 cells at 16 wpi (Fig. 3A). We observed that while the
cantly altered, two subsets of tissue-homing CXCR3+            proportion of Th17 and Th22 cells was not significantly
monocytes (HLA-DR+, activated antigen-presenting pro-          different between groups, there was an increased propor-
inflammatory monocytes and HLA-DR−, regulatory                 tion of Th17 and Th22 CM cells at all timepoints (Fig.
monocytes) were significantly increased in convalescent        3F,G). This may indicate a role for these subsets in re-
individuals at 12 wpi (Fig. 2L–M). We also investigated        covery after viral infection. In addition, there was evi-
differences in immune cell populations between mild/           dence of increased formation of Th2/22 memory at 12
moderate and severe/critical convalescents; however,           wpi (Fig. 3H), suggesting establishment of memory fo-
after correction for multiple testing, there were no statis-   cused on tissue repair [44]. In the Tfh compartment, we
tically significant differences (Table S2), most likely due    observed significant differences in Tfh1, 9, 22, and 2/22
to the small sample size of severe/critical convalescent       cells at different timepoints post-infection (Fig. 3A), with
samples, particularly at 12 wpi.                               Tfh1 cells significantly elevated in convalescents at 12
   Next, we assessed correlations between immune cell          and 16 wpi (Fig. 3A).
populations (at 12, 16, or 24 wpi) and both anti-Spike            As with CD8+ and CD4+ effector T cells, Tregs segre-
and anti-RBD IgG, IgM, and IgA responses at 24 wpi             gate into naïve and mature populations depending on
(Table S3). Significant positive correlations were ob-         antigen exposure. While we found no difference in total
served between the frequency of granulocytes, CD16+            Tregs (Table S2), we observed a significant increase in
NK, and NKT-like cells at 12 wpi and anti-Spike IgG1           naïve Tregs at all timepoints post-infection (Fig. 3I), ac-
and anti-RBD IgG titres at 24 wpi. These data may be           companied by a significant decrease in CM and EM
reflective of the correlation between disease severity and     Tregs at 12 and 16 wpi, and a significant increase in
antibody responses. Previous work has suggested an as-         TEMRA Tregs (effector memory with acquired
sociation between increased percentage of neutrophils          CD45RA) at 12 and 16 wpi (Fig. 3J–L). These data sug-
and lower anti-RBD IgG responses [40], which we did            gest either a block in maturation, or an increase in for-
not detect in our analysis (Table S3). Components of the       mation of naïve Treg cells in convalescents. The dual
CD4 compartment were also significantly associated             role of Treg cells in immune suppression and tissue re-
with anti-Spike IgG1 and anti-RBD IgG titres at 24 wpi.        pair suggests the potential for more than one mechan-
For example, there was a positive correlation between          ism of action in recovering individuals, so we examined
the proportion of CD4+ cells in transition from naïve to       functionally paired helper lineages in the Treg compart-
CM, CM, to EM, and activated (HLA-DR+ or CD38+)                ment, as they are likely to respond to the same
CD4+ T cells, and anti-Spike and anti-RBD IgG/G1 titres        pathogen-triggered homing cues as their Th effector
at 24 wpi, suggesting each of these CD4 populations            counterparts. We observed a significant decrease in the
might contribute to robust T cell help. Significant corre-     proportion of ThR2 Tregs at 12 and 16 wpi, and a sig-
lations between immune cell populations at 16 and 24           nificant decrease in ThR22 and ThR2/22 Tregs at all
wpi and anti-Spike or anti-RBD antibody responses were         timepoints (Fig. 3M–O), suggesting a block in commit-
also observed (Table S3).                                      ment of these lineages. Finally, we also examined the fol-
   To interrogate CD4 Th responses in more depth, we           licular regulatory T cell lineages (TfhR), as they serve a
applied a chemokine receptor-based gating strategy to          similar regulatory role in germinal centres, controlling
characterise the Th effector phenotypes in both Th and         Tfh function and B cell help. We observed a significant
Tfh subsets [41, 42]. We also used CD45RO+ and                 decrease in total TfhR at 12 and 16 wpi (Fig. 3P) sug-
CD62L+ staining as a marker of T cell memory forma-            gesting that follicular help is less restrained by TfhR in
tion in the Th subsets. In addition, we applied the same       individuals recovering from COVID-19. Specifically,
strategy to T regulatory (Treg) subsets, which are func-       TfhR2, 22, and 2/22 subsets were all significantly re-
tionally paired with their Th and Tfh counterparts             duced at 12 and 16 wpi but returned to baseline by 24
in vivo [41]. Th and Tfh lineages were categorised into 8      wpi. This is consistent with the regulatory follicular arm
functional subsets (Fig. 3A), and significant differences      licencing a Tfhl response early in infection, but later,
were observed for multiple subsets in COVID-19                 skewing to Tfh2/22-driven B cell help in germinal
Ryan et al. BMC Medicine       (2022) 20:26                                                                                             Page 10 of 23

 Fig. 3 Flow cytometry analysis of T helper (Th), T follicular helper (Tfh), and T regulatory cell (Treg) populations in peripheral blood mononuclear
 cells (PMBCs) collected from COVID-19 convalescents at 12, 16, and 24 weeks post-infection (w.p.i.) and from healthy controls (HC). A Heatmap
 representing the frequency of immune cell populations in HC and in convalescents. Brighter red color represents higher frequency. B–D Volcano
 plots of immune cell populations at each timepoint. Populations shown in red or blue were significantly (FDR < 0.05) increased or decreased (fold
 change > 1.5-fold), respectively, in convalescents. E–P The proportion of selected immune cell populations at 12, 16, and 24 w.p.i. compared to
 HCs. Statistical significance was assessed using Wilcoxon rank sum Tests. P values were adjusted for multiple testing using the Benjamini-
 Hochberg method. ns = non-significant. * FDR < 0.05, ** FDR < 0.01, *** FDR < 0.001

centres, both of which are required to drive an effective                    correlations between these subsets and anti-RBD IgG re-
B cell response.                                                             sponses were also evident.
  We also sought to determine links between T cell help
and antibody responses to COVID-19, given that prim-                         Whole blood RNA sequencing reveals significant
ing and durable immunity are underpinned by the inter-                       perturbations to gene expression in COVID-19
action of T and B cells. To do this, we performed a                          convalescents until at least 6 months post-infection
correlation analysis between CD4+ T cell subsets at 12,                      To assess the potential long-term effects of SARS-CoV-2
16, and 24 wpi and antibody responses at 24 wpi (Table                       infection on the peripheral blood transcriptome, total
S3). We observed a number of interesting statistically                       RNA sequencing was performed on 138 blood samples
significant correlations. For example, we observed a sig-                    collected from individuals recovering from mild (n =
nificant positive correlation between anti-Spike IgG1                        47), moderate (n = 6), severe (n = 7), or critical (n = 6)
levels and both ThR2/22 and TfhR2/22 subsets, suggest-                       COVID-19 at 12, 16, and 24 wpi (Fig. 1A). RNA sequen-
ing that the effector function of this epithelial tissue-                    cing was also performed on blood collected from age-
homing lineage may regulate antibody responses. Similar                      matched HCs (n = 14) with negative serology for the
Ryan et al. BMC Medicine   (2022) 20:26                                                                        Page 11 of 23

SARS-CoV-2 Spike and RBD proteins. Approximately 9                 Among downregulated genes at 12 and 16 wpi, there
billion 2 × 150 bp read pairs (mean 68.2 million per            was a strong enrichment for metabolic related pathways
sample) were sequenced (Table S4).                              such as oxidative phosphorylation as well as pathways
   After adjusting for sex and batch effects, MDS analysis      related to platelet activation, signaling, and aggregation
of the gene expression data revealed a clear separation         (Fig. 4G, Table S4). Platelet aggregation has previously
between HCs and convalescent individuals at each time-          been identified as a marker of severe SARS-CoV-2 infec-
point (Fig. 4A–C). Consistent with these data, differen-        tion [50], so it is interesting that genes involved in this
tial gene expression analysis identified > 950 genes that       process appear to be downregulated in recovering indi-
were significantly (FDR < 0.05, fold change > 1.25) differ-     viduals (Fig. S2A, Table S4). Interestingly, we identified
entially expressed (738 upregulated genes; 230 downreg-         oxidative phosphorylation to be enriched among upregu-
ulated) in convalescent individuals at 12 wpi compared          lated genes as well as downregulated genes. Increased
to HCs (Fig. 4D, Table S4). Similar results were observed       expression of genes involved in oxidative phosphoryl-
when only mild/moderate convalescents were included             ation has recently been reported in another study asses-
in the analysis, indicating that differential gene expres-      sing COVID-19 convalescents [20]. Further examination
sion was not driven solely by convalescents recovering          of our data revealed that downregulated oxidative phos-
from severe disease. Fewer differentially expressed genes       phorylation genes were encoded by the mitochondria,
(DEGs) were identified at 16 and 24 wpi, but there were         whereas upregulated ones were nuclear encoded (Fig.
still > 250 DEGs identified at 24 wpi (Fig. 4D, Table S4).      S2B). Differential expression of nuclear versus mito-
Unsupervised hierarchical clustering analysis of DEGs           chondrially encoded oxidative phosphorylation genes has
did not reveal an obvious clustering by disease severity,       been reported in a number of other contexts [51]. Inter-
suggesting that even individuals with mild COVID-19             estingly, given the memory and concentration issues fre-
have long-lasting changes to their blood transcriptome          quently reported by long COVID patients, including in
(Fig. 4E). There was a tendency for samples from the            our study (Table 1), mitochondrial dysfunction in PBMC
earlier timepoints to cluster together, consistent with a       has previously been associated with cognitive impair-
decrease in the number of DEGs over time, but clearly           ment in other contexts [52]. As mentioned, at 24 wpi
there was a spectrum in the recovery in gene expression         there were considerably fewer DEGs (~ 250) in convales-
among convalescent individuals, with some recovering            cents compared to HCs; consistent with this, only one
more quickly (clustering with HCs).                             pathway, “complement activation”, was identified as be-
   Pathway and Gene Ontology (GO) analysis revealed a           ing enriched among genes downregulated at 24 wpi
very strong enrichment for pathways related to transcrip-       (Table S4).
tion, translation, and ribosome biosynthesis among genes           Many of the most strongly upregulated genes in
upregulated in convalescents, at all 3 timepoints (Fig. 4E,F,   COVID-19 convalescents encoded known biomarkers of
Table S4). In many cases, these signatures were predomin-       inflammation and innate immunity including S100
antly driven by the upregulation of ribosomal RNA               calcium-binding protein A8 (S100A8), and high-mobility
(rRNA) genes. Viral polypeptide synthesis is reliant upon       group protein 1 (HMGB1), 5-azacytidine induced 2
host ribosomes and many viruses have been reported to           (AZI2), and granzyme A (GZMA) (Fig. 4H–K). C-
stimulate rRNA synthesis upon infection [45, 46], al-           reactive protein (CRP) levels in serum were not, how-
though both the SARS-CoV-1 and SARS-CoV-2 Nsp1                  ever, significantly different in convalescents compared to
protein has been shown to act a strong inhibitor of trans-      healthy controls (Fig. S2C). As we performed total RNA
lation [47, 48]. Interestingly, a recent study has surpris-     sequencing, we were also able to identify many differen-
ingly shown that rRNA accumulation positively regulates         tially expressed long non-coding RNAs (Table S4) in-
antiviral innate immune responses against human cyto-           cluding metastasis-associated lung adenocarcinoma
megalovirus infection [49], raising the possibility that the    transcript 1 (MALAT1) (Fig. 4L), which has been found
continued upregulation of rRNAs in individuals recover-         upregulated in response to flavivirus and SARS-CoV-2
ing from COVID-19 is a cellular defence mechanism.              infection [53, 54] and is an important regulator of im-
Consistent with this, the Reactome pathway “innate im-          munity and the cell cycle [55, 56].
mune system” was significantly enriched among genes up-            As detailed above, flow cytometry analysis revealed
regulated in convalescents (Fig. 4E,F, Table S4). Other         significant changes in the proportion of multiple im-
statistically enriched pathways among upregulated genes         mune cell populations in convalescent individuals com-
included neutrophil degranulation, antimicrobial peptides,      pared with HCs (Figs. 2 and 3). As we performed RNA-
immune system, pathways related to other viral infections,      Seq on whole blood samples, it was therefore possible
cell cycle related pathways, and pathways related to the        that the differences we observed in the transcriptome of
citric acid (TCA) cycle and respiratory electron transport/     recovering individuals simply reflected changes in im-
oxidative phosphorylation (Table S4).                           mune cell populations, rather than differences in gene
Ryan et al. BMC Medicine      (2022) 20:26                                                                                           Page 12 of 23

 Fig. 4 RNA-Seq was used to profile gene expression in peripheral whole blood samples collected from COVID-19 convalescents at 12, 16, and 24
 weeks post-infection (w.p.i.) and from healthy controls (HC). A–C Multidimensional scaling (MDS) analysis of RNA-Seq gene expression data at 12,
 16, and 24 w.p.i. compared to HC. D The number of differentially expressed (DE) genes (FDR < 0.05 and fold change > 1.25-fold) identified at each
 timepoint. E Heatmap showing the expression of DE genes in each sample. Data were adjusted for sex and batch effects prior to MDS analysis
 and visualisation of the heatmap. F–G Selected REACTOME pathways enriched among F upregulated and G downregulated genes at each
 timepoint. See Table S4 for all enriched pathways. H–L The expression of selected genes in convalescents at 12, 16, and 24 w.p.i. compared to
 HC. Statistical significance comparing all convalescents to HC was assessed in (H–L) using EdgeR. P values were adjusted for multiple testing
 using the Benjamini-Hochberg method. ns = non-significant. * FDR < 0.05, ** FDR < 0.01, *** FDR < 0.001
Ryan et al. BMC Medicine (2022) 20:26 Page 13 of 23
expression. To assess this, we repeated the differential long COVID convalescents. Furthermore, there was a
expression analysis multiple times, each time adjusting very strong enrichment for platelet-related pathways
for changes in a major immune cell population. We among downregulated genes (Fig. 5D,E, Table S5). Given
found that accounting for changes in specific immune none of the cell types we measured were found to be sig-
cell populations in our differential gene expression ana- nificantly different in long COVID convalescents in our
lysis models resulted in a decrease in the number of flow cytometry data, we used the Molecular Signatures
genes identified as differentially expressed (mean reduc- Database (MSigDB) cell type collection to attempt to
tion in the number of genes with FDR < 0.05 was identify which cell type(s) drove the observed transcrip-
50.47%); however, the statistical enrichment of immune, tional differences. Consistent with our pathway analyses,
rRNA processing, cell cycle, and transcription/transla- we identified a strong downregulation of platelet and
tion signatures identified among DEGs was robust to megakaryocyte gene sets among individuals referred to a
correction for differences in the proportion of any spe- long COVID clinic (Fig. 5F, Table S5). Plotting the ex-
cific immune cell populations (Fig. S3, Table S4). These pression of well-known platelet genes encoding, for ex-
data indicate that the long-term perturbation of the ample, platelet factor 4 (PF4), platelet glycoprotein IX
blood transcriptome that we observe in convalescents (GP9), thrombopoietin receptor (MPL), and coagulation
compared to HCs is not solely explained by changes in factor XIII A chain (F13A1) (Fig. 5G–J), confirmed the
the frequency of any single immune cell population. downregulation of platelet genes in long COVID pa-
tients. There are a growing number of case reports of
Persistent changes in the transcriptome are associated thrombocytopenia in COVID-19 patients [57–59] and
with post-acute COVID-19 syndrome. interestingly, given that fatigue is one of the most com-
To assess whether differences observed in convalescent monly reported side-effects of long COVID, a common
patients were associated with long COVID symptoms, symptom of thrombocytopenia is also fatigue. There are
we compared cellular immunophenotypes and transcrip- also numerous case reports of thrombocytopenia after
tional responses in convalescent individuals (n = 21) re- infection with a range of pathogens, including severe
ferred to a “long COVID” clinic compared to those acute respiratory syndrome coronavirus 1 (SARS-CoV-
convalescent individuals who were not (n = 48). Referral 1), influenza, and Zika virus [60–62].
to the clinic was closely aligned with self-reported on- Aside from platelet-related signatures, monocyte- and
going symptoms (Fig. 5A) and was not significantly asso- myeloid-related cells were also significantly enriched
ciated with disease severity (Fischer’s exact test, P value among downregulated genes, whereas CD4+ T cells were
= 0.1). Analysis of anti-Spike and anti-RBD antibody ti- enriched among upregulated genes (Fig. 5F). Interest-
tres found no significant differences between individuals ingly, given the important role of type I interferon (IFN-
referred to the clinic and those who were not, indicating I) in COVID-19 [18], we also found decreased expres-
that humoral responses are similar in both groups of sion of multiple IFN-I-inducible genes including MX1,
convalescent individuals. Similarly, none of the immune OAS3, and OASL (Fig. 5K–M). Of further interest given
cell subsets we found to be persistently changed in con- the neurological symptoms associated with long COVID
valescents compared to healthy controls were signifi- including those reported in our cohort (Table 1), we
cantly altered in individuals referred to the long COVID found that the expression of S100B, a biomarker of
clinic compared to those who were not. Interestingly, neurological damage, was significantly increased in pa-
however, there were 446 genes that were significantly tients referred to a long COVID clinic [63].
differentially expressed at 24 wpi in convalescent indi-
viduals referred to the long COVID clinic compared to Blood transcriptional module analysis highlights variable
those who were not (FDR < 0.05 and > 1.25× fold change rates of recovery in the transcriptome of COVID-19
(Fig. 5B,C, Table S5). No differentially expressed genes convalescents and correlations with antibody responses
were identified between convalescent individuals re- We next sought to investigate individual-specific tran-
ferred to the long COVID clinic and those who were not scriptional changes in COVID-19 convalescents using
at 12 or 16 wpi (although all convalescent had substan- pre-defined blood transcriptional modules (BTMs) [32].
tial changes in gene expression compared to HCs at To do this, we used Gene Set Variation Analysis (GSVA)
these timepoints). These data suggest that changes to [33] to reduce variation captured across > 20,000 genes
the blood transcriptome persist in individuals referred to in our gene expression data to an “activity score” for 256
a long COVID clinic, whereas they tend to resolve in BTMs in each individual (Fig. 6A and Table S6). Using
convalescent individuals not suffering from long COVID limma, we identified 80 of these BTMs that were differ-
symptoms. entially active in convalescents (Table S6). The annota-
Genes involved in transcription and translation and tion of these BTMs was broadly consistent with our
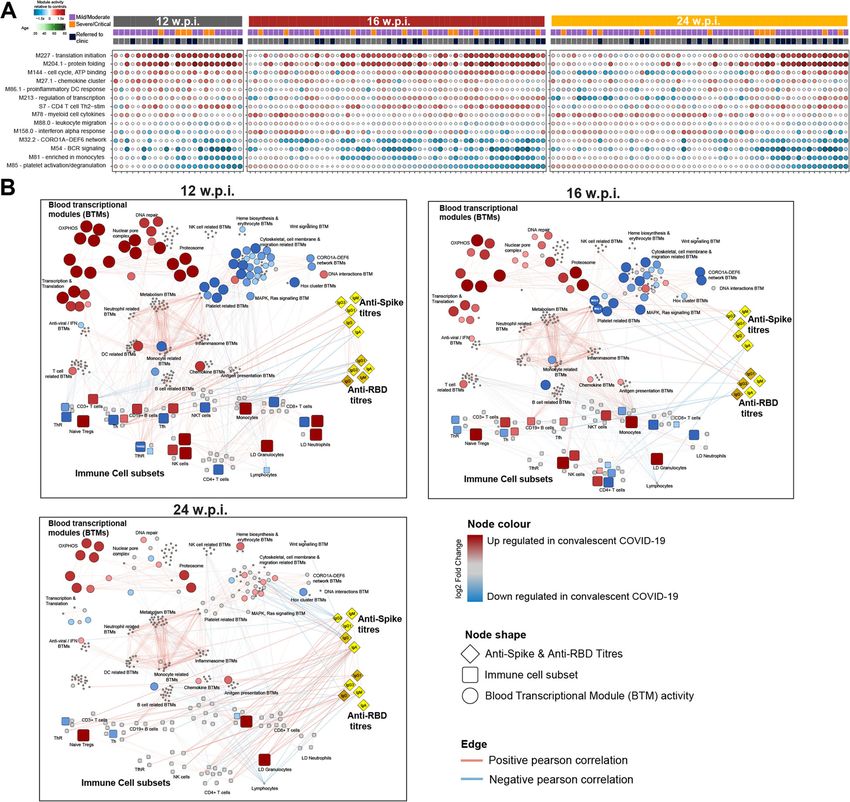
the cell cycle were enriched among genes upregulated in pathway analysis identifying multiple modules related toRyan et al. BMC Medicine (2022) 20:26 Page 14 of 23 Fig. 5 RNA-Seq was used compare gene expression in peripheral whole blood samples collected from COVID-19 convalescents who were clinically referred to a long COVID clinic and those who were not. A Self-reported long COVID symptoms in convalescent individuals. B Volcano plot showing genes that were differentially expressed (DE) at 24 wpi in convalescents referred to a long COVID clinic. Horizontal line corresponds to FDR = 0.05. Positive log2 fold change values correspond to genes with increased expression in those referred to a long COVID clinic relative to convalescent patients who were not referred. C Heatmap showing the expression of DE genes in each sample at 24 wpi. D Selected REACTOME pathways enriched among up- and downregulated genes by long COVID clinic referral status. See Table S5 for all enriched pathways. E Heatmap showing the expression of DE genes in the REACTOME “platelet activation, signaling and degranulation” pathway. F Barplot showing the enrichment of gene sets from the MSigDB cell type collection. G–N The expression of selected genes at 24 wpi in convalescents referred to a long COVID clinic and those who were not referred. Statistical significance in G–N was assessed using EdgeR. * FDR < 0.05 transcription/translation, the cell cycle and specific im- “healthy-like” BTM activity increased over time (consist- mune cell populations, and pathways as being signifi- ent with a recovery to baseline over time), there were cantly enriched in convalescents (Fig. 6A, Table S6). still a subset of convalescents with persistent transcrip- Interestingly, this analysis highlighted that while the pro- tional dysregulation at 24 wpi, which was associated with portion of recovering COVID-19 convalescents with referral to a long COVID clinic (red and blue modules
Ryan et al. BMC Medicine       (2022) 20:26                                                                                              Page 15 of 23

 Fig. 6 Integrated network analysis of correlations between blood transcriptional modules (BTMs), the frequency of immune cell populations
 assessed by flow cytometry and anti-Spike and anti-RBD antibody titres. A Selected BTMs identified to be differentially active in COVID-19
 convalescents. Each circle represents the activity of that BTM in a specific convalescent individual. Darker red indicates increased BTM activity
 relative to healthy control (HC); darker blue decreased. The size of the circle is proportionate to BTM activity relative to HC. Samples are ordered
 on the X-axis by BTM M85 (Platelet activation) activity score. B Network showing Pearson correlations (as edges) between BTMs, immune cell
 populations, and serology data. Red and blue edges indicate positive and negative correlations, respectively. BTM-BTM correlations were
 determined across all timepoints. Only those with r2 > 0.7 and FDR < 0.05 are shown. Correlations between BTMs, immune cell populations, and
 antibody titres were determined at each timepoint. Only those with FDR < 0.05 at a specific timepoint are shown. Node sizes and colours are
 scaled relative to HC. Red and blue nodes indicate increased and decreased values, respectively, relative to HC. Grey nodes were not significantly
 altered in convalescents. The network was visualised using Cytoscape v3.8.1

in Fig. 6A). Consistent with this, we identified 48 BTMs                     data, and flow cytometry data at 12, 16, and 24 wpi (Fig.
at 24 wpi that were differentially active by long COVID                      6B, Table S6, Additional files 12, 13 and 14). To do this,
clinic referral status including multiple platelet, cell                     we constructed a network of significant correlations be-
cycle, and immune-related BTMs (Table S6).                                   tween BTMs, antibody titres, and the frequency of im-
  Finally, we undertook a systems-level integration of                       mune cell populations in each individual. Many BTMs,
BTM activity scores, anti-Spike and anti-RBD antibody                        including those differentially active in convalescents,
You can also read