Minimizing the impact of vacating instream storage of a multi-reservoir system: a trade-off study of water supply and empty flushing - HESS

Page created by Christian Myers
 
CONTINUE READING
Minimizing the impact of vacating instream storage of a multi-reservoir system: a trade-off study of water supply and empty flushing - HESS
Hydrol. Earth Syst. Sci., 25, 2063–2087, 2021
https://doi.org/10.5194/hess-25-2063-2021
© Author(s) 2021. This work is distributed under
the Creative Commons Attribution 4.0 License.

Minimizing the impact of vacating instream storage of a
multi-reservoir system: a trade-off study of water
supply and empty flushing
Chia-Wen Wu1 , Frederick N.-F. Chou1 , and Fong-Zuo Lee2
1 Department   of Hydraulic and Ocean Engineering, National Cheng-Kung University, 1 University Rd., Tainan, Taiwan
2 Hydrotech   Research Institute, National Taiwan University, Taipei, Taiwan

Correspondence: Frederick N.-F. Chou (chounf@gmail.com)

Received: 27 May 2020 – Discussion started: 22 June 2020
Revised: 18 January 2021 – Accepted: 1 March 2021 – Published: 19 April 2021

Abstract. A reservoir operator does not favor storage above      1   Introduction
a certain level in situations such as the pre-release oper-
ation prior to a flood; scheduled engineering construction;      Reservoirs intercept watercourses to store excessive water
or mechanical excavation of sediment in the impoundments,        and regulate natural flow patterns into expected releases for
drawdown, and empty flushing, etc. This paper selects empty      different purposes. Besides conserving water, there are also
flushing as the case study, and a method is presented to pro-    circumstances in which storage above certain levels in reser-
mote the feasibility of emptying the reservoir storage. The      voirs is not favored. These situations include when an im-
impact of emptying reservoir on water supply is minimized        minent flood is anticipated, when engineering construction
through appropriate joint operation in a multi-reservoir sys-    or mechanical excavation of sediments within the impound-
tem, where drawdown and empty flushing is carried out in         ments is scheduled, and during empty flushing operations.
a primary reservoir, and the other reservoir provides backup     While the last of which are focused on in this paper, the con-
water for supply. This method prioritizes allocating the stor-   cept of minimizing the impact of vacating storage from reser-
age in the primary reservoir for water supply during specific    voirs on the original purposes of water usage through careful
periods prior to its emptying. If the storage of every reser-    management is general to all situations.
voir achieves its predefined conditions, drawdown of the pri-       Empty flushing is the most effective method for removing
mary reservoir is activated and followed by empty flushing.      deposited sediments from reservoirs (Fan and Morris, 1992;
Previously preserved storage in the other reservoir ensures      Morris and Fan, 1998; Shen, 1999). This process requires
adequate water supply during the periods of emptying the         complete drawdown of reservoir storage to allow for “in-
primary reservoir. Flushing of the primary reservoir is con-     flows to pass through at riverine depths” (Atkinson, 1996).
tinued until either the accumulative released water exceeds      The drawdown of storage is usually carried out by releasing
the specified volume, storage in the backup reservoir drops      water through bottom outlets. During this process, the accel-
below the predefined threshold, or the inflow to the primary     erated flow near the inlet may partially reactivate and scour
reservoir recedes from the flood peak to be below the releas-    out the depositions to generate a flushing cone in the vicin-
ing capacity of outlets. This behavior is simulated and linked   ity of the inlet. By completely emptying the reservoir and
with a nonlinear optimization algorithm to calibrate the op-     maintaining the riverine flow condition, retrogressive erosion
timal parameters defining the activation and termination of      may be induced from the rim of the flushing cone extending
empty flushing. The optimized strategy limits the incremen-      upstream to create a flushing channel. The formation of the
tal water shortage within the acceptable threshold and maxi-     flushing channel usually leads to hyper sediment concentra-
mizes the expected benefits of emptying reservoir.               tion of the bottom release and thus effectively recovers par-
                                                                 tial deposited capacity of the reservoir. This operation has
                                                                 been used to pursue sustainable utilization by many reser-

Published by Copernicus Publications on behalf of the European Geosciences Union.
Minimizing the impact of vacating instream storage of a multi-reservoir system: a trade-off study of water supply and empty flushing - HESS
2064                     C.-W. Wu et al.: Minimizing the impact of vacating instream storage of a multi-reservoir system

voirs worldwide (Atkinson, 1996; White, 2001; Chaudhry
and Habib-ur-rehman, 2012), and some examples of which
are presented in Table A1.
   Because draining the storage of a reservoir contradicts its
water supply function, empty flushing is generally limited
to reservoirs that operate solely for hydropower generation,
flood mitigation, or irrigation. These purposes usually do not
require reservoir storage during certain periods of the year,
during which empty flushing can be implemented without
impairing the original design function of the reservoir. How-
ever, for reservoirs with municipal or industrial end-users
that rely on sufficient storage for steady water supply, the
implementation of empty flushing is relatively rare.
   The conflict between water supply and empty flushing
has been addressed by Chang et al. (2003) and Khan and
Tingsanchali (2009). However, these previous studies only
dealt with a single reservoir. If there are additional reservoirs
in the system that can act as backup water sources, it may
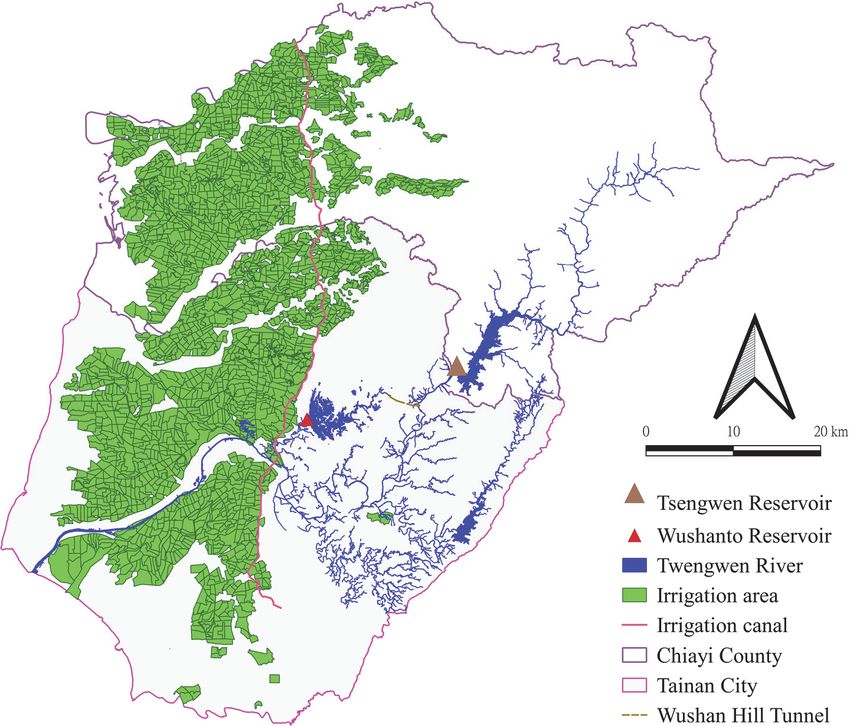
be possible to elevate the feasibility of empty flushing by re-     Figure 1. The map of Tsengwen and Wushanto reservoirs.
ducing its impact on water supply through appropriate joint
operation. The ideal strategy may require utilizing the reser-
voir with the most excessive sediment deposition, referred to       water resources system, respectively. The Tsengwen Reser-
as the primary reservoir throughout the remainder of this pa-       voir is in the upper section of the Tsengwen River, with a
per, to supply demands while preserving the storage in the          watershed area of 481.6 km2 . The original effective capacity
other reservoirs before empty flushing. This will lead to a         with the WSL as the normal pool level 227 m above sea level
lower water surface level (WSL) in the primary reservoir and        (a.s.l.) was 631.2×10⁶ m3 when the reservoir was completed
a higher WSL in the others. Empty flushing in the primary           in 1973. Operated by the Southern Regional Water Resources
reservoir can then be activated once favorable conditions are       Office (SRWRO) of the Taiwan Water Resources Agency,
achieved, such as adequate storage distribution among reser-        its purposes include agricultural water supply, flood control,
voirs to ensure both high sediment flushing efficiency and          and hydropower generation. Located 6 km downstream of the
steady backup water supply.                                         Tsengwen Reservoir, the East Weir diverts the releases from
   This study focused on a water resources system that con-         the Tsengwen Reservoir to the Wushanto Reservoir through
tains two reservoirs, among which one is an on-stream pri-          Wushan Hill Tunnel of 3.3 km at a conveyance capacity of
mary reservoir and requires empty flushing operation. The           56 m3 s−1 .
other with backup storage is an off-stream reservoir and sup-          The Wushanto Reservoir is situated to the southwest of
plies demands jointly with the primary one. This specific           the Tsengwen Reservoir in the upper section of Guantien
schematic protects the backup storage from the turbid release       Creek, a tributary of Tsengwen River. The watershed area
by the reservoir undergoing empty flushing, thus ensuring           of the Wushanto Reservoir is only 60 km2 , which renders it
uninterrupted water supply, and could be the prototype for          conceptually as an off-stream reservoir. In 2015, its effective
more complex systems. The goal is to develop the optimal            capacity was measured to be 78.28×10⁶ m3 . The Chianan Ir-
strategy, which maximizes the efficiency of empty flushing          rigation Association manages the Wushanto Reservoir in co-
without significantly hindering water supply. In the follow-        ordination with the release from Tsengwen Reservoir, sup-
ing section, the case study system is introduced. Key factors       plying irrigation water to over 70 000 ha of farmland in the
influencing the efficiency of sediment flushing as well as the      Chianan Plain and providing the public and industrial water
stability of water supply are then discussed, followed by de-       to Tainan City and Chiayi County.
veloping the methodology to derive the strategy for joint wa-
ter supply and empty flushing in the case study system. The         2.1   The rules of joint operation for water supply
results validate the efficacy of the proposed optimal strategy.
                                                                    Figure 3 presents the joint operating rule curves for the Tsen-
                                                                    gwen and Wushanto reservoirs. The rules stipulate that when
2   Case study area                                                 the total storage of the two reservoirs is below the critical
                                                                    limit, only 80 % of the public demand and 50 % of the agri-
The joint operating system of the serial Tsengwen and               cultural and industrial demands will be satisfied. When the
Wushanto reservoirs is in southern Taiwan. Figures 1 and 2          total storage is between the lower and critical limits, the pub-
show the location of these reservoirs and the network of the        lic demand should be fulfilled, and 75 % of the agricultural

Hydrol. Earth Syst. Sci., 25, 2063–2087, 2021                                        https://doi.org/10.5194/hess-25-2063-2021
Minimizing the impact of vacating instream storage of a multi-reservoir system: a trade-off study of water supply and empty flushing - HESS
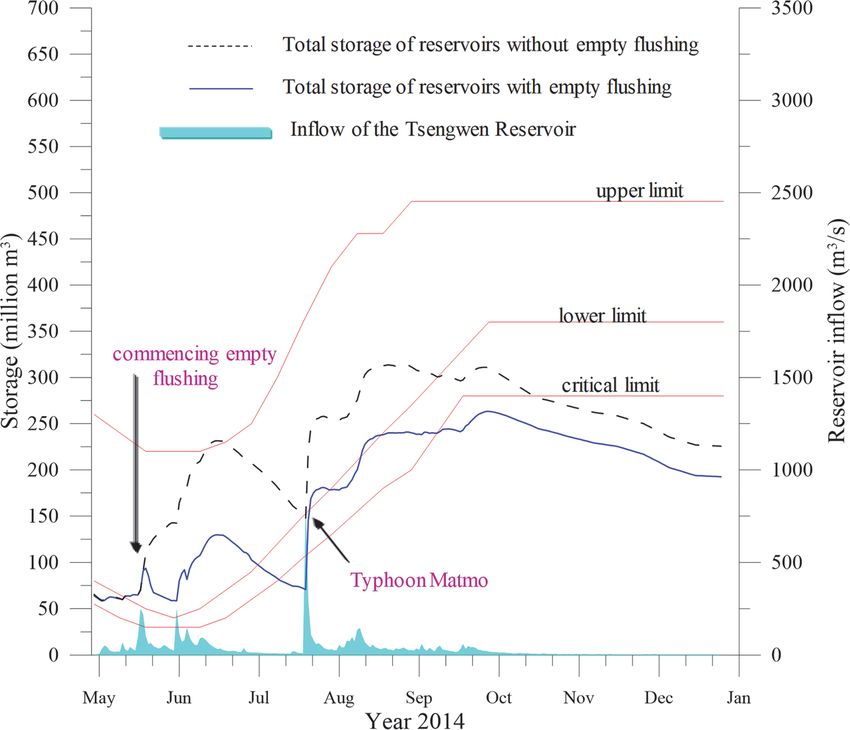
C.-W. Wu et al.: Minimizing the impact of vacating instream storage of a multi-reservoir system                              2065

                                                                   and 0.147 × 10⁹ m3 for public and industrial purposes with a
                                                                   steady demand pattern.

                                                                   2.2   The sedimentation of Tsengwen Reservoir and the
                                                                         adopted counteractions

                                                                   From the beginning of operations in April 1973 until Octo-
                                                                   ber 2017, the effective capacity of the Tsengwen Reservoir
                                                                   was reduced from 631.2 × 10⁶ to 453.7 × 10⁶ m3 . A major
                                                                   cause was Typhoon Morakot in 2009, which brought record-
                                                                   breaking rainfall to the reservoir watershed. The flood inflow
                                                                   of Tsengwen Reservoir peaked at 11 729 m3 s−1 , which is
                                                                   only slightly below the peak of its probable maximum flood
                                                                   as 12 430 m3 s−1 . Measurements at the end of 2009 indicated
                                                                   that the sedimentation of Tsengwen reservoir had increased
                                                                   by a massive 91.08 × 10⁶ m3 that year, which is 19.7 times
                                                                   that of the average annual sedimentation between 1973 and
                                                                   2008. The average annual inflowing sediment volume was
                                                                   elevated to 5.6 × 10⁶ m3 .
                                                                      In response to the substantial increase in sedimentation,
                                                                   the SRWRO increased the releasing capacity of the perma-
                                                                   nent river outlet (PRO) to 177 m3 s−1 and constructed a new
Figure 2. Network of the joint operating system of Tsengwen and    desilting tunnel (DST) near the dam to enhance sediment
Wushanto reservoirs.                                               venting during floods. The improvement of PRO includes re-
                                                                   placing the Howell-Bunger valve by a jet flow gate with in-
                                                                   vert at 153.37 m a.s.l. The design discharge and minimum op-
                                                                   erating WSL of the DST are 1070 m3 s−1 and 210 m a.s.l., re-
and industrial demands need to be satisfied. When the total        spectively. The average annual sluicing volume of sediments
storage is between the upper and lower limits, all demands         through the PRO and DST is estimated as 1.6 × 10⁶ m3 by
should be fulfilled. In the event that the storage in the Tseng-   the SRWRO.
wen Reservoir exceeds the upper limit, extra water can pro-           In addition to hydraulic sluicing, the master plan of desilt-
vide excess supply or full-loaded hydropower generation can        ing Tsengwen Reservoir counters the annual inflowing sed-
be used until the storage returns to the upper limit.              iment by 3.0 × 10⁶ m3 through hydrosuction, 0.5 × 10⁶ m3
   In addition to the joint rule curves, the operators also        through sediment excavation, and 0.5 × 10⁶ m3 through sed-
prefer certain storage distribution among reservoirs to en-        iment yield reduction. This shows hydrosuction is the ma-
hance the overall operating efficiency. The preference is rep-     jor approach adopted, due to its recent economic cost of
resented by the form of storage balancing curves as shown          USD 2.5 per desilted sediment volume (m3 ) and its ability
by Fig. 4, which exhibits the storage preference for the two       to continue desilting during non-flood periods. Several soil
reservoirs in early April (Southern Regional Water Resources       dikes were constructed in the river immediately downstream
Office, 2012). The horizontal axis in the figure measures the      from the dam as temporary depositing area for the dredged
total storage in the system, and the two curves represent the      slurries. The lump-sum volume of the depositing area, which
suggested desired storage for the respective reservoirs with       constrains the annual dredging capacity, already reaches the
regard to various total storage amounts. These curves vary         available maximum of 3.5 × 10⁶ m3 . For the other desilting
during each 10 d period within a year to facilitate efficient      measures, empty flushing could be a potential alternative due
storage allocation according to the pattern of water demands       to the high cost of sediment excavation of USD 20 per cubic
and reservoir inflow.                                              meter and uncertainties of effectiveness of sediment yield re-
   Figure 5 illustrates the whisker box of daily inflow dis-       duction. At present, the bed elevation in front of the Tsen-
charge to the Tsengwen Reservoir in 10 d increments over           gwen Dam is raised beyond 178 m a.s.l. This level is higher
a year. It shows a pattern of two peaks during the wet sea-        than the invert of the PRO inlet which allows for empty flush-
son: the first of which is induced by the front-induced plum       ing.
rain between late May and early June, and the second is by
typhoons mostly occurred in August. The average annual in-
flow volume of the reservoir is around 1.2 × 10⁹ m3 . Water
demand of this system is also included in Fig. 5, with an an-
nual amount of 0.9 × 10⁹ m3 for two semiannual irrigations

https://doi.org/10.5194/hess-25-2063-2021                                       Hydrol. Earth Syst. Sci., 25, 2063–2087, 2021
Minimizing the impact of vacating instream storage of a multi-reservoir system: a trade-off study of water supply and empty flushing - HESS
2066                     C.-W. Wu et al.: Minimizing the impact of vacating instream storage of a multi-reservoir system

Figure 3. Joint operating rule curves of the Tsengwen and Wushanto reservoirs.

                                                                      cases in Table A1, key factors for succeeding in these indices
                                                                      are identified as follows.
                                                                        1. Qualitative conditions for water supply (WS)
                                                                             a. WS1F: adequate water supply during empty flush-
                                                                                ing
                                                                                Episodes between periods with heavy water sup-
                                                                                ply pressure while backup water resources in the
                                                                                system is adequate can be utilized as windows of
                                                                                opportunity to implement empty flushing. As can
                                                                                be seen in Fig. 5, periods between late May and
                                                                                early June are when the irrigational water demand,
                                                                                which constitutes the majority of total demands, is
                                                                                lower. The first semiannual rice crop is harvested,
                                                                                and the second semiannual irrigation just begins.
                                                                                As shown in Fig. 2, between 11 May and 30 June,
                                                                                the lower limit of joint operation rule curves of the
                                                                                two reservoirs is below the effective capacity of the
Figure 4. Storage balancing curves for Tsengwen and Wushanto
                                                                                Wushanto Reservoir. Even if the Tsengwen Reser-
reservoirs in the tenth 10 d period (early April).                              voir is empty, as long as the Wushanto Reservoir
                                                                                is full, the total storage of the system would still
                                                                                exceed the lower limit and is generally adequate to
                                                                                fulfill demand.
3     Methodology                                                            b. WS2A: adequate water supply after empty flushing
                                                                                Satisfaction of this condition requires sufficient
3.1    Qualitative analysis: key factors for successful                         reservoir inflow following empty flushing to rapidly
       operations of empty flushing                                             replenish the storage of the reservoir. Thus, the ca-
                                                                                pacity of a reservoir undergoing empty flushing is
Two major performance indices, expected desilting volume                        usually relatively small compared to the volume of
and the induced increments of water shortage, are used to                       its inflow. Basson and Rooseboom (1997) indicated
evaluate an empty flushing strategy. An optimal strategy                        that empty flushing is more feasible for reservoirs
should maximize the desilting volume while maintaining the                      with an effective capacity to annual inflow volume
incremental shortage under an acceptable threshold. Accord-                     ratio (capacity and inflow ratio, CIR) of less than
ing to the characteristics of the case study area and the other                 0.03. Many of the reservoirs in Table A1 fulfill this

Hydrol. Earth Syst. Sci., 25, 2063–2087, 2021                                          https://doi.org/10.5194/hess-25-2063-2021
Minimizing the impact of vacating instream storage of a multi-reservoir system: a trade-off study of water supply and empty flushing - HESS
C.-W. Wu et al.: Minimizing the impact of vacating instream storage of a multi-reservoir system                                2067

Figure 5. Demand and inflow patterns of Tsengwen Reservoir of all 10 d periods throughout a year.

          criterion. The others that have a CIR greater than                        median of 68.98 × 10⁶ m3 . This means that if
          0.03 are located in areas with uneven seasonal rain-                      the storage can be properly allocated to the
          fall distributions, such that the abundance of inflow                     Wushanto Reservoir, then the Tsengwen Reser-
          during flood seasons can effectively refill the stor-                     voir is likely to be nearly empty during these
          age soon after empty flushing. The case study sys-                        periods. The capacity of PRO would also allow
          tem with the CIR for the Tsengwen Reservoir as                            for timely drawdown prior to expected flood so
          0.38 shares the same characteristic of uneven rain-                       that the flood inflow can satisfy FS1Q.
          fall distribution. The proper timing for terminating                    – After empty flushing is initiated. Once empty
          empty flushing should thus be carefully determined                        flushing operation is initiated, the reservoir
          to ensure the remaining inflow during wet season                          should remain as close to empty as possible to
          satisfies this condition.                                                 maintain high flushing efficiency. However, if
                                                                                    the inflow exceeds the capacity of PRO, then
  2. Qualitative conditions for flushing sediments (FS)                             the WSL of the reservoir will rise. This leads
     Compliance with FS promotes efficiency of sediment                             to decreased flow velocity and reduced flush-
     flushing. The key is to take advantage of opportuni-                           ing efficiency in the reservoir. Atkinson (1996)
     ties with both high inflow and low WSL of the primary                          suggested the use of the drawdown ratio (DDR)
     reservoir to perform empty flushing.                                           to measure the flushing efficiency. This index is
                                                                                    defined as 1 minus the ratio between the depth
      a. FS1Q: high inflow during empty flushing                                    of WSL during empty flushing and the depth
         High inflow is required to more effectively scour                          of normal pool level of the reservoir. Atkin-
         and flush out the depositions of the reservoir. Atkin-                     son (1996) and White (2001) defined incom-
         son (1996) and White (2001) indicated that empty                           plete drawdown flushing as situations in which
         flushing should only be initiated when the inflow                          DDR is less than 0.66, wherein the depth of
         is at least double the inflow in ordinary conditions.                      the water during flushing is greater than one-
         For the Tsengwen Reservoir, the wet season gener-                          third of the maximum depth. For the case of
         ally begins between late May and early June as the                         Tsengwen Reservoir, this threshold marks at the
         front-induced precipitation occurs. For floods dur-                        elevation of 185 m a.s.l., which corresponds to
         ing this period, the daily inflow discharge usually                        an impoundment of 16.6 × 10⁶ m3 . In circum-
         exceeds 100 m3 s−1 , which is over 10 times the av-                        stances when the WSL exceeds this level, the
         erage inflow during January to April, and the hourly                       efficiency of empty flushing is significantly re-
         peak discharge could be beyond 1000 m3 s−1 .                               duced, and it is recommended to switch the op-
      b. FS2L: low WSL before and during empty flushing                             eration to regular mode of water supply.
           – Before empty flushing is started. The operating             The above analysis eventually leads to a conclusion that
             records of Tsengwen Reservoir over 4 decades             the meteorological and operating conditions during May and
             shows its WSL is generally the lowest in mid-            June are favorable for empty flushing of the Tsengwen Reser-
             May, with average storage of 98.7×10⁶ m3 and             voir.

https://doi.org/10.5194/hess-25-2063-2021                                           Hydrol. Earth Syst. Sci., 25, 2063–2087, 2021
Minimizing the impact of vacating instream storage of a multi-reservoir system: a trade-off study of water supply and empty flushing - HESS
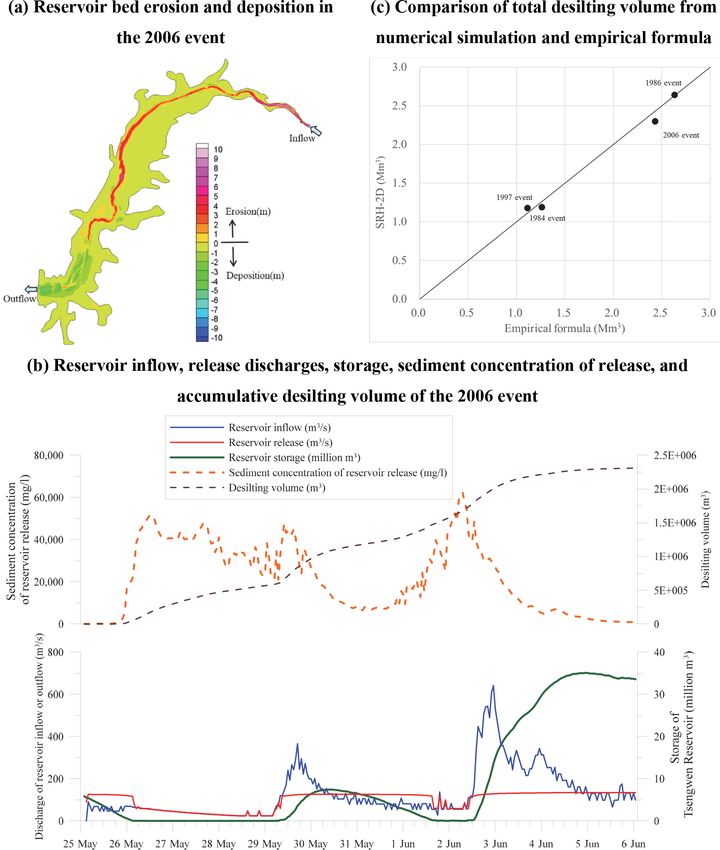
2068                     C.-W. Wu et al.: Minimizing the impact of vacating instream storage of a multi-reservoir system

3.2     Quantitative derivation of the optimal empty                ates a favorable initial condition for empty flushing. Figure 7
        flushing strategy                                           depicts the balancing curves updated from the original Fig. 4.

The proposed method adopts the simulation–optimization              3.2.2   Conditions for initiation of an empty flushing
linkage approach for deriving optimal strategy. It requires                 operation
simulating the operations of water supply and empty flush-
ing, thus allowing for quantifying the desilting volume             Water supply simulation of historical daily reservoir inflow
as well as the incremental water shortage generated by a            records is sequentially performed according to the joint oper-
given strategy. The process of water supply is simulated            ating rules. During the simulation, empty flushing operation
according to a set of joint operating rules as presented in         is activated when all of the following conditions are satisfied:
Sect. 3.2.1. When specific quantitative conditions presented         1. The current simulating date falls within the pre-
in Sect. 3.2.2 are achieved, empty flushing in the primary              evaluated feasible time frame for empty flushing.
reservoir is activated, and the approach in Sect. 3.2.3 is em-
ployed to estimate the desilting volume. The empty flush-            2. The storage of the primary reservoir is lower than a
ing terminates when the conditions presented in Sect. 3.2.4             threshold T U . This ensures the satisfaction of FS2L.
are reached, and the simulation is switched to regular wa-              A higher value of T U allows for initiating drawdown
ter supply operation until the next time activation conditions          flushing at higher primary reservoir storage, thus in-
are satisfied. The simulation model is linked to an optimiza-           creasing the range of opportunities for empty flushing.
tion algorithm to calibrate optimal parameters in the activa-           Nonetheless, a higher T U incurs the risk that, if subse-
tion and termination conditions, according to the formulation           quent reservoir inflow falls short of predicted values, the
presented in Sect. 3.2.5. Figure 6 depicts a flowchart of the           emptied storage may not be replenished.
analyzing procedure.
                                                                     3. The total storage in the backup reservoir is greater than
3.2.1    Joint operating rules for a multi-reservoir system             a threshold T D . This ensures the satisfaction of WS1F.
                                                                        A higher value of T D elevates the stability of water sup-
According to Oliveria and Loucks (1997), the rules to jointly           ply during empty flushing. In cases where either this or
operate multiple reservoirs for water supply include the fol-           the above condition has not been met, demand should
lowing two phases.                                                      be supplied from the primary reservoir as much as pos-
                                                                        sible, or storage should be diverted from the primary
 1. Determination of total water supply. The total amount               reservoir to the other. However, this storage reallocation
    of water supply is determined based on the total storage            may be limited by the water-transmitting capacity be-
    of reservoirs and the system-wide release rule. The rule            tween reservoirs, such that the conditions for initiating
    stipulates that if the total storage does not suffice, a dis-       empty flushing may not be met within the prespecified
    count of total water supply may be applied, such as the             feasible period for flushing. Therefore, a higher T D may
    joint rule curves shown in Fig. 2 and the water rationing           reduce the number of opportunities to perform empty
    mechanism described in Sect. 2.                                     flushing.

 2. Distributing storage to individual reservoirs. Based on         3.2.3   Estimation of the flushed sediment discharge
    the calculated total water supply, the total end-of-period
    storage in the system can be estimated with the expected        Once the activation conditions are met, the gates of the PRO
    reservoir inflow during one single operating period. The        of Tsengwen Reservoir are fully opened to empty the stor-
    release from each individual reservoir can then be deter-       age and route the inflowing water and sediments. The re-
    mined by applying an individual reservoir storage bal-          lease from the primary reservoir would cause blockages of
    ancing function, such as the storage balancing curves           the downstream water diversion or water treatment facilities
    depicted in Fig. 4.                                             due to its high sediment concentration. Thus, the water sup-
                                                                    ply relies solely on the storage preserved in the Wushanto
   Figure 4 was designed to ensure efficient utilization of wa-     Reservoir. During empty flushing, the inflow, outflow, and
ter resources, without any consideration of empty flushing.         WSL of the primary reservoir are used to estimate the vol-
It was derived initially based on field operating experiences       ume of flushed sediments. The estimation can be based on
and revised through a trial and error process. The first part       either numerical simulation or empirical formula, and the
of the proposed method requires appropriate adjustment of           second of which is adopted by this paper due to its simplic-
the storage balancing curves before and during the periods          ity and easy incorporation with the proposed optimization
feasible for empty flushing. This adjustment prioritizes the        framework. After the optimized strategy identifies feasible
water released from the primary Tsengwen Reservoir while            events of empty flushing, numerical simulation is then used
preserving storage in the Wushanto Reservoir. This complies         to verify the effectiveness of the empirical formula, as pre-
with the aforementioned WS1F and FS2L strategies and cre-           sented in Appendix A3.

Hydrol. Earth Syst. Sci., 25, 2063–2087, 2021                                        https://doi.org/10.5194/hess-25-2063-2021
Minimizing the impact of vacating instream storage of a multi-reservoir system: a trade-off study of water supply and empty flushing - HESS
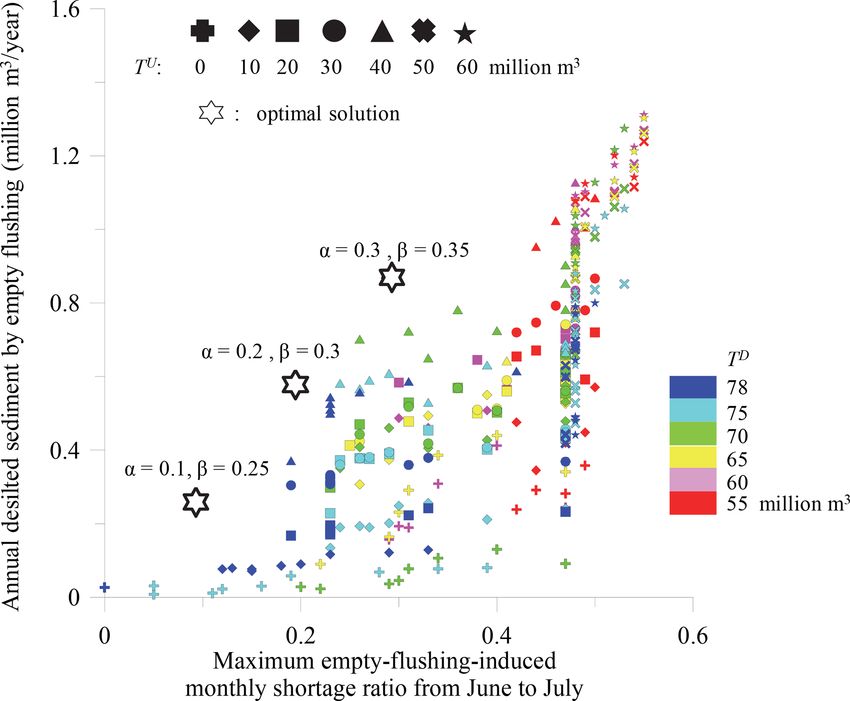
C.-W. Wu et al.: Minimizing the impact of vacating instream storage of a multi-reservoir system                                   2069

Figure 6. The procedure to derive the optimal empty flushing strategy.

                                                                         measurements from 14 reservoirs in China:

                                                                                   Q1.6 1.2
                                                                                    t Sf
                                                                         QCt = ψ            ,                                       (1)
                                                                                    W 0.6
                                                                         where QCt and Qt denote the sediment discharge (t s−1 ) and
                                                                         water discharge (m3 s−1 ) flushed from the primary reservoir
                                                                         during the tth simulating day, respectively; Sf represents the
                                                                         energy slope associated with the flow in the primary reservoir
                                                                         during empty flushing; W is the width of the flushing chan-
                                                                         nel (m), which can be estimated using the empirical formula
                                                                         W = 12.8 · Q0.5 (Atkinson, 1996); and ψ is the flushing co-
                                                                         efficient, associated with the characteristics of the sediment
                                                                         and topography of the reservoir.
                                                                            For the current case study area, the value of ψ is set to
                                                                         60 when the reservoir storage remains nearly empty, as sug-
                                                                         gested by Atkinson (1996) for cases with limited-capacity
                                                                         bottom outlets. To prevent overestimating the effectiveness
                                                                         of empty flushing, it is assumed that if a flood raises the WSL
Figure 7. Modified storage balancing curves using Tsengwen               of the Tsengwen Reservoir to exceed 185 m a.s.l., which is
Reservoir as primary source to satisfy water demand.                     about 30 % of its maximum depth, then the flushed sediment
                                                                         volume from the PRO is set to be 0. This setting is supported
                                                                         by field measurements of Tsengwen Reservoir and other ad-
   The empirical formula developed by the International                  jacent reservoirs which regularly undergo empty flushing in
Research and Training Center on Erosion and Sediment                     southern Taiwan. These measurements are reported in Ap-
(IRTCES) in Tsinghua University, Beijing (IRTCES, 1985),                 pendix A2.
is employed for the estimation of releasing sediment dis-
charge from the primary reservoir. The formula is based on

https://doi.org/10.5194/hess-25-2063-2021                                             Hydrol. Earth Syst. Sci., 25, 2063–2087, 2021
Minimizing the impact of vacating instream storage of a multi-reservoir system: a trade-off study of water supply and empty flushing - HESS
2070                     C.-W. Wu et al.: Minimizing the impact of vacating instream storage of a multi-reservoir system

3.2.4   Conditions for termination of empty flushing                water resource systems of western Taiwan. Details of its
        operation                                                   simulations regarding the operations of multi-reservoir
                                                                    systems can be found in Chou et al. (2006) and Chou and
Empty flushing should be terminated if one of the following         Wu (2014).
circumstances occurs.
                                                                    3.2.5   Evaluation of optimal empty flushing strategies
 1. The accumulative released water volume from the pri-
    mary reservoir exceeding a certain threshold T V would          The thresholds for activating and terminating an empty flush-
    halt the flushing of the year. Empty flushing consumes          ing operation as described in Sect. 3.2.2 and 3.2.4 are re-
    water originally stored in the reservoir for water sup-         garded as decision variables. They are calibrated to maximize
    ply. This consumption is expected to be compensated by          the total desilting volume without inducing both short- and
    subsequent floods which refill the reservoir and induce         long-term intolerable water shortage scenarios. The short-
    spillage. Nonetheless, if the floods are not significant        term scenario relies on the occurrence of subsequent floods
    enough following the flushing, the impacts of excess re-        to induce spillage and fully compensate for the impact of
    leasing will be carried on to the next dry season and in-       emptying reservoir. Thus the incremental shortage following
    crease water shortage. The threshold T V alleviates this        empty flushing is concentrated in a few months before the
    impact by restraining the water consumption volume of           consequent floods, during each of which the monthly short-
    empty flushing.                                                 age increment and ratio are calculated:
 2. Providing the accumulative release volume is still under         I             0
    T V , the flushing should be terminated when the flood          dn,m = dn,m − dn,m ,      m = 0, 1, 2, . . ., nm ,
    flow has raised the WSL of the primary reservoir and              n = 1, 2, . . ., ny ;                                              (2)
    daily inflow subsequently recedes to be below the ca-                  dn,m
                                                                     R
    pacity of associated bottom outlets. This situation indi-       dn,m =        , m = 0, 1, . . ., nm ,        n = 1, 2, . . ., ny ;   (3)
                                                                           Dm
    cates that the operation has been successfully timed to
    encounter a flood and should thus be ended when the                      I
                                                                    where dn,m          R represent the water shortage increment
                                                                                  and dn,m
    flood ends.                                                     and ratio during the mth month following the feasible period
                                                                    of empty flushing in the nth simulating year; Dm denotes
 3. The flushing should be ended when the storage of
                                                                    the water demand during the mth month following empty
    backup reservoir decreases to below a threshold T d .                                     0 represent simulated water short-
                                                                    flushing; and dn,m and dn,m
    This condition prevents short-term water shortages fol-
                                                                    ages under conditions with and without empty flushing op-
    lowing flushing operations resulting from insufficient                      0
                                                                    erations. dn,m   is from simulating the default regular water
    storage. During the emptying of the primary reservoir,
                                                                    supply process using the GWASIM, and dn,m is obtained by
    providing a water supply will gradually reduce available
                                                                    incorporating empty flushing operations according to the ac-
    storage in the other reservoir. A higher value of T d will
                                                                    tivating and terminating conditions defined by the decision
    cause the storage to be below threshold more quickly,
                                                                    variables. nm is the number of months within which the im-
    thus reducing the window of operation for empty flush-
                                                                    pact of empty flushing on water supply is carried over, and
    ing. Nonetheless, adequate reservoir inflow and proper
                                                                    ny is the number of simulating years.
    storage reallocation after an earlier termination of one
                                                                       The long-term shortage scenario aims at situations that
    flushing operation will facilitate the reinitiation of a sub-
                                                                    subsequent floods are not significant enough to induce reser-
    sequent operation during the feasible period for empty
                                                                    voir spillage. Thus the incremented shortage extends into the
    flushing. Thus, under conditions of a higher T d value,
                                                                    next dry season, of which shortage ratios with or without
    the pattern of empty flushing may be transformed from
                                                                    empty flushing are expressed below:
    a few operations of longer duration into multiple inter-
    mittent operations of shorter durations.                                    0
                                                                     R,0
                                                                               dn,dry
   A generalized water allocation simulation model                  dn,dry =        ,    n = 1, 2, . . ., ny ;                           (4)
                                                                             Ddry
(GWASIM) developed by Chou and Wu (2010) is used to
                                                                     R       dn,dry
simulate the alternating operations of empty flushing and           dn,dry =        ,    n = 1, 2, . . ., ny ;                           (5)
joint water supply according to the aforementioned rules                     Ddry
and conditions. The simulation is designed to evaluate the          where Ddry represents the total demand during the dry sea-
performance of the water resources system under specific                      0                 R,0          R
                                                                    son, and dn,dry , dn,dry , dn,dry , and dn,dry are the water shortage
storage volume, water demand, and operating rules. It
                                                                    volumes and ratios with and without executing empty opera-
requires sequential daily routing of system operation for
                                                                    tion during the dry season, respectively.
several decades of inflow series to reflect the long-term
hydrological variation. GWASIM has already been im-
plemented in the planning and management studies of all

Hydrol. Earth Syst. Sci., 25, 2063–2087, 2021                                           https://doi.org/10.5194/hess-25-2063-2021
Minimizing the impact of vacating instream storage of a multi-reservoir system: a trade-off study of water supply and empty flushing - HESS
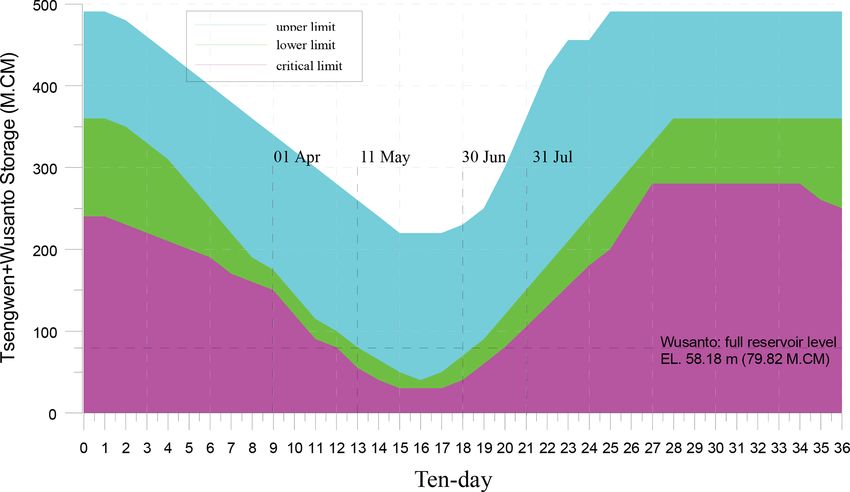
C.-W. Wu et al.: Minimizing the impact of vacating instream storage of a multi-reservoir system                                   2071

    The formulation of the optimization problem is as follows:       The results show that in May there is a 52 % probability
                                                                     that the storage of the Tsengwen Reservoir will drop below
              nt
              X                                                      20×106 m3 and an 8 % probability that the Tsengwen Reser-
Maximize            QCt ,                                      (6)   voir storage drops below 20 × 106 m3 while the Wushanto
              t=1
                                                                     Reservoir storage simultaneously exceeds the lower limit.
subject to                                                           In June, the two probabilities are 31 % and 14 %, respec-
                                                                     tively. These 2 months with the highest probabilities of de-
 R          R    I
                                      m = 0, 1, 2, . . ., nm
                       
dmax = max dn,m dn,m >0 ≤α                                           sired storage distribution within a year are most promising
           n,m
                                                                     for empty flushing. The respective storage of the Tsengwen
    n = 1, . . ., ny ;                                         (7)   and Wushanto reservoirs each satisfies the abovementioned
                                       
 R
dmax,dry =              R
                 max y dn,dry  R,0
                              dn,dry ≤ β ≤ β;                  (8)   conditions only between 11 May and 20 June, which is se-
              n=1,...,n                                              lected as the feasible period for empty flushing in the Tseng-
                                                                     wen Reservoir.
where nt is the total number of days within the simulating
horizon; QCt is the simulated sediment discharge from the            4.2   Schemes for the modification of storage balancing
primary reservoir by empty flushing on the tth day. It is de-              curves
termined by substituting the release of the primary reservoir
during the flushing period into Eq. (1). The left-hand side          Based on the base scenario, three additional simulations are
(LHS) of Eq. (7), dmaxR , represents the maximum monthly
                                                                     conducted in which the modified storage balancing curves of
water shortage ratio from the ny simulating years given that         Fig. 7 are applied during (1) 1 May to 20 June, (2) 1 April to
the short-term shortage is induced by empty flushing. The            20 June, and (3) 1 March to 20 June. The simulated results
right-hand side (RHS) of Eq. (7), α, is the maximum accept-          are summarized in Table 1. It demonstrates that the prob-
                 R . The LHS of Eq. (8), d R
able value for dmax                         max,dry , represents     ability of favorable storage distribution for empty flushing
the maximum shortage ratio during the dry season following           during May and June can be effectively elevated by modify-
empty flushing, given that the original shortage ratio of the        ing storage balancing curves in April. The trade-off of creat-
same periods without flushing is less than a failure thresh-         ing this favorable initial condition is that preserving the stor-
old. The failure threshold of shortage ratio β usually means         age of Wushanto Reservoir before and during empty flushing
the irrigation for majority areas needs to be suspended to en-       might cause unnecessary spillage while the full reservoir can-
sure steady public water supply in Taiwan. Equation (8) thus         not store the inflow from Guantien Creek. Also, allocating
avoids inducing additional failure events of water supply in         storage between reservoirs through the Wushan Hill Tunnel
the dry season following empty flushing.                             will induce more transmitting loss of water. Nonetheless, the
   The BOBYQA (Bound Optimization BY Quadratic Ap-                   shortage ratios generated by the modified balancing curves
proximation) algorithm, a nonlinear optimization algorithm           are no more than 0.01 higher than those from the original bal-
of Powell (2009), is used to solve the problem. The details          ancing curves, which means that the modification has only a
of BOBYQA can be found in Powell (2009), and the barrier             trivial impact on the efficiency of water resources utilization.
function approach to handle the constraint of Eqs. (7) and (8)          The results also indicate that the average water shortage ra-
can be found in Chou and Wu (2015).                                  tio during the wet season drops considerably after July. This
                                                                     is because the first typhoon of the wet season generally oc-
4     Analysis, results, and discussion                              curs in July or early August, bringing substantial inflow to the
                                                                     reservoirs. Thus in the following evaluation of empty flush-
4.1     The base scenario with default operating rules               ing strategies, the water shortage scenarios through the end
                                                                     of July are selected to represent the impact of empty flushing
In the base scenario, sequential water supply simulation in          on short-term water supply, i.e., nm in Eqs. (3) and (7) is set
the absence of empty flushing is performed using the daily           to 1. For the long-term impact, the shortage ratio during the
inflow records of the reservoirs from 1975 to 2009 and the           next dry season, from January to May of the next year, are
joint operating rules as described in Sect. 2. It generates the                                         R
                                                                     considered, referring to dn,dry , dn,dry        R
                                                                                                              , and dmax,dry in Eqs. (4)
                                       0 , d0            R,0
default water supply condition, i.e., dn,m  n,dry , and dn,dry in    and (8).
Eqs. (2) and (4), and provides a basis to evaluate the incre-
mental shortage induced by empty flushing.                           4.3   Preliminary simulations and assessment of empty
   Based on the simulated results, the probability that the                flushing strategies
storage in the Tsengwen Reservoir drops below 20 × 106 m3
for preparing empty flushing timely in a given month while           The thresholds to activate and terminate an empty flushing
the Wushanto Reservoir storage simultaneously exceeds the            operation, i.e., T U for the Tsengwen Reservoir, T D and T d
lower limit of the rule curves is calculated. The results            for the Wushanto Reservoir, and T V for the maximum accu-
are displayed in the “Balancing curves I” rows of Table 1.           mulative releasing volume, are parameters to be optimized.

https://doi.org/10.5194/hess-25-2063-2021                                          Hydrol. Earth Syst. Sci., 25, 2063–2087, 2021
Minimizing the impact of vacating instream storage of a multi-reservoir system: a trade-off study of water supply and empty flushing - HESS
2072                         C.-W. Wu et al.: Minimizing the impact of vacating instream storage of a multi-reservoir system

Table 1. Monthly probabilities of Tsengwen Reservoir storage dropping below 20 × 106 m3 under various strategies of storage allocation.

             Month                          Jan       Feb      Mar       Apr       May          Jun      Jul   Aug    Sep    Oct    Nov    Dec
                                                                                                 Index
             Strategy                          Monthly probabilities of Tsengwen Reservoir storage dropping below 20 × 106 m3
             Balancing curves I            0.01      0.04      0.13      0.13      0.52      0.31     0.12     0.02   0.00   0.00   0.00   0.00
             Balancing curves II           0.03      0.04      0.13      0.13      0.64      0.33     0.13     0.03   0.00   0.00   0.00   0.01
             Balancing curves III          0.03      0.04      0.13      0.34      0.78      0.33     0.13     0.02   0.00   0.00   0.00   0.01
             Balancing curves IV           0.03      0.04      0.13      0.45      0.78      0.33     0.13     0.02   0.00   0.00   0.00   0.01
                                                                                                 Index
             Strategy                                Monthly probabilities of storage in Tsengwen Reservoir dropping below
                                                    20 × 106 m3 with storage in Wushanto Reservoir exceeding the lower limit
             Balancing curves I            0.00      0.00      0.00      0.00      0.08      0.14     0.00     0.00   0.00   0.00   0.00   0.00
             Balancing curves II           0.00      0.00      0.00      0.00      0.11      0.16     0.00     0.00   0.00   0.00   0.00   0.00
             Balancing curves III          0.00      0.00      0.00      0.00      0.14      0.16     0.00     0.00   0.00   0.00   0.00   0.00
             Balancing curves IV           0.00      0.00      0.00      0.01      0.14      0.16     0.00     0.00   0.00   0.00   0.00   0.00
                                                                                                 Index
             Strategy                                                       Average monthly water shortage ratio
             Balancing curves I            0.10      0.17      0.23      0.29      0.22      0.07     0.10     0.06   0.06   0.09   0.09   0.11
             Balancing curves II           0.11      0.18      0.24      0.30      0.23      0.07     0.10     0.06   0.07   0.09   0.09   0.12
             Balancing curves III          0.11      0.18      0.24      0.31      0.23      0.07     0.10     0.06   0.07   0.09   0.09   0.12
             Balancing curves IV           0.11      0.18      0.24      0.31      0.23      0.07     0.10     0.06   0.07   0.09   0.09   0.12
           Balancing curves I: the original storage balancing curves as shown in Fig. 4.
           Balancing curves II: adopting the modified curves as in Fig. 7 from 1 May to 20 June.
           Balancing curves III: adopting the modified curves as in Fig. 7 from 1 April to 20 June.
           Balancing curves IV: adopting the modified curves as in Fig. 7 from 1 March to 20 June.

Except T V , the other parameters are allowed to vary dur-                                from the estimated flushing discharge by Eq. (1) with bulk
ing different 10 d periods from 11 May to 20 June to pro-                                 density as 1.56 t m−3 (Water Resources Agency, 2010b). The
mote the performance of desilting and backup water sup-                                   simulations are then repeated by applying the modified stor-
ply. Before actually optimizing these parameters, preliminary                             age balancing curves in Fig. 7 to the period between April
simulations are performed with constant storage thresholds                                and June, and the results of which are displayed in Fig. 9. A
throughout 11 May to 20 June. This process facilitates deter-                             comparison of Figs. 8 and 9 shows that the modified stor-
mination of a good initial solution as well as a basis for com-                           age balancing curves effectively enhance the effectiveness
parison to measure the effects of optimization. The prelimi-                                                                           R between 0.17
                                                                                          of desilting. For instance, strategies with dmax
nary simulations consider seven different T U values, ranging                             and 0.23 correspond to a maximum annual desilting volume
from 0 to 60×106 m3 with a constant interval of 10×106 m3 ,                               of 0.06 × 10⁶ m3 yr−1 in Fig. 8, whereas the same strategies
for the Tsengwen Reservoir. Six values (including 55 × 106 ,                              in Fig. 9 result in an increase of desilting volume reaching
60×106 , 65×106 , 70×106 , 75×106 , and 78×106 m3 ) for T D                               0.54 × 10⁶ m3 yr−1 .
and nine values (including 30 to 70 × 106 m3 with a constant
interval of 5 × 10⁶ m3 ) for T d are considered. The value T V                            4.4    Optimization of empty flushing strategies
is set to an extremely high value, thus imposing no constraint
on the water releasing volume of empty flushing as well as                                Coupling GWASIM which simulates the water supply and
the long-term water supply. All these values contribute to                                empty flushing process from 1975 to 2009 with the optimiza-
a total of 308 combinations of empty flushing strategies in                               tion algorithm leads to an optimal solution of Eqs. (6), (7),
which T d is less than T D . Simulations of the 308 combi-                                and (8) under specific values of α and β. Three sets of α and
nations are performed using the original storage balancing                                β are tested, which are (0.1, 0.25), (0.2, 0.30), and (0.3, 0.35).
curves. The resulting average annual desilting volume and                                 The corresponding optimized results are presented in Table 2.
maximum short-term monthly water shortage ratio induced                                   The average annual desilting volume and maximum monthly
by empty flushing are then calculated. The results are pre-                               shortage ratio induced by empty flushing are also marked in
sented in Fig. 8, in which the desilting volume is converted                              Fig. 9. The abovementioned desilting volumes are calculated
                                                                                          using Eq. (1) with the setting of ψ described in Sect. 3.2.3. To

Hydrol. Earth Syst. Sci., 25, 2063–2087, 2021                                                                  https://doi.org/10.5194/hess-25-2063-2021
C.-W. Wu et al.: Minimizing the impact of vacating instream storage of a multi-reservoir system                                                                                                                                                                                                                                                                                                      2073

                                                                                                                                                                                                                                                                                                                                                   1975–
                                                                                                                                                                                                                                                                                                                                                                      2018
                                                                                                                                                                                                                                                                                                                                                                                  4.3
                                                                                                                                                                                                                                                                                                                                                                                 12.0
                                                                                                                                                                                                                                                                                                                                                                                 17.2
                                                                                                                                                                                                                                                                                                                        (million USD
                                                                                                                                                                                                                                                                                                                         Net benefits

                                                                                                                                                                                                                                                                                                                          per year)
                                                                                                                                                                                                                                                                                                                                                   1975–
                                                                                                                                                                                                                                                                                                                                                                      2009
                                                                                                                                                                                                                                                                                                                                                                                  4.2
                                                                                                                                                                                                                                                                                                                                                                                 10.5
                                                                                                                                                                                                                                                                                                                                                                                 15.8
                                                                                                                                                                                                                     Performance indices
                                                                                                                                                                                                                                                                                                                        Desilting volume

                                                                                                                                                                                                                                                                                                                                                   1975–
                                                                                                                                                                                                                                                                                                                                                                      2018
                                                                                                                                                                                                                                                                                                                                                                                 0.27
                                                                                                                                                                                                                                                                                                                                                                                 0.69
                                                                                                                                                                                                                                                                                                                                                                                 0.97
                                                                                                                                                                                                                                                                                                                        (×106 m3 yr−1 )

                                                                                                                                                                                                                                                                                                                                                   1975–
                                                                                                                                                                                                                                                                                                                                                                      2009
                                                                                                                                                                                                                                                                                                                                                                                 0.25
                                                                                                                                                                                                                                                                                                                                                                                 0.59
                                                                                                                                                                                                                                                                                                                                                                                 0.88
                                                                                                                                                                                                                                                                                                                        (×106 m3 yr−1 )
                                                                                                                                                                                                                                                                                                                                                   1975–
                                                                                                                                                                                                                                                                                                                                                                      2018
                                                                                                                                                                                                                                                                                                                                                                                  7.27
                                                                                                                                                                                                                                                                                                                                                                                 11.86
                                                                                                                                                                                                                                                                                                                                                                                 14.85
                                                                                                                                                                                                                                                                                                                         Water shortage
                                                                                                                                                                                                                                                                                                                          increment
                                                                        Table 2. Optimal empty flushing strategies based on acceptable water shortage rates following the completion of empty flushing operations.

                                                                                                                                                                                                                                                                                                                                                   1975–
                                                                                                                                                                                                                                                                                                                                                                      2009
                                                                                                                                                                                                                                                                                                                                                                                  5.48
                                                                                                                                                                                                                                                                                                                                                                                  8.95
                                                                                                                                                                                                                                                                                                                                                                                 11.77
                                                                                                                                                                                                                                                                                                                        Maximum allowable
                                                                                                                                                                                                                                                                                                                             water volume
                                                                                                                                                                                                                                                                                                                             consumed by
                                                                                                                                                                                                                                                                                                                                                   empty flushing
                                                                                                                                                                                                                                                                                                                                                                    (×106 m3 )
                                                                                                                                                                                                                                                                                                                                                                                  76.0
                                                                                                                                                                                                                                                                                                                                                                                 132.0
                                                                                                                                                                                                                                                                                                                                                                                 199.0
Figure 8. Simulation results of various empty flushing strategies
using the original storage balancing curves.

                                                                                                                                                                                                                     Optimized decision variables defining the rules for activation and termination of empty flushing

                                                                                                                                                                                                                                                                                                                                                                      17th
                                                                                                                                                                                                                                                                                                                                                                                 76.0
                                                                                                                                                                                                                                                                                                                                                                                 60.0
                                                                                                                                                                                                                                                                                                                                                                                 60.0
                                                                                                                                                                                                                                                                                                                        condition T d (×106 m3 )
                                                                                                                                                                                                                                                                                                                          Wushanto Reservoir
                                                                                                                                                                                                                                                                                                                          flushing termination

                                                                                                                                                                                                                                                                                                                                                                      16th
                                                                                                                                                                                                                                                                                                                                                                                 60.0
                                                                                                                                                                                                                                                                                                                                                                                 44.0
                                                                                                                                                                                                                                                                                                                                                                                 39.2
                                                                                                                                                                                                                                                                                                                                                   10 d period
                                                                                                                                                                                                                                                                                                                                                                      15th
                                                                                                                                                                                                                                                                                                                                                                                 51.0
                                                                                                                                                                                                                                                                                                                                                                                 40.0
                                                                                                                                                                                                                                                                                                                                                                                 40.0
                                                                                                                                                                                                                                                                                                                                                                      14th
                                                                                                                                                                                                                                                                                                                                                                                 73.9
                                                                                                                                                                                                                                                                                                                                                                                 55.0
                                                                                                                                                                                                                                                                                                                                                                                 51.1
                                                                                                                                                                                                                                                                                                                                                                      17th
                                                                                                                                                                                                                                                                                                                                                                                 79.8
                                                                                                                                                                                                                                                                                                                                                                                 79.8
                                                                                                                                                                                                                                                                                                                                                                                 79.8
                                                                                                                                                                                                                                                                                                                        condition T D (×106 m3 )
                                                                                                                                                                                                                                                                                                                          Wushanto Reservoir
                                                                                                                                                                                                                                                                                                                           flushing initiation

                                                                                                                                                                                                                                                                                                                                                                      16th
                                                                                                                                                                                                                                                                                                                                                                                 68.5
                                                                                                                                                                                                                                                                                                                                                                                 67.5
                                                                                                                                                                                                                                                                                                                                                                                 67.5
                                                                                                                                                                                                                                                                                                                                                   10 d period
                                                                                                                                                                                                                                                                                                                                                                      15th
                                                                                                                                                                                                                                                                                                                                                                                 70.0
                                                                                                                                                                                                                                                                                                                                                                                 61.0
                                                                                                                                                                                                                                                                                                                                                                                 57.0

Figure 9. Simulation results of various empty flushing strategies
                                                                                                                                                                                                                                                                                                                                                                      14th
                                                                                                                                                                                                                                                                                                                                                                                 75.0
                                                                                                                                                                                                                                                                                                                                                                                 75.0
                                                                                                                                                                                                                                                                                                                                                                                 75.0

using modified storage balancing curves from April to June.
                                                                                                                                                                                                                                                                                                                                                                      17th
                                                                                                                                                                                                                                                                                                                                                                                  0.0
                                                                                                                                                                                                                                                                                                                                                                                 30.0
                                                                                                                                                                                                                                                                                                                                                                                 30.0
                                                                                                                                                                                                                                                                                                                        condition T U (×106 m3 )
                                                                                                                                                                                                                                                                                                                          Tsengwen Reservoir
                                                                                                                                                                                                                                                                                                                           flushing initiation

validate this estimation, numerical simulations of sediment
                                                                                                                                                                                                                                                                                                                                                                      16th
                                                                                                                                                                                                                                                                                                                                                                                 40.0
                                                                                                                                                                                                                                                                                                                                                                                 44.0
                                                                                                                                                                                                                                                                                                                                                                                 40.0
                                                                                                                                                                                                                                                                                                                                                   10 d period

flushing process by the SRH-2D model of the US Bureau of
Reclamation (Lai, 2008) are carried out for the major flush-
                                                                                                                                                                                                                                                                                                                                                                      15th
                                                                                                                                                                                                                                                                                                                                                                                 40.0
                                                                                                                                                                                                                                                                                                                                                                                 40.0
                                                                                                                                                                                                                                                                                                                                                                                 40.0

ing events identified in the optimal strategy associated with
α = 0.1 and β = 0.25. The result shows great agreement be-
                                                                                                                                                                                                                                                                                                                                                                      14th
                                                                                                                                                                                                                                                                                                                                                                                  0.2
                                                                                                                                                                                                                                                                                                                                                                                 60.0
                                                                                                                                                                                                                                                                                                                                                                                 80.0

tween the empirical estimation and numerical simulation and
is reported in Appendix A3. Sensitivity analysis of the flush-
                                                                                                                                                                                                                                                                                                                                                                                 α = 0.1, β = 0.25
                                                                                                                                                                                                                                                                                                                                                                                 α = 0.2, β = 0.30
                                                                                                                                                                                                                                                                                                                                                                                 α = 0.3, β = 0.35

ing coefficient in the scenario of (α = 0.1, β = 0.25) is also
                                                                                                                                                                                                                                                                                                                        allowable short-
                                                                                                                                                                                                                                                                                                                        and long-term

performed to inspect its impact on the optimization. The re-
                                                                                                                                                                                                                     Maximum

sult is presented in Appendix A4, which shows that the op-
                                                                                                                                                                                                                                                                                                                                                   scenarios
                                                                                                                                                                                                                                                                                                                        shortage

timal strategy is dominated by the shortage constraints and
insensitive to the value of ψ.

https://doi.org/10.5194/hess-25-2063-2021                                                     Hydrol. Earth Syst. Sci., 25, 2063–2087, 2021
2074                     C.-W. Wu et al.: Minimizing the impact of vacating instream storage of a multi-reservoir system

Figure 10. The sedimentation progress of Tsengwen Reservoir with and without empty flushing.

   Figure 10 depicts the historical accumulative sedimenta-                agement. The results reveal the economic superiority of
tion record of Tsengwen Reservoir, as well as the updated                  empty flushing over mechanical excavation, as long as it
progress by imposing the suggested empty flushing events                   does not induce unmanageable water shortage and cre-
and subtracting the generated desilting volume from the ac-                ate additional large-scale suspensions of irrigation.
tual sedimentation. Some features can be observed as fol-
                                                                       3. The hydrological characteristic of the case study sys-
lows.
                                                                          tem allows for empty flushing only feasible in less than
 1. Typhoon Morakot in 2009 represents an outlier and                     40 % of the simulating years. During the other years the
    boosts the average annual sedimentation and inflow-                   reservoir storage is inadequate, i.e., either the storage
    ing sediment by over 2 × 10⁶ m3 yr−1 . The newly con-                 of Wushanto Reservoir is lower than T D or Tsengwen
    structed DST aims for this kind of extreme flood, and it              Reservoir is higher than T U between 11 May to 20 June.
    allows nearly 40 % of sediments of density current and                A trend of increasing frequency of empty flushing in re-
    turbid storage to pass through the reservoir along with               cent years can also be observed in the figure. This might
    the updated PRO. Most of the remaining detained sedi-                 be the result of climate change which increases the vari-
    ments are expected to be removed by the cost-effective                ance of flood magnitude and more frequently lead to
    perennial hydrosuction. Nonetheless, its annual capac-                lower but adequate reservoir storage in the end of dry
    ity has reached a maximum while no convenient down-                   season in the case study area.
    stream deposition area is currently available for further
                                                                       4. Due to the frequency of drought and high pressure of
    expansion.
                                                                          water supply in this system, the optimal strategy asso-
 2. Empty flushing serves as an alternative for more ex-                  ciated with α = 0.1 and β = 0.25 is selected for further
    pensive or uncertain desilting measures, other than hy-               scrutiny. Table 3 displays the simulated events of empty
    draulic sluicing and hydrosuction, to achieve a long-                 flushing based on this calibrated strategy.
    term balance between the incoming and outgoing sedi-
    ment of a reservoir. The estimated net benefits by empty         4.5   Validation of the optimal strategies
    flushing are also included in Table 2. The referred ben-
    efit of flushing is the alternative cost by mechanical ex-       The optimal strategies in Table 2 are derived according to the
    cavation as USD 20 per unit volume (m3 ) of sediment.            records of daily reservoir inflow between 1975 and 2009. In
    The induced cost is from the water transferring fee,             other words, their average performances regarding Eqs. (6),
    USD 0.15 per cubic meter of water, for compensating              (7), and (8) are boosted and customized against the hydrolog-
    the agricultural purpose, and enhancing irrigation man-          ical conditions during this calibration time period. Following

Hydrol. Earth Syst. Sci., 25, 2063–2087, 2021                                         https://doi.org/10.5194/hess-25-2063-2021
Table 3. Simulated empty flushing events based on the optimal strategy with α = 0.1 and β = 0.25.

                                                 Year      Duration           Inflow        Reservoir           Reservoir                Water                      Water             Water shortage       Bottom      Desilting     Average       Down-stream        Total Inflow     Spillage of
                                                           m/dd           volume to         storage at          storage at              shortage                  shortage             ratio during         release     volume       concen-        lateral flow              to T.             T.
                                                                                   T.       initiation         termination             until June                  in July             the next dry        volume       (Mm3 )        tration       during e.f.b        during the          in the
                                                                             (Mm3 )          (Mm3 )               (Mm3 )                                                                season (%)         from T.                     (ppm)             (Mm3 )        wet season      wet season
                                                                                            T.a      W.a          T.       W.     Increment       Ratio     Increment        Ratio    w.o.           w.                                                                     (Mm3 )          (Mm3 )
                                                                                                                                     (Mm3 )        (%)         (Mm3 )         (%)     e.f.b         e.f.    (Mm3 )

https://doi.org/10.5194/hess-25-2063-2021
                                                 1979      6/10                25.03     11.60     69.10      21.06     69.07            0.00       0.00          0.00        0.00    17.0        17.0       11.12           0.40      36 291                7.67             1109          155.80
                                                 1984      5/13–5/14            2.21       0.00    78.53       0.00     72.97            0.00       0.00          0.00        0.00    45.0        49.0        2.21           0.04      18 194                1.32              676                 –
                                                           5/21–5/31          121.55       0.00    70.26      42.68     62.45                                                                                65.27           1.26      19 344               30.51
                                                 1986      5/21–5/29           91.44     11.61     71.93       8.31     64.96            0.00       0.00          0.00        0.00    12.0        25.0       77.50           2.63      33 909               18.31              843                 –
                                                 1989      5/14–5/15            1.78       0.00    78.83       0.00     73.24            0.00    10.00            0.00     41.00c       1.0         1.0        1.78          0.03      17 010                0.35             1006          121.60
                                                 1997      6/07–6/10           31.99       5.58    71.08       0.00     64.45            0.00       0.00          0.00        0.00      5.0         5.0      33.25           1.11      33 381                2.84              941           23.51
                                                 2006      5/25–6/05          127.63       6.71    72.66      25.62     62.40            0.00       0.00          0.00        0.00    20.0        21.0       86.26           2.43      28 115               17.06             1657          503.86
                                                 2008      6/09–6/10            7.59     28.72     68.54      51.22     64.41            0.00       0.00          8.71        7.00      1.0         2.0      22.28           0.81      36 311                1.22             1930          858.88
                                                 2009      5/11–5/12            1.36       0.00    77.86       0.00     72.24            0.28       2.00          0.00     41.00c     28.0        28.0         1.36          0.02      18 001                0.03             1554          744.37
                                                 2010      6/04–6/08           11.61     21.02     69.74       0.00     58.70            0.00       0.00          7.53       18.00      2.0         4.0      23.85           0.74      30 992                0.53              927                 –
                                                 2013      5/11                 1.47       0.00    75.56       0.00     72.81            0.00       0.00          0.00        0.00    20.0        20.0         1.47          0.03      19 767                0.63             1347          402.24
                                                 2014      5/21–5/31           64.37     19.91     70.71       0.00     58.72            0.00       0.00         23.04       21.00    47.0        54.0       66.59           2.12      31 906                6.52              683                 –
                                                           6/06                 6.85     23.25     68.86      14.45     67.09            0.00       0.00                                                     11.19           0.41      36 351
                                                a T. and W. represent Tsengwen and Wushanto reservoirs, respectively.
                                                b e.f. is the abbreviation of empty flushing.
                                                c The monthly shortage ratio in July following the empty flushing operations in 1989 and 2009 both reach 0.41. However, the corresponding shortage increments are both 0; therefore, they did not violate the constraints of Eqs. (7) and
                                                (8). For these events, the Tsengwen Reservoir is nearly empty and the Wushanto Reservoir is nearly full before the initiation of empty flushing operations. Thus, the empty flushing operations only consume the inflow of Tsengwen
                                                Reservoir during a 2 d period. These water consumption volumes are too insignificant to induce the subsequent water shortage seen in July. The primary reason for the subsequent shortage is the delayed arrival of the first typhoon in
                                                late July or early August, by which time the total storage falls below the critical limit of the joint operating rule curves and water rationing is applied. Following the arrival of the typhoons, however, the total reservoir storage exceeds
                                                                                                                                                                                                                                                                                                       C.-W. Wu et al.: Minimizing the impact of vacating instream storage of a multi-reservoir system

                                                the lower limit and even the upper limit of rule curves, thereby alleviating the water shortage.

Hydrol. Earth Syst. Sci., 25, 2063–2087, 2021
                                                                                                                                                                                                                                                                                                       2075
2076                     C.-W. Wu et al.: Minimizing the impact of vacating instream storage of a multi-reservoir system

which, the records through the end of 2018 are used to verify
the effectiveness of the established strategy. The validation
tests the strategy with inflow series outside of the calibration
time frame to check its validity for general conditions. The
results indicate that four additional flushing operations could
have been conducted, two of which occur in 2010 and 2013
and the others in 2014. The last four rows in Table 3 sum-
marize these events. In addition to the case of 2013 which
imposes no impact on water supply, the empty flushing oper-
ations in the other years are depicted in Figs. 11 and 12 and
discussed below.
 1. Following the empty flushing in early June of 2010, the
    monthly water shortage ratio during July is 0.18, which
    is higher than the 0.12 that would have been the case
    without empty flushing. The increased shortage ratio is
    induced by drawdown and empty flushing, which causes
    the total storage to fall below the critical limit of rule
    curve earlier in July. Empty flushing thus necessitates a
    slightly longer water rationing period. Nonetheless, tor-      Figure 11. Reservoir inflow and storage throughout 2010.
    rential rains in late July elevate the storage to exceed
    the lower limit, thereby resolving the shortage crisis.
    The major impact of water shortage during this period
    is on the second semiannual irrigation operation, which
    requires large quantities of water during July. One of
    the adopted mitigation measures is to postpone the be-
    ginning of irrigation schedule no later than 10 August.
    For example, in June of 2004, the total storage in the
    two reservoirs fell below the critical limit, which de-
    layed the second semiannual irrigation from the origi-
    nally planned 6 June to 17 July when Typhoon Mindulle
    invaded and elevated the storage above the upper limit
    in one single day of early July.
 2. In 2014, over 40 % of the wet season inflow of Tseng-
    wen Reservoir occurred in May and June, which means
    the front-induced inflow in the early flood season is
    abundant, and only one typhoon invaded Taiwan for the
    remaining 5 months. The unexpected lack of subsequent
    floods leads to partial recovery of reservoir storage. The
    impact is alleviated through water rationing during the        Figure 12. Reservoir inflow and storage throughout 2014.
    wet season to allow for carrying out the second semian-
    nual irrigation. For the following, drought occurred in
    the dry season in 2015, and it inevitably leads to large-           shortage induced by empty flushing for this particular
    scale suspension of the first semiannual irrigation to re-          situation will be completely offset in reality.
    duce the agricultural demand to nearly 0, whether empty
    flushing in the previous year is performed or not. With
    or without empty flushing, the water originally supplied       5   The impacts on downstream environment and
    to the first semiannual irrigation, the volume of which            potential extensions of the proposed method
    ranges between 0.2 × 10⁹ and 0.3 × 10⁹ m3 , will be kept
    to secure public water supply. The annual demand of            In addition to induce incremental water shortage, potential
    public and industrial purposes of this system is only          adverse impacts on the downstream environment may appear
    0.147 × 10⁹ m3 , and every empty flushing practice con-        due to flushing. They originate from the high sediment con-
    sumes a water volume of no more than 0.09 × 10⁹ m3             centration of flushing release in the absence of a simultane-
    according to Table 3. The demand magnitude and water           ous downstream flood, which may significantly reduce dis-
    transfer mechanism guarantee that the risk of increased        solved oxygen in the river, smother stream benthos, and clog

Hydrol. Earth Syst. Sci., 25, 2063–2087, 2021                                       https://doi.org/10.5194/hess-25-2063-2021
C.-W. Wu et al.: Minimizing the impact of vacating instream storage of a multi-reservoir system                           2077

gravels, thus endangering spawn sites and habitat, impair-        3. The spillway release during typhoon is expected to
ing river functions such as flood conveyance, navigation, or         flush out the artificially deposited sediments as well
recreation, etc. (Morris, 2014). Some measures to minimize           as the soil dikes in the downstream river reach to al-
these impacts by carefully determining the timing, duration,         low for continuation of hydrosuction. The required vol-
and frequency of flushing and controlling the releasing dis-         ume from the reservoir release to vacate downstream
charge and concentration can be found in Morris (2014),              depositions and soil dikes is estimated at 40 × 106 m3
Moridi and Yazdi (2017), Espa et al. (2019), and Cattanéo            (900 m3 s−1 times 12 h) based on field experience. It is
et al. (2021).                                                       expected that the sediments from empty flushing can be
   The theme of this paper, to secure water supply while en-         partially detained in the depositing area and then car-
hancing desilting, acts similarly as mitigating environmental        ried downstream along with the dredging depositions by
impacts, since they both need to restrain the effectiveness of       the subsequent reservoir spillage. The impact by empty
empty flushing. The conjunctions include the following:              flushing is thus limited within the already existed depo-
                                                                     sition area.
 1. Meeting WS1F and FS1Q suggests that the flush-
    ing periods coincide with the first flood of wet sea-         4. From Table 3, either the bottom release during empty
    son, while subsequent typhoon-induced floods satisfy             flushing or the spillage during the rest of the year in al-
    WS2A. These conditions prompt adequate water during              most every identified event exceeds 40×106 m3 to effec-
    and following flushing for dilution and transportation of        tively transport downstream depositions. The only two
    sediments downstream.                                            exceptions are the events of 1997 and 2010. To man-
                                                                     age these years, the reservoir may need to deliberately
 2. The second termination condition in Sect. 3.2.4 allows           release water before the end of the wet season to vacate
    for empty flushing until the inflow recedes below the ca-        downstream depositions. This will increase the shortage
    pacity of PRO. The release during the recession limb of          situation in the dry season of next year by 40 × 106 m3 ,
    flood inflow with lower concentration and higher WSL             which is about 10 % of the first semiannual irrigation
    of reservoir partially offsets the impact immediately fol-       demand. For these 2 years, this shortage increment can
    lowing the empty flushing.                                       still be managed by regular water saving measures with-
 3. The strict requirement on the stability of water supply          out inducing suspension of irrigation.
    leads to a higher T d for the third termination condi-          Some suggestions for future extension of the current study
    tion, which is the threshold backup storage to stop an       are provided below:
    empty flushing operation. In the absence of a flood,
    this induces an earlier termination and increases the op-     1. To incorporate short-term forecasting of reservoir in-
    portunities for re-activation of another flushing opera-         flow in determining the activation or termination of an
    tion. This results in more frequent flushing with shorter        empty flushing operation. If the forecast is reliable, a
    duration, which is considered more favorable to miti-            certain amount of storage can be kept in the primary
    gate downstream impacts (Morris, 2014; Sumi and Kan-             reservoir and pre-emptied shortly before an expected
    toush, 2010; Crosa et al., 2010).                                flood. The forecast uncertainty should be incorporated
                                                                     to avoid inducing intolerable water shortage in case the
  Some characteristics of the case study area to temper the          flood does not occur after emptying the reservoir.
impact on environment include the following:
                                                                  2. To test the established rules with synthetically gener-
 1. The capacity of PRO of the Tsengwen Reservoir when               ated hydrological series containing more years with un-
    the storage is nearly empty is around 130 m3 s−1 . This          expected lacks of floods. This would allow for a more
    flushing discharge is relatively insignificant compared          comprehensive evaluation of the potential risk of water
    to the magnitudes of spillway releases and downstream            shortage especially under the impact of climate change.
    lateral flow during a moderate flood.                            To facilitate this extension, the correlation across daily
                                                                     inflows of different sites in a multi-reservoir system
 2. The downstream major benthos species of interest is              should be properly modeled to correctly represent the
    Sinogastromyzon nantaiensis (Chen et al., 2002), with            temporal and spatial stochastic hydrological nature.
    spawning season from June to September and habita-
    tion site within the first downstream reach from the          3. The case study specifically discusses a system with an
    Tsengwen Dam. The empty flushing is limited before               upstream online reservoir requiring empty flushing and
    mid-June to minimize the concurrence periods of the              a downstream offline reservoir which provides backup
    spawning season. The river reach has a moderate slope            water supply. Implementations for other systems with
    of 0.0036 and short distance of 20.5 km. These prompt            different schematics may require more complex opti-
    transportation of sediments by the typhoon-induced               mization formulations with additional parameters. For
    reservoir spillage.                                              example, if an additional reservoir is available upstream

https://doi.org/10.5194/hess-25-2063-2021                                    Hydrol. Earth Syst. Sci., 25, 2063–2087, 2021
You can also read