Mutant Huntingtin Is Cleared from the Brain via Active Mechanisms in Huntington Disease
←
→
Page content transcription
If your browser does not render page correctly, please read the page content below
780 • The Journal of Neuroscience, January 27, 2021 • 41(4):780–796

Neurobiology of Disease

Mutant Huntingtin Is Cleared from the Brain via Active
Mechanisms in Huntington Disease
Nicholas S. Caron,1 Raul Banos,2 Christopher Yanick,2 Amirah E. Aly,1 Lauren M. Byrne,3 Ethan D. Smith,2
Yuanyun Xie,2 Stephen E.P. Smith,4 Nalini Potluri,2 Hailey Findlay Black,1 Lorenzo Casal,5 Seunghyun Ko,5
Daphne Cheung,5 Hyeongju Kim,6 Ihn Sik Seong,7 Edward J. Wild,3 Ji-Joon Song,6 Michael R. Hayden,1† and
Amber L. Southwell2†
1
  Centre for Molecular Medicine and Therapeutics, British Columbia Children’s Hospital Research Institute, Department of Medical
Genetics, University of British Columbia, Vancouver, British Columbia V5Z 4H4, Canada, 2Burnett School of Biomedical Sciences,
University of Central Florida, Orlando, Florida 32828, 3UCL Huntington’s Disease Centre, UCL Queen Square Institute of Neurology,
University College London, London, WC1N 3BG, United Kingdom, 4Seattle Children’s Research Institute, Center for Integrative Brain
Research, Seattle, Washington 98101, 5Centre for Molecular Medicine and Therapeutics, Vancouver, British Columbia V5Z 4H4, Canada,
6
  Department of Biological Sciences, KAIST, Daejeon, Korea, 34141, and 7Department of Neurology, Massachusetts General Hospital, Boston,
Massachusetts 02114

Huntington disease (HD) is a neurodegenerative disease caused by a CAG trinucleotide repeat expansion in the hun-
tingtin (HTT) gene. Therapeutics that lower HTT have shown preclinical promise and are being evaluated in clinical
trials. However, clinical assessment of brain HTT lowering presents challenges. We have reported that mutant HTT
(mHTT) in the CSF of HD patients correlates with clinical measures, including disease burden as well as motor and
cognitive performance. We have also shown that lowering HTT in the brains of HD mice results in correlative reduc-
tion of mHTT in the CSF, prompting the use of this measure as an exploratory marker of target engagement in clini-
cal trials. In this study, we investigate the mechanisms of mHTT clearance from the brain in adult mice of both
sexes to elucidate the significance of therapy-induced CSF mHTT changes. We demonstrate that, although neurode-
generation increases CSF mHTT concentrations, mHTT is also present in the CSF of mice in the absence of neurode-
generation. Importantly, we show that secretion of mHTT from cells in the CNS followed by glymphatic clearance
from the extracellular space contributes to mHTT in the CSF. Furthermore, we observe secretion of wild type HTT
from healthy control neurons, suggesting that HTT secretion is a normal process occurring in the absence of patho-
genesis. Overall, our data support both passive release and active clearance of mHTT into CSF, suggesting that its
treatment-induced changes may represent a combination of target engagement and preservation of neurons.
Key words: biomarker; cerebrospinal fluid; glymphatic system; Huntington disease; neurodegeneration; protein
secretion

        Significance Statement:
        Changes in CSF mutant huntingtin (mHTT) are being used as an exploratory endpoint in HTT lowering clinical trials for the
        treatment of Huntington disease (HD). Recently, it was demonstrated that intrathecal administration of a HTT lowering agent
        leads to dose-dependent reduction of CSF mHTT in HD patients. However, little is known about how HTT, an intracellular
        protein, reaches the extracellular space and ultimately the CSF. Our findings that HTT enters CSF by both passive release and
        active secretion followed by glymphatic clearance may have significant implications for interpretation of treatment-induced
        changes of CSF mHTT in clinical trials for HD.

Received July 16, 2020; revised Nov. 17, 2020; accepted Nov. 25, 2020.
                                                                                                                               E.J.W. has participated in consultancy or advisory boards for Hoffman La Roche Ltd, Triplet Therapeutics, PTC
   Author contributions: N.S.C., E.D.S., Y.X., S.E.P.S., N.P., E.J.W., M.R.H., and A.L.S. designed research; N.S.C.,
                                                                                                                            Therapeutics, Shire Therapeutics, Wave Life Sciences, Mitoconix, Takeda, and Loqus23. All honoraria for these
R.B., C.Y., A.E.A., L.M.B., H.F.B., L.C., S.K., D.C., H.K., I.S.S., J.-J.S., and A.L.S. performed research; N.S.C., R.B.,   engagements were paid through the offices of UCL Consultants Ltd, a wholly owned subsidiary of University College,
C.Y., A.E.A., E.D.S., Y.X., S.E.P.S., N.P., and A.L.S. analyzed data; N.S.C., A.E.A., L.M.B., E.J.W., M.R.H., and           London. M.R.H. currently serves on the public boards of Ionis Pharmaceuticals, Xenon Pharmaceuticals, Aurinia
A.L.S. edited the paper; N.S.C. and A.L.S. wrote the paper.                                                                 Pharmaceuticals, and 89bio. The remaining authors declare no competing financial interests. M.R.H. currently serves on
    †
    M.R.H. and A.L.S. contributed equally to this work as co-senior authors.                                                the public boards of Ionis Pharmaceuticals, Xenon Pharmaceuticals, Aurinia Pharmaceuticals, AbCellera and 89bio.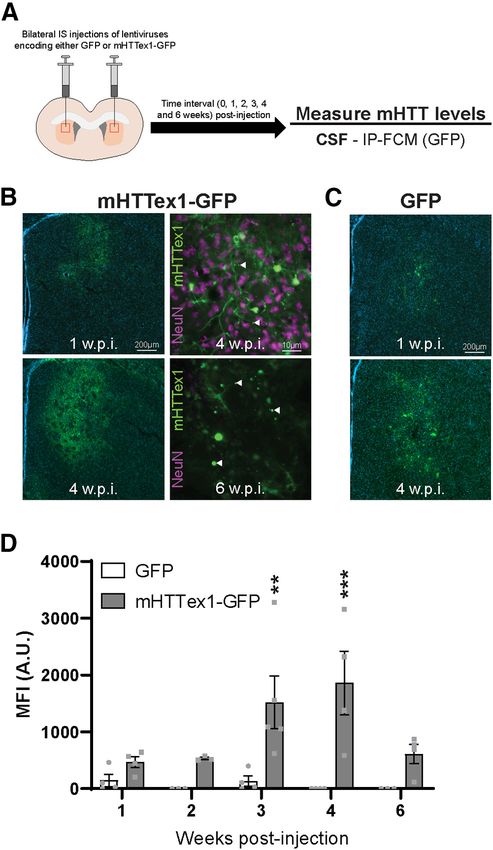
Caron et al. · Clearance of Huntingtin from the Brain to the CSF                                                                                J. Neurosci., January 27, 2021 • 41(4):780–796 • 781

Introduction                                                                                                   (Constantinescu et al., 2009, 2011; Wild et al., 2015; Rodrigues
Huntington disease (HD) is a fatal neurodegenerative disease                                                   et al., 2016; Byrne et al., 2017, 2018). Furthermore, we have
caused by a polyglutamine encoding CAG repeat expansion                                                        previously shown that inducing acute brain injury in mice
in the HTT gene (1993). The resulting mutant huntingtin                                                        with quinolinic acid (QA) causes a transient increase in
(mHTT) protein disrupts many cellular processes, ultimately                                                    CSF mHTT during the period of neuron injury or death
leading to neurodegeneration (for review, see Caron et al.,                                                    (Southwell et al., 2015). Together, these data suggest that
2018). Numerous preclinical studies have demonstrated that                                                     CSF mHTT originates from passive release from dying cells.
lowering HTT in the brain can prevent or even reverse HD-                                                          In addition to passive release, there is evidence that soluble
like behavioral and neuropathological phenotypes in rodent                                                     and aggregated mHTT may be actively transferred from cells of
models of HD (Harper et al., 2005; Rodriguez-Lebron et al.,                                                    origin through synaptic vesicle exocytosis (Pecho-Vrieseling et
2005; Wang et al., 2005; Machida et al., 2006; DiFiglia et al.,                                                al., 2014; Babcock and Ganetzky, 2015), nanotubes (Costanzo et
2007; Franich et al., 2008; Kordasiewicz et al., 2012; Stanek et                                               al., 2013), and extracellular vesicles/exosomes (Jeon et al., 2016;
al., 2013, 2014; Southwell et al., 2018; Caron et al., 2020),                                                  Zhang et al., 2016) into neighboring cells. However, these inter-
leading to advancement of HTT lowering agents into clinical tri-                                               cellular transfer mechanisms do not explain extracellular release.
als for the treatment of HD (NCT03761849, NCT03225833,                                                         Recently, it was shown that HTT can be secreted from primary
NCT03225846, NCT04120493). Clinical translation of HTT low-                                                    neurons and mouse striatal-like cells via a late endosomal/lysoso-
ering therapies has necessitated the identification of biomarkers                                              mal (LE/Lys) unconventional secretory pathway (Trajkovic et al.,
to assess HTT target engagement in the CNS.                                                                    2017). Active secretion, therefore, provides an alternate mecha-
    We have previously developed assays to measure mHTT in                                                     nism for extracellular release of HTT. However, an additional
the CSF (Southwell et al., 2015; Wild et al., 2015) and demon-                                                 mechanism would then be required to move interstitial HTT
strated that lowering mHTT in the CNS of HD mice is reflected                                                  into the CSF.
by a correlative decrease in CSF mHTT (Southwell et al., 2015).                                                    The glymphatic system is a waste clearance mechanism that
Consequently, a dose-dependent reduction of CSF mHTT fol-                                                      removes extracellular solutes from the brain (Iliff et al., 2012).
lowing treatment with an antisense oligonucleotide (ASO) tar-                                                  This system relies on aquaporin-4 (AQP4) water channels local-
geting HTT provided evidence for HTT target engagement in                                                      ized at astrocyte perivascular endfeet to facilitate the bulk flow of
the first human trial of a HTT lowering therapy (Tabrizi et al.,                                               CSF through the brain parenchyma allowing clearance of inter-
2019). We have also demonstrated that CNS cells derived from                                                   stitial fluids and solutes (Iliff et al., 2012). Therefore, extracellular
nestin-expressing neural progenitors are a major source of                                                     mHTT may exit the brain extracellular space through glymphatic
mHTT in the CSF (Southwell et al., 2015). However, little is                                                   clearance.
known about the mechanisms by which this purported intracel-                                                       In this study, we have used multiple complementary in vitro
lular protein enters the extracellular space and ultimately the                                                and in vivo model systems in conjunction with inhibitors of LE/
CSF. Understanding this process will be necessary for accurate                                                 Lys-mediated secretion and glymphatic clearance to explore
interpretation of therapy-induced changes in CSF mHTT and its                                                  these active mechanisms in the clearance of HTT from the brain
application as a biomarker.                                                                                    to the CSF. We show that, although neurodegeneration leads to
    Inclusion bodies of aggregated mHTT are present both intra-                                                increased mHTT in CSF, it is also released to the CSF in the ab-
cellularly (DiFiglia et al., 1997) and in the extracellular space of                                           sence of neurodegeneration. We demonstrate that HTT is
postmortem HD brain tissue (Cicchetti et al., 2014). One possible                                              secreted from healthy and HTT CAG expanded neurons in vitro,
mechanism of extracellular mHTT deposition is passive release                                                  and that cellular secretion contributes to CSF mHTT in the CNS
from degenerating and dying cells over disease progression. This                                               of HD model mice. Finally, we show that extracellular mHTT in
is supported by the findings that CSF mHTT concentration                                                       the CNS is cleared to the CSF by the glymphatic system. These
increases with disease stage and correlates with motor and cogni-                                              findings may be helpful for the interpretation of clinical CSF
tive symptom severity (Southwell et al., 2015; Wild et al., 2015)                                              HTT lowering data and support a combinatorial biomarker strat-
as well as CSF concentrations of tau and neurofilament light                                                   egy for accurate assessment of CNS HTT target engagement.
chain (NfL), which are associated with neurodegeneration
                                                                                                               Materials and Methods
                                                                                                                    Animals. Experiments were performed using Hu97/18 (Southwell et
   N.S.C. was supported by Canadian Institutes of Health Research (CIHR) Postdoctoral Fellowship, James
                                                                                                               al., 2013), YAC128 (Slow et al., 2003), YAC128 C6R (Graham et al.,
Family Fellowship, and Huntington’s Disease Society of America (HDSA) Berman/Topper HD Career
                                                                                                               2006), and control littermate mice of either sex. Animals were main-
Development Fellowship. A.E.A. was supported by British Columbia Children’s Hospital Research Institute
Mining for Miracles Postdoctoral Fellowship, and Michael Smith Foundation for Health Research Research         tained under a 12 h light:12 h dark cycle in a clean barrier facility and
Trainee Award. L.M.B. was supported by HDSA Berman/Topper HD Career Development Fellowship. H.F.B. was         given free access to food and water. Experiments were performed with
supported by CIHR CGS-M scholarship and British Columbia Children’s Hospital Research Institute Graduate       the approval of the Animal Care Committee at the University of British
Scholarship. E.J.W. was supported by CHDI Foundation, Medical Research Council UK MR/M008592/1, and            Columbia (A16-0130, A20-0107) and Institute Animal Care and Use
Hoffman La Roche academic research grant. J.-J.S. was supported by National Research Foundation of Korea       Committee at the University of Central Florida (17-35, 17-32, 18-13).
2016K1A1A2912057. Project operational support was provided by CIHR Foundation Grant FDN-154278 and                  CSF collection. Mice were anesthetized with Avertin (2,2,2-tribro-
Bev Hartig Huntington’s Disease Foundation to M.R.H. Project operational support was provided by the HDSA      moethanol, Sigma Millipore, catalog #T48402) and secured in a stereo-
and National Institute of Neurological Disorders and Stroke, National Institutes of Health R01NS116099 to
                                                                                                               taxic frame (Stoelting). The ear bars were raised and the nose piece used
A.L.S. We thank Anita Fazeli, Alicia Willenberg, Katlin Hencak, Casey Hart, Mark Wang, Qingwen Xia, and
Benjamin Gordon for technical assistance and support; Katarina Trajkovic for discussion and support; Paul H.
                                                                                                               to position the mice in a manner that would allow for a near 90° tilt of
Patterson and the Developmental Studies Hybridoma Bank at the University of Iowa for the MW1 antibody;         the head to access the cisterna magna. A 1 cm2 section of dorsal neck
Barbara Slusher and Camillo Rojas for providing PDDC; Dagmar Ehrnhoefer for the adaptation of the TR-FRET      skin was removed, and muscle layers were completely dissected away to
assay with BKP1; and Ali Khoshnan for providing the lentiviral genome.                                         expose the cisterna magna, which was then cleaned and dried. A 50 ml
  Correspondence should be addressed to Amber L. Southwell at amber.southwell@ucf.edu or Michael R.            Hamilton syringe with point style 2 with a 12° bevel was then lowered
Hayden at mrh@cmmt.ubc.ca.                                                                                     carefully into the cisterna magna ensuring the entire needle opening was
   https://doi.org/10.1523/JNEUROSCI.1865-20.2020                                                              inserted. CSF was slowly withdrawn at a rate of 10 ml/minute (min) using
Copyright © 2021 the authors                                                                                   an UltraMicroPump with Micro4 controller (World Precision Instruments).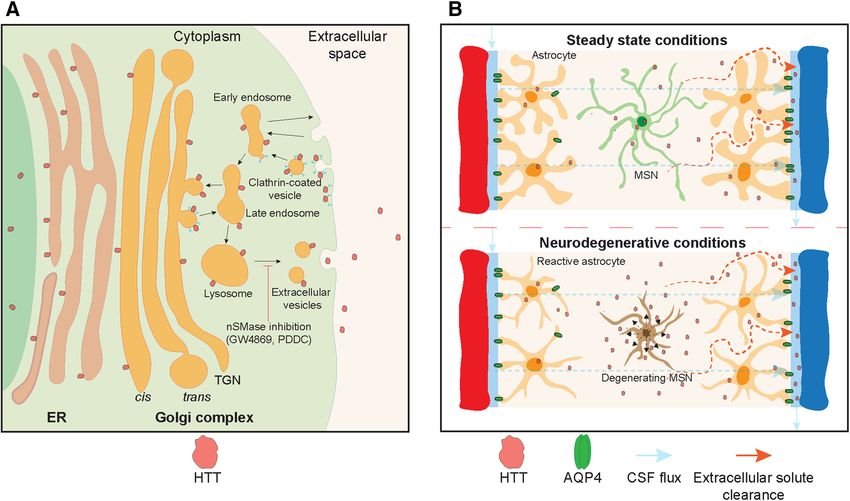
782 • J. Neurosci., January 27, 2021 • 41(4):780–796                                                        Caron et al. · Clearance of Huntingtin from the Brain to the CSF

CSF samples were collected in prechilled tubes, centrifuged, then flash frozen       Primary Hu97/18 and Hu18/18 forebrain astrocytes were cultured as
in liquid N2 before storage at 80°C.                                             previously described (Ehrnhoefer et al., 2018a). Briefly, postnatal day 0-1
     Tissue collection and processing. Mice allotted for terminal molecular      pups were anesthetized by hypothermia, and brains were placed into
and biochemical analysis were anesthetized using Avertin, and CSF was            Hibernate-E during genotyping as above. Hu97/18 or Hu18/18 com-
collected into prechilled tubes as described above. Whole blood was then         bined cortical and striatal tissue was triturated to a single-cell suspension
collected by cardiac puncture and placed into prechilled EDTA-coated             in DMEM high glucose (Invitrogen, catalog #11965092) containing 10%
tubes (Sarstedt, catalog #41.1395.105) on ice. Whole blood was then cen-         FBS, 100 U/ml penicillin-streptomycin, and 0.5 mM GlutaMax and
trifuged at 4000 RCF for 10 min at 4°C, and plasma was removed, flash            seeded in a T75 flask. Media was changed 24 h later with remaining
frozen in liquid N2, and stored at 80°C until use. Brains were removed           media exchanges occurring every 7 d. Once 90% confluence was reached,
and placed on ice for ;1 min to increase tissue rigidity. Brains were then       astrocyte cultures were purified by removing the loosely adherent top
microdissected into different regions (striatum, cortex, hippocampus,            cell layers consisting mostly of oligodendrocytes and microglia. Cell
cerebellum), flash frozen in liquid N2, and stored at 80°C until use.            morphology was observed to ensure that astrocytes were intact and free
Peripheral tissues were also collected, flash frozen in liquid N2, and           of contaminating cells before media aspiration and a wash with cold
stored at 80°C until use.                                                        PBS. Astrocytes were then passaged and grown to 90%-95% confluence.
     Mice allotted for histology were perfused transcardially with PBS and       Astrocytes were then triturated to a single-cell suspension in complete
4% PFA. Brains were removed and postfixed in 4% PFA in PBS for 24 h              DMEM media and seeded in poly-D-lysine-coated 10 cm dishes at a
at 4°C. The following day, brains were cryoprotected in 30% sucrose              density of 1  106 cells per plate. Media was changed 24 h later with
with 0.01% sodium azide. Once equilibrated, brains were divided into             remaining media exchanges occurring every 7 d until 100% confluence
forebrain and cerebellum, and forebrains were frozen on dry ice,                 was reached.
mounted in Tissue-TEK OCT embedding compound (Sakura), and cut                       In vitro secretion studies. DIV 7 neurons and mature confluent astro-
via cryostat (Leica Microsystems, CM3050S) into a series of 25 mm coro-          cytes were used for secretion experiments. A full media change was per-
nal sections free-floating in PBS with 0.01% sodium azide.                       formed to remove any proteins secreted during the culture period, and
     Lentivirus study. Lentiviruses encoding either GFP or mHTT exon 1           cells were treated with DMSO, 5 mM GW4869, or 100 mM phenyl(R)-(1-
with 103 glutamines (Qs) with 103 glutamines (Qs) and a C-terminal               (3-(3,4-dimethoxyphenyl)-2,6-dimethylimidazo[1,2-b]pyridazin-8-
GFP tag (Southwell et al., 2009) were packaged at high titer by Applied          yl)pyrrolidin-3-yl)-carbamate (PDDC; generous gift from Drs. Barbara
Biological Materials. Intrastriatal (IS) lentivirus injections were per-         Slusher and Camillo Rojas) in growth media. After 16 h of treatment,
formed as described previously (Southwell et al., 2009) with the follow-         media was collected and centrifuged to eliminate cell debris, then con-
ing changes. Briefly, mice were anesthetized with isoflurane and secured         centrated through an ultracentrifugation column with a 10 kDa weight
into a stereotaxic frame. The scalp was shaved, sterilized with betaine          cutoff (Amicon Ultra-0.5 Centrifugal Filter Unit, Millipore, catalog
and 70% ethanol, and an incision made along the midline. The skull was           #UFC501096) for 20 min at 14,000 RCF. Additionally, for astrocyte cul-
dried to enhance visibility of sutures and landmarks. A dental drill was         tures, HTT was immunoprecipitated from culture media using
used to make bilateral burr holes at 0.8 mm anterior and 1.8 mm lateral          HDB4E10 anti-HTT antibody (Bio-Rad, catalog #MCA2050) bound to
to bregma. A Hamilton syringe with a 30 gauge needle was loaded first
                                                                                 magnetic protein G Dynabeads (Invitrogen, catalog #10004D). Cells
with 3 ml of sterile saline and then with 2 ml of either virus diluted to
                                                                                 were collected by scraping in cold PBS and pelleted by centrifugation for
1E 1 06 IU/ml titer in sterile saline. The needle was lowered to 3.5 mm
                                                                                 5 min at 650 RCF. Cell pellets and concentrated or immunoprecipitated
below the surface through the burr hole and the virus injected at 0.5 ml/
                                                                                 media were then analyzed by Western blotting as described below.
min using an UltraMicroPump with Micro4 controller. The needle was
left in place for 5 min and then withdrawn slowly. This process was                  In vivo secretion studies. Mice received daily intraperitoneal injec-
repeated for the other hemisphere. Biofluids and perfused brains were            tions of 10 mg/kg PDDC dissolved 5% w/v in DMSO (Sigma Millipore,
collected at different postinjection time points for immunoprecipitation         catalog #D2650) and diluted in saline for 5 consecutive days. For the
followed by flow cytometry (IP-FCM) and immunohistochemical (IHC)                study of secretion in neurotoxic conditions, animals received instrastria-
analysis, respectively.                                                          tal QA or PBS injections as described above after 2 d of treatment. CSF,
     CAG repeat sizing. Genomic DNA was extracted and purified from              plasma, and forebrain hemispheres were collected as above 6 h after
mouse tail clippings using the DNeasy Blood & Tissue Kit (QIAGEN,                injection on the final treatment day.
catalog #69504). DNA was sent to Laragen for CAG trinucleotide repeat                Purification of recombinant HTT proteins. Full-length (FL) HTT
sizing of human HTT.                                                             cDNAs were cloned into pFastBac1 vector (Invitrogen, catalog #10360014)
     IS QA injection. IS QA injections were performed as previously              containing an N-terminal FLAG tag followed by a TEV protease site
described (Southwell et al., 2015). Briefly, mice were anesthetized with         and His tag. Recombinant FL HTT proteins (Q2, Q23, Q43, Q67, and
150 mg/kg ketamine and 10 mg/kg xylazine and secured into a stereo-              Q78) were expressed in Sf9 cells using a Baculovirus protein expression
taxic frame. Preparation of the scalp and incision were performed as             system (Invitrogen). Cell pellets were resuspended in Buffer A (50 mM
above, and a unilateral burr hole was made at 0.8 mm anterior and 1.8            Tris-HCl, pH 8.0, 100 mM NaCl, protease inhibitor cocktail, Roche
mm lateral to bregma. A Hamilton syringe with a 26 gauge needle loaded           Diagnostics, catalog #11697498001, 5% glycerol) and lysed by repeated
with 2 ml of QA at 25 nM was lowered to a depth of 3.5 mm through the            freeze-thaw cycles. The cell lysate was cleared by centrifugation at
burr hole, and the QA was injected at 0.5 ml/min using a micropump.              39,000  g for 2 h. The supernatant was incubated with M2 anti-FLAG
The needle was left in place for 5 min and then withdrawn slowly.                beads (Sigma Millipore), and nonspecifically bound proteins were
     Primary cell culture. Primary Hu97/18 and Hu18/18 forebrain neu-            removed by washing with Buffer A. HTT proteins were then eluted
rons were established as previously described (Skotte et al., 2014).             with Buffer A containing 0.4 mg/ml FLAG peptide. The N-terminal
Briefly, embryonic brains were isolated at embryonic day 15.5-17.5 and           FLAG tag was then removed with TEV protease in Buffer B (150 mM
placed into Hibernate-E medium (Invitrogen, catalog #A1247601) con-              NaCl, 50 mM Tris-HCl, pH 8.0, 5% glycerol, 20 mM imidazole, 1 mM
taining 0.5 mM GlutaMAX (Invitrogen, catalog #35050061) and 2% SM1               DTT, and 0.5 mM EDTA) for 16 h at 4°C. HTT proteins were further
supplement (Stemcell Technologies, catalog #05711) at 4°C overnight to           purified by Superdex200 26/60 columns (GE Healthcare) in a running
allow time for genotyping (Skotte et al., 2014). Hu97/18 or Hu18/18              buffer (150 mM NaCl, 20 mM HEPES-HCl, pH 7.5). Protein integrity
combined cortical and striatal tissues were triturated to a single-cell sus-     and Q-length were validated by PAGE separation and Coomassie stain-
pension in Neurobasal Complete Medium (Neurobasal Medium,                        ing before use.
Invitrogen, catalog #21103049)) containing 100 U/ml penicillin-strepto-              Recombinant huntingtin injections. For IS injections, mice were
mycin (Invitrogen, catalog #15140163), 0.5 mM GlutaMAX, and 2% SM1               anesthetized with isoflurane and secured into a stereotaxic frame.
supplement and seeded in poly-D-lysine (Sigma Millipore, catalog                 Preparation of the scalp and incision were performed as above, and a
#P7886) coated 24-well plates at a density of 2.5  105 cells per well.          unilateral burr hole was made at 0.8 mm anterior and 1.8 mm lateral to
Cells were fed 1/10th well volume of fresh Neurobasal Complete                   bregma. A Hamilton syringe with a 30 gauge needle was loaded with
Medium every 3-4 d until day in vitro (DIV) 7.                                   500 ng of recombinant FL mHTT Q67 (Seong et al., 2010) diluted to a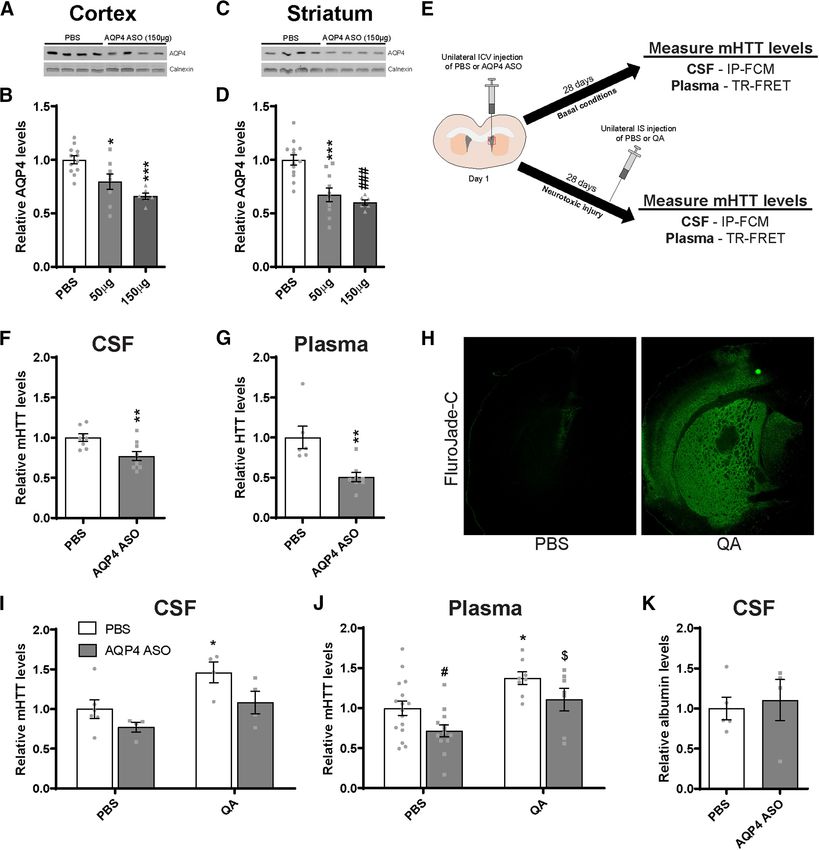
Caron et al. · Clearance of Huntingtin from the Brain to the CSF                                               J. Neurosci., January 27, 2021 • 41(4):780–796 • 783

total volume of 1 ml in sterile PBS. The needle was lowered to 3.5 mm        the media of secretion inhibitor-treated cells were normalized to the
below the surface through the burr hole, and the protein was injected at     mean intensity from the same allele of HTT in the media of vehicle-
0.2 ml/min. The needle was left in place for 5 min after injection and       treated cells on the same membrane. Recombinant FL HTT band
then withdrawn slowly. For intracerebroventricular (ICV) injections,         intensities were normalized to the calnexin loading control and then to
500 ng of recombinant FL mHTT Q67 (Seong et al., 2010) was diluted to        the mean of the 0.5 h time point signal on the same membrane. For
a total volume of 10 ml in sterile PBS and administered as in Southwell et   AQP4 quantification, 100 mg of total protein was resolved on 12% BIS
al. (2014). Briefly, mice were anesthetized with isoflurane and secured      acrylamide gels and transferred to 0.2 mm nitrocellulose. Blots were
into a stereotaxic frame. Preparation of the scalp and incision were per-    then cut at 50 kDa, and the top portion was probed with rabbit anti-
formed as above. A Hamilton syringe with 26 gauge needle loaded with         calnexin as a loading control and the bottom portion was probed with
mHTT was used to punch through the skull at 0.3 mm anterior and 1            rabbit anti-AQP4 (Sigma Millipore, catalog #ABN411). Primary anti-
mm lateral to bregma and lowered to 3 mm below the surface. The FL           bodies were detected with AlexaFluor-680 goat anti-rabbit labeled
mHTT Q67 was injected over 10 s and the needle left in place for 2 min       secondary antibody. For albumin, 10 ml of mouse CSF was resolved
before slow withdrawal. For intravenous injections, animals were             on 12% BIS acrylamide gels, transferred to 0.2 mm nitrocellulose,
restrained in a mouse tail illuminator (Bioseb, catalog #MTI). The tail      and probed with rabbit anti-albumin (Sigma Millipore, catalog
was sterilized with 70% ethanol and allowed to warm for 2 min on the il-     #SAB2100099). Primary antibody was detected with IR dye 800CW
luminator to highlight the tail vein. An insulin syringe with a 31 gauge     goat anti-rabbit (Rockland, catalog #611-131-122) labeled secondary
needle (BD Biosciences, catalog #320440) was loaded with 500 ng of           antibody. All blots were scanned using the LiCor Odyssey Infrared
recombinant FL mHTT Q67 diluted to a total volume of 100 ml in sterile       Imaging system. Densitometry on band intensities was performed
PBS and injected into the tail vein as a bolus.                              using the LiCor Image Studio Lite software. HTT band intensities were
    IHC. For evaluation of lentivirus distribution and neuron loss, a se-    normalized to calnexin loading control and then to the same allele for
ries of sections spaced 200 mm apart and spanning the striatum were cos-     vehicle-treated cells or mice on the same membrane. AQP4 band inten-
tained with rabbit anti-GFP antibody (1:1000, Invitrogen, catalog #A-        sities were normalized to the calnexin loading control and then to the
11122) and mouse anti-NeuN (1:1000. Millipore, catalog #MAB377).             mean of PBS-treated mice on the same membrane.
Primary antibodies were detected with goat anti-rabbit AlexaFluor-488            mHTTex1-GFP immunoprecipitation flow cytometry (IP-FCM)
(1:500, Invitrogen, catalog #A-11008) and goat anti-mouse AlexaFluor-        assay screen. An ultrasensitive mHTTex1-GFP IP-FCM assay for
568 (1:500, Invitrogen, catalog #A-11004) secondary antibodies. Sections     detection of mHTTex1-GFP was developed by screening mouse
were then mounted using ProLong Gold Antifade mountant with DAPI             monoclonal MW1, rabbit polyclonal anti-GFP (Invitrogen, catalog #A-
(Thermo Fisher Scientific, catalog #P36931) and imaged with either 5        11122), and mouse monoclonal anti-GFP, GF28R (Invitrogen, catalog
or 40 objectives (Carl Zeiss) using a Carl Zeiss Axioplan 2 microscope,     #MA5-15 256) in all 9 possible capture/probe combinations as previ-
Coolsnap HQ Digital CCD camera (Photometrics) and MetaMorph soft-            ously described (Southwell et al., 2015) using lysates of HEK293 cells
ware (Molecular Devices).                                                    transfected with either mHTTex1-GFP or GFP. Strength of signal and
    For detection of degenerating neurons after QA treatment, Fluoro-        specificity were assessed, and A11122/GF28R was selected as the best
Jade C (Biosensis, catalog #TR-100-FJ) staining was performed accord-        capture/probe pair for mHTTex1-GFP IP-FCM. However, compared
ing to the manufacturer’s protocol. Sections were mounted using              with IP-FCM using only A-11 122 capture beads for IP followed by FCM
ProLong Gold Antifade mountant with DAPI, and imaged with a 2.5             for GFP intensity, it was determined that the native fluorescence of the
objective (Carl Zeiss) using a Carl Zeiss Axioplan 2 microscope as above.    GFP was sufficient for quantitation when samples were collected and
    For evaluation of recombinant HTT distribution in the striatum, a        prepared protected from light. Thus, this method was used for experi-
series of sections spaced 200 mm apart and spanning the striatum were        mental quantitation of mHTTex1-GFP.
stained sequentially with mouse anti-expanded mHTT primary anti-                 IP-FCM. Approximately 10,000 5 mm caboxylate-modified latex
body (MW1, deposited to the University of Iowa Developmental                 beads (Invitrogen, catalog #C37255) were coupled with capture antibod-
Studies Hybridoma Bank by Patterson, P.H., catalog #MW1) and                 ies; HDB4E10 anti-HTT (Invitrogen, catalog #MA5-16703) or A-11122
detected with goat anti-mouse AlexaFluor-488 (1:500, Invitrogen, cata-       anti-GFP in 50 ml of NP40 lysis buffer (150 mM NaCl, 50 mM Tris, pH
log #A32723) secondary antibody. Then sections were probed with              7.4), Halt phosphatase (Thermo Fisher Scientific, catalog #78420), and
mouse/rat anti-DARPP-32 (1:500, R&D Systems, catalog #MAB4230)               Halt protease inhibitor cocktails (Thermo Fisher Scientific, catalog
and detected using goat anti-rat AlexaFluor-568 (1:500, Invitrogen, cat-     #78429, 2 mM sodium orthovanadate, 10 mM NaF, 10 mM iodoacet-
alog #A-11077). Sections were mounted using ProLong Gold Antifade            amide, and 1% NP40). Capture antibody coupled beads were then com-
mountant with DAPI and imaged at 2.5 using a Carl Zeiss Axioplan            bined with 50 mg brain or cell lysates in triplicate, 10 ml of CSF, or 20 ml
2 microscope as above.                                                       of plasma in triplicate in a 96-well V-bottom plate (Thermo Fisher
    Immunoblotting. Tissues and cell pellets were lysed through mechan-      Scientific, catalog #249944), brought to a total volume of 50 ml in NP40
ical dissociation using a tissue homogenizer, sonicated for 3 s and tritu-   lysis buffer, mixed well, and incubated overnight at 4°C. The next day,
rated in lysis buffer (50 mM Tris, pH 8.0, 150 mM NaCl, 1% Igepal/NP40,      the plate was spun down for 1 min at 650 RCF and supernatant was
40 mM b -glycerophosphate, 10 mM NaF) containing protease inhibitors         removed. Beads were washed 3 times in 200 ml IP-FCM wash buffer (100
(1 mM Roche Complete mini EDTA free, 1 mM sodium orthovanadate,              mM NaCl, 50 mM Tris, pH 7.4, 1% BSA, 0.01% NaN3). For measurement
1 mM PMSF, and 5 mM zVAD). Samples were then incubated on ice and            of mHTT, expanded polyQ antibody, MW1 was biotinylated using EZ-
vortexed every 5 min for 20 min. Lysates were then centrifuged for 15        Link Sulfo-NHS-Biotin (Thermo Fisher Scientific, catalog #21217), and
min at 20,000 RCF, and protein concentrations were measured by DC            50 ml of the diluted antibody was incubated with the HDB4E10 beads
assay. For HTT quantification, 40 mg of total protein from lysates or        bound to mHTT for 2 h at 4°C. Beads were washed 3 times with 200 ml
500 mg of total protein from culture media was resolved on 10% low-          of IP-FCM wash buffer. Streptavidin-PE (BD Biosciences, catalog
BIS acrylamide gels (Carroll et al., 2011), transferred to 0.45 mm nitro-    #554061) was prepared at 1:200 and 50 ml added to each well and incu-
cellulose, and probed with either mouse 1CU-4C8 anti-HTT (Thermo             bated at room temperature protected from light for 30 min. Beads were
Fisher Scientific, catalog #MAB2166) or mouse HU-2E8 anti-HTT                washed 3 times with 200 ml of IP-FCM buffer, resuspended in 200 ml of
(Sigma Millipore, catalog #MAB2168) and rabbit anti-calnexin (Sigma          IP-FCM wash buffer, and fluorescence intensity of ;2000 beads per
Millipore, catalog #C4731) as a loading control. Primary antibodies          sample, either HDB4E10/MW1 mHTT bead complexes or A-11122
were detected with IR dye 800CW goat anti-mouse (Rockland, catalog           mHTTex1-GFP bead complexes were measured using an Acuri C6 flow
#610-131-007) and AlexaFluor 680 goat anti-rabbit (Invitrogen, catalog       cytometer (BD Biosciences). Median fluorescence intensity (MFI) of PE
#A21076) labeled secondary antibodies. HTT band intensities from             for mHTT or GFP for mHTTex1-GFP was measured for each sample to
YAC128 and YAC128 C6R brain lysates were normalized to the cal-              determine target protein levels. MFI of PE in biofluids, tissue lysates, and
nexin loading control and then to the mean of the same allele in             recombinant HTT was corrected for background signal and presented as
YAC128 samples on the same membrane. HTT band intensities from               either absolute MFI values or relative mHTT values. MFI of GFP was
784 • J. Neurosci., January 27, 2021 • 41(4):780–796                                                            Caron et al. · Clearance of Huntingtin from the Brain to the CSF

corrected for background auto-fluorescence using CSF from naive ani-
mals and presented as absolute MFI values.
    Time-resolved Förster resonance energy transfer (TR-FRET).
Circulating mHTT protein in the plasma was measured by TR-FRET as
previously described (Weiss et al., 2009) with adaptations as in
Southwell et al. (2013). Briefly, 20 ml of plasma was mixed with 2 ng ter-
bium cryptate (FRET donor)-labeled (Cisbio) BKP1 anti-HTT antibody
and 20 ng of D2 dye (FRET acceptor)-labeled MW1 anti-expanded CAG
antibody, in a white 384-well plate (Corning, catalog #CLS3706). After
excitation at 340 nm, FRET was measured as the ratio of 665 nm (D2)/
615 nm (terbium) emission. FRET signal was corrected for background
signal using plasma from naive animals and presented as relative mHTT
values.
    NfL quantification. NfL was quantified in plasma samples using
commercially available NF-Light kits on the ultrasensitive Simoa HD-1
analyzer (Quanterix). Plasma samples were diluted 40 times before load-
ing into the HD-1 analyzer and then analyzed in duplicate as per the
manufacturer’s instructions. All samples were above the lower level of
quantification (0.174 pg/ml).
    ASO design and treatment. For the AQP4 ASO studies, a gapmer
with a phosphorothioate-modified backbone and four locked nucleic
acid modifications in each wing, complementary to the mouse Aqp4
transcript (59-CAGTAACATCAGTTCGT-39) was custom synthesized
by QIAGEN (formerly Exiqon). For the HTT ASO studies, a gapmer
with ay phosphorothioate-modified backbone and 5 locked nucleic acid
modifications in each wing complementary to the human HTT tran-
script was used, as described by Southwell et al. (2015). For ASO treat-
ments, molecules were diluted to the indicated concentration in sterile
PBS in a total volume of 10 ml and administered by ICV injection as in
Southwell et al. (2014).
    Experimental design and statistical analyses. All statistical analyses
were performed and graphs were generated using GraphPad Prism ver-
sion 8 (GraphPad). All experiments involving animals included approxi-
mately the same number of male and female mice. The number of
animals (biological replicates; N) used for each experiment is reported in
the figure legends. All bar graphs (see Figs. 1-5, 7) are presented as scat-
ter dot plots to demonstrate data complexity and variability. Group data
from averages of either multiple independent trials (see Fig. 3) or ani-
mals (see Figs. 1-7) are represented as mean 6 SEM. Alpha values of
,0.05 were considered significant for all analyses. F or t statistics and
degrees of freedom as well as exact p values for each statistical test are
presented in the text and corresponding figure legends.
    Groupwise comparisons were assessed using either the Student’s t           Figure 1. Intracellular mHTT is cleared to the CSF during induced neuronal death. A,
test (2 groups) or ANOVA (.2 groups). Post hoc analyses for ANOVA              Graphical overview of experimental design where 2-month-old WT animals received bilateral
tests were performed using the Tukey test (one-way ANOVA) or the               IS injections with either GFP or mHTTex1-GFP lentiviruses, and CSF was collected at 1, 2, 3,
Sidak test (two-way ANOVA) to correct for multiple comparisons.                4, and 6 weeks after injection for measurement of mHTT levels. B, IHC images showing that
    Statistical analysis comparing relative GFP signal at different time       mHTTex1-GFP transgene expression is visible at 1 week after injection, with expression dra-
points after injection (1, 2, 3, 4 and 6 weeks) following IS injections with   matically increased at 4 weeks after injection. B, Inset, High-magnification image at 4 weeks
either GFP or mHTTex1-GFP lentiviruses (see Fig. 1D) was performed             after injection show both diffuse mHTTex1-GFP and mHTT inclusions as well as extensive
                                                                               staining for NeuN in the transduced striatum, demonstrating the presence of neurons.
by two-way ANOVA with post hoc analysis using Sidak’s multiple com-
                                                                               Arrowheads indicate mHTT inclusion bodies. B, Inset, In contrast, at 6 weeks after injection,
parison test.
                                                                               mHTTex1-GFP expression remains high and large mHTT inclusion bodies are apparent,
    Statistical analysis comparing plasma NfL levels in WT, YAC128,
                                                                               whereas neurons are no longer present. C, IHC images of GFP control lentivirus show similar
and YAC128 C6R genotypes (see Fig. 2A) was performed by one-way
                                                                               distribution and expression levels as mHTTex1-GFP lentivirus at 1 and 4 weeks after injection.
ANOVA with post hoc analysis using Tukey’s multiple comparison test.
                                                                               D, Quantification of GFP MFI in the CSF from GFP or mHTTex1-GFP injected animals at differ-
Comparison of relative mHTT signal (see Fig. 2B,C) or relative brain lev-
                                                                               ent intervals after injection (N = 3-5 per time point). Two-way ANOVA: lentivirus treatment,
els (see Fig. 2E) between YAC128 and YAC128 C6R genotypes was per-
                                                                               p , 0.0001; time point, p = 0.0608; interaction, p = 0.0539. Sidak’s multiple comparison
formed by unpaired, two-tailed Student’s t test. MFI signal from FL
                                                                               test: ppp = 0.0048; pppp = 0.0003. A.U., Arbitrary units of fluorescence; Weeks post-injec-
HTT proteins with increasing Q lengths (see Fig. 2H) was log-trans-
                                                                               tion (W.P.I.).
formed and a nonlinear curve was fitted to the data.
    Statistical analysis comparing HTT secretion in vitro following treat-
ment with either DMSO vehicle or neutral sphingomyelinase inhibitors           biofluids from Hu97/18 mice under neurotoxic conditions following
was performed by either unpaired, two-tailed Student’s t test in Hu18/18       treatment with either DMSO vehicle or PDDC was performed by two-
forebrain neurons (see Fig. 3B) or two-way ANOVA with post hoc analy-          way ANOVA with post hoc analysis using Sidak’s multiple comparison
sis using Sidak’s multiple comparison test in Hu97/18 forebrain neurons        test with PBS/QA and vehicle/PDDC treatments as independent varia-
with treatment and HTT allele as independent variables (see Fig. 3D,H).        bles (see Fig. 4D,E).
    Statistical analysis comparing mHTT secretion in biofluids from                Statistical analyses comparing mHTT clearance from the brain fol-
Hu97/18 mice under basal conditions following treatment with either            lowing IS (see Fig. 5D,E) or ICV injection (see Fig. 5G,H) of FL mHTT
DMSO vehicle or PDDC was performed by unpaired, two-tailed                     Q67 at different time points after injection was performed by one-way
Student’s t test (see Fig. 4B,C). Comparison of mHTT secretion in              ANOVA with post hoc analysis using Tukey’s multiple comparison test.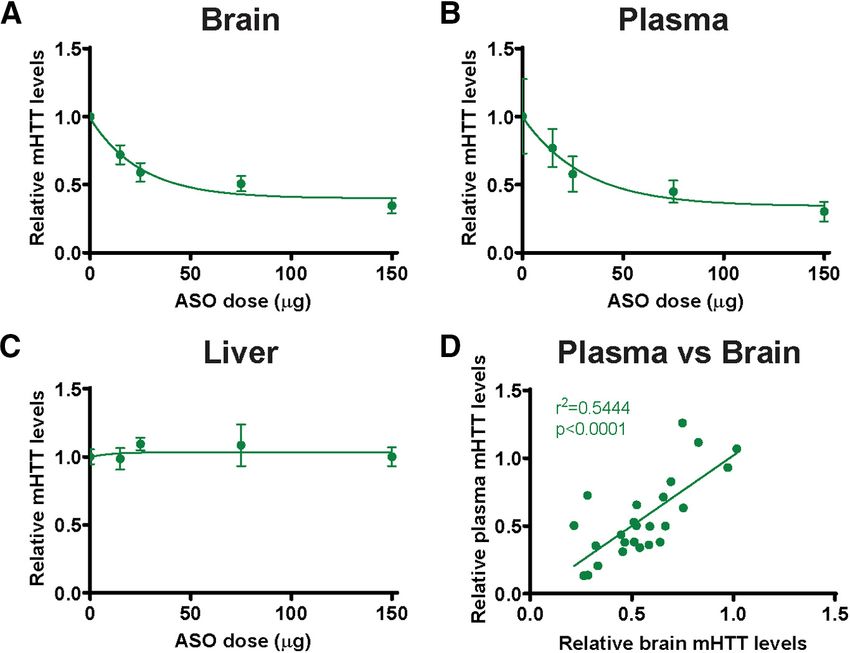
Caron et al. · Clearance of Huntingtin from the Brain to the CSF                                                                          J. Neurosci., January 27, 2021 • 41(4):780–796 • 785

Figure 2. Neurodegeneration is not required for release of mHTT into the CSF. A, Levels of NfL in the plasma of YAC128, YAC128 C6R, and WT littermate controls at 12 months of age
(N = 5-10 per genotype). One-way ANOVA: p = 0.0094. Tukey’s multiple comparison test: ppp = 0.0075, YAC128 compared with WT littermate control mice, not significant; p = 0.7792, WT
compared with YAC128 C6R mice. B, Quantification of mHTT MFI in brain lysates from YAC128 and YAC128 C6R mice using IP-FCM demonstrates similar MFI in both genotypes (N = 4, unpaired
t test: p = 0.7890). C, Quantification of mHTT MFI in the CSF from YAC128 and YAC128 C6R mice using IP-FCM demonstrates detectable CSF mHTT in both genotypes with higher signal
observed in YAC128 C6R mice (N = 4, unpaired t test: p = 0.0641). D, Representative Western blot probed with MAB2166 showing HTT levels in brain lysates from WT, YAC128, and YAC128
C6R mice. E, Quantification of relative mHTT levels in brain lysates (same used in C) from YAC128 and YAC128 C6R mice shows a significant reduction in YAC128 C6R mice (N = 4, unpaired t
test: ppp = 0.0021). F, CAG length sequencing in YAC128 and YAC128 C6R mice (N = 3-6 animals per line) showed an ;12 CAG (or 12 Q) increase in YAC128 C6R mice. Average CAG lengths
for each line are listed above their corresponding bars. G, PAGE separation and Coomassie staining of FL HTT proteins demonstrating appropriate size, including Q-length-dependent increase,
and lack of degradation products. H, IP-FCM was performed using a 10 dilution series from 0.002 to 200 pM of recombinant FL HTT proteins with polyQ tracts ranging from Q2 to Q78.
Nonexpanded HTT (Q2 and Q23) is not detected using this assay. For the same concentration of expanded mHTT proteins, MFI signal increases with increased polyQ length. x axis data were
log-transformed, and a nonlinear fit was applied to the data.

Comparison of mHTT levels in the plasma (see Fig. 5J) or CSF (see                               performed by log transforming ASO concentration (x axis) data and fol-
Fig. 5K) following intravenous injection of FL mHTT Q67 at different                            lowed by linear regression. A nonlinear curve was fitted to the data pre-
time points after injection was performed by one-way ANOVA with post                            sented in the figures. Linear regression was performed to compare MFI
hoc analysis using Tukey’s multiple comparison test.                                            signal in the brain with that in the plasma (see Fig. 6D). Fitting was done
    Statistical analyses comparing relative mHTT signal in the brain (see                       to individual mHTT signal values (y axis).
Fig. 6A), plasma (see Fig. 6B), and liver (see Fig. 6C) following treatment                         Statistical analysis comparing AQP4 levels in the cortex (see Fig. 7B)
of Hu97/18 mice with ascending doses of an HTT-targeted ASO was                                 and striatum (see Fig. 7D) following treatment of Hu97/18 mice with 2
786 • J. Neurosci., January 27, 2021 • 41(4):780–796 Caron et al. · Clearance of Huntingtin from the Brain to the CSF doses of an AQP4 targeted ASO was per- formed by one-way ANOVA with post hoc analysis using Tukey’s multiple comparison test. Comparison of mHTT clearance to bio- fluids from Hu97/18 mice under basal condi- tions following treatment with either PBS vehicle or AQP4 was performed by unpaired, two-tailed Student’s t test (see Fig. 7F,G). Com- parison of mHTT clearance to biofluids from Hu97/18 mice under neurotoxic conditions fol- lowing treatment with either PBS vehicle or AQP4 ASO was performed by two-way ANOVA with post hoc analysis using Sidak’s multiple comparison test with PBS/QA and PBS/AQP4 ASO treatments as independent variables (see Fig. 7I,J). Results Intracellular mHTT is cleared to the CSF during induced neuronal death We first wanted to investigate the mecha- nism and kinetics of the clearance of mHTT of intracellular origin to the CSF. To test this, lentiviruses encoding either GFP or mHTT exon 1 with 103 Qs fused to GFP (mHTTex1-GFP) (Southwell et al., 2009) were administered bilaterally into the striatum of WT mice and brains as well as CSF were collected at 1, 2, 3, 4, or 6 weeks after injection (Fig. 1A). We have previously shown that IS admi- nistration of lentiviral mHTTex1-GFP results in peak transgene expression at 3– 4 weeks after injection and the formation of a lesion by 6 weeks after injection with reactive astrocytes and dramatic neuron loss in the transduced area (Southwell et al., 2009). This is consistent with the expression time course observed by others using lentivirus-encoding mHTT fragments to model HD (de Almeida et al., 2002). Here we performed a time course of mHTTex1-GFP expression up to 6 weeks after injection. We observed GFP expression at 1 week after injection (Fig. 1B), which further increased with time at 2 and 3 weeks after injection, and was accompanied by the formation of mHTT inclusion bodies (data not Figure 3. HTT is secreted from primary neurons but not astrocytes. A, Representative Western blot of neuron lysates and shown). At 4 weeks after injection, diffuse concentrated media from Hu18/18 neurons probed with MAB2166. B, Quantification of secreted extracellular wtHTT from mHTTex1-GFP and inclusion bodies Hu18/18 neurons showed an 81% reduction following treatment with GW4869 (N = 4 independent experiments per treat- were evident throughout the striatum, ment condition, unpaired t test: pp = 0.0201). C, Representative Western blot of neuron lysates and concentrated media and there was extensive staining for from Hu97/18 neurons. D, Quantification of secreted extracellular HTT from Hu97/18 neurons showed a 73% reduction of NeuN1 cells, demonstrating the presence wtHTT and a 68% reduction of mHTT following treatment with GW4869 (N = 4 independent experiments per treatment con- of neurons (Fig. 1B). At 6 weeks after dition; two-way ANOVA: GW4869 treatment, p = 0.0002; HTT allele, p = 0.7515; interaction, p = 0.9913; Sidak’s multiple injection, there was a reduction in diffuse comparison test: pp = 0.0174, DMSO/wtHTT compared with GW4869/wtHTT; #p = 0.0180, DMSO/mHTT compared with mHTT exon 1, with widespread inclusion GW4869/mHTT). E, F, Representative Western blots of astrocyte lysates and immunoprecipitated (IP) culture media demon- bodies and an absence of NeuN staining strating intracellular HTT and a lack of extracellular protein in either (E) Hu18/18 or (F) Hu97/18 primary astrocyte cultures, in transduced areas, suggesting the com- suggesting that HTT is not secreted from these cells. Brightness and contrast have been adjusted to highlight the absence of plete loss of neurons (Fig. 1B). We HTT signal from IP media. G, Representative Western blot of neuron lysates and concentrated media from Hu97/18 neurons. observed a similar distribution and H, Quantification of secreted extracellular HTT from Hu97/18 neurons showed a 72% reduction of wtHTT and a 66% reduc- expression time course with the GFP con- tion of mHTT following treatment with PDDC (N = 8 independent experiments per treatment condition; two-way ANOVA: trol lentivirus (Fig. 1C). Using a novel PDDC treatment, p , 0.0001; HTT allele, p = 0.1923; interaction, p = 0.8704; Sidak’s multiple comparison test: GFP-specific ultrasensitive IP-FCM assay, ppppp , 0.0001, DMSO/wtHTT compared with PDDC/wtHTT; ####p , 0.0001, DMSO/mHTT compared with PDDC/mHTT).
Caron et al. · Clearance of Huntingtin from the Brain to the CSF                                                                            J. Neurosci., January 27, 2021 • 41(4):780–796 • 787

                                                                                                   we quantified GFP MFI in the CSF of GFP or mHTTex1-GFP-
                                                                                                   injected animals at 1, 2, 3, 4, and 6 weeks after injection. In GFP-
                                                                                                   injected animals, GFP fluorescence signal was not detected in the
                                                                                                   CSF, suggesting that GFP is retained intracellularly and does
                                                                                                   not induce neurodegeneration in transduced cells (Fig. 1D). In
                                                                                                   mHTTex1-GFP-injected animals, GFP signal in the CSF was
                                                                                                   detected from 1 week after injection, peaking 4 weeks after injec-
                                                                                                   tion when transgene expression is high and neurons are actively
                                                                                                   dying, and decreased to 33% of peak levels at 6 weeks after injec-
                                                                                                   tion, when transgene expression is still high, but neuron death is
                                                                                                   extensive (Fig. 1D; two-way ANOVA: lentivirus treatment,
                                                                                                   F(1,28) = 26.22, p , 0.0001; time point, F(4,28) = 2.555, p = 0.0608;
                                                                                                   interaction, F(4,28) = 2.653, p = 0.0539; Sidak’s multiple compari-
                                                                                                   son test: ppp = 0.0048; pppp = 0.0003). These data suggest that in-
                                                                                                   tracellular mHTT is cleared to the CSF during the process of
                                                                                                   neurodegeneration, but levels in the CSF are reduced after neu-
                                                                                                   rons have been lost. Conversely, the reduced signal observed at
                                                                                                   6 weeks could result from mHTT being in a more advanced state
                                                                                                   of aggregation, which may alter clearance of mHTT from the
                                                                                                   brain, or interfere with immunoassay quantitation of mHTT.

                                                                                                   Neurodegeneration is not required for release of mHTT into
                                                                                                   the CSF
                                                                                                   We next wanted to evaluate whether mHTT release into the CSF
                                                                                                   was abolished in the absence of neurodegeneration. To test this,
                                                                                                   we used the YAC128 C6R model of HD, which harbors a FL
                                                                                                   human mHTT YAC transgene that is resistant to caspase-6
                                                                                                   cleavage at residue 586. These mice do not undergo progressive
                                                                                                   striatal neuron loss as is seen in the YAC128 model (Slow et al.,
                                                                                                   2003; Graham et al., 2006). We first validated the lack of neuro-
                                                                                                   degeneration in YAC128 C6R mice by measuring levels of NfL
                                                                                                   in the plasma of YAC128, YAC128 C6R, and WT littermate con-
                                                                                                   trols at 12 months of age (Fig. 2A). We observed a significant
                                                                                                   increase in NfL levels in the YAC128 mice compared with litter-
                                                                                                   mate controls, suggesting that neurodegeneration is occurring,
                                                                                                   but no difference was observed between YAC128 C6R and litter-
                                                                                                   mate controls, affirming the lack of overt neurodegeneration in
                                                                                                   this line (Fig. 2A; one-way ANOVA: F(2,25) = 5.651 p = 0.0094;
                                                                                                   Tukey’s multiple comparison test: ppp = 0.0075, YAC128 com-
                                                                                                   pared with WT littermate control mice, not significant; p =
                                                                                                   0.7792, WT compared with YAC128 C6R mice). In brain lysates
                                                                                                   from YAC128 and YAC128 C6R mice, we measured similar
Figure 4. In vivo cellular secretion contributes to CSF and plasma mHTT. A, Graphical over-        mHTT signal in both lines using IP-FCM (Fig. 2B; unpaired t
view of experimental design to evaluate the contribution of secretion to mHTT in biofluids         test: t(6) = 0.2799, p = 0.7890). Notably, we observed an unex-
under basal and neurotoxic conditions. Hu97/18 mice received PDDC or DMSO vehicle control          pected trend toward an increase in mHTT levels in the CSF of
by daily intraperitoneal injections for 5 d. Biofluids were collected after the final injection.   YAC128 C6R compared with YAC128 mice by IP-FCM (Fig. 2C;
Under neurotoxic conditions, mice received either QA or PBS after the second PDDC injection.       unpaired t test: t(6) = 2.265, p = 0.0641). Previous reports have
Quantification of mHTT levels following treatment with PDDC under basal conditions showed          shown that levels of mHTT measured by Western blot are
a (B) 48% reduction in CSF mHTT (N = 15 or 16, unpaired t test: pp = 0.0270) and (C) 24%           reduced in brain lysates from YAC128 C6R compared with
reduction in plasma mHTT signal (N = 13, unpaired t test: pp = 0.0397), demonstrating that
                                                                                                   YAC128 mice (Graham et al., 2006; Ehrnhoefer et al., 2018b).
secretion contributes to mHTT in both biofluid compartments. D, E, In PBS-injected animals,
PDDC treatment resulted in (D) a 42% reduction in CSF (N = 8-13; two-way ANOVA: QA                 Therefore, we quantified mHTT levels by Western blot in the
treatment, p = 0.0002; PDDC treatment, p = 0.0011; interaction, p = 0.6422; Sidak’s multiple       same brain lysates that were analyzed by IP-FCM and found a
comparison test: p = 0.0508, vehicle/PBS compared with PDDC/PBS) and (E) 30% decrease in           significant reduction in mHTT levels in YAC128 C6R mice com-
plasma mHTT signal (N = 11-15; two-way ANOVA: QA treatment, p = 0.0017; PDDC treat-                pared with YAC128 mice (Fig. 2D,E; unpaired t test: t(6) = 5.135,
ment, p = 0.0001; interaction, p = 0.5564; Sidak’s multiple comparison test: pp = 0.0259 ve-       ppp = 0.0021).
hicle/PBS compared with PDDC/PBS), consistent with the effects of PDDC treatment under
basal conditions. Similarly, in QA-injected animals, treatment with PDDC resulted in (D) a         /
54% decrease in CSF mHTT (N = 8; Sidak’s multiple comparison test: #p = 0.0201, vehicle/QA
compared with PDDC/QA) and (E) a 40% reduction in plasma mHTT signal (N = 11-15;                   $
                                                                                                    p = 0.0256 vehicle/PBS compared with vehicle/QA), demonstrating a similar effect in the
Sidak’s multiple comparison test: ##p = 0.0026, vehicle/QA compared with PDDC/QA), sug-            two compartments. In PDDC-treated animals injected with either PBS or QA, there was (D) a
gesting that secretion contributes to mHTT clearance following neurotoxic injury. In vehicle-      49% increase in CSF mHTT signal (N = 8-13; Sidak’s multiple comparison test: %p = 0.0190,
treated animals, QA injection resulted in (D) a 62% increase in CSF mHTT signal (N = 8;            PDDC/PBS compared with PDDC/QA), and (E) a 23% increase in plasma mHTT (N = 15;
Sidak’s multiple comparison test: $$p = 0.0078, vehicle/PBS compared with vehicle/QA) and          Sidak’s multiple comparison test: p = 0.0793, PDDC/PBS compared with PDDC/QA). Thus, in-
(E) a 33% increase in plasma mHTT signal (N = 11; Sidak’s multiple comparison test:                hibition of HTT secretion does not alter acute neurotoxic increases in CSF or plasma mHTT.
788 • J. Neurosci., January 27, 2021 • 41(4):780–796 Caron et al. · Clearance of Huntingtin from the Brain to the CSF Figure 5. Exogenous extracellular FL mHTT Q67 is cleared from the brain to the CSF, then to the blood, and can reenter the CSF. A, Graphical overview of experimental design where 2- month-old WT animals received a unilateral IS injection with 500 ng of FL mHTT Q67; and brain and CSF were collected at different time points after injection. B, IHC images of brains stained with MW1 antibody following IS injection (at 1 and 6 h) with FL mHTT Q67. DARPP-32 costaining was done to highlight the striatum. C, Representative Western blot probed with MAB2168 showing FL mHTT levels in the striatum at different intervals after injection. D, E, Quantification of relative FL mHTT levels in the (D) striatum by immunoblot (N = 3–5 per time point; one- way ANOVA: p , 0.0001; Tukey’s multiple comparison test of 0.5 h compared with other time points: pppp = 0.005; ppppp , 0.0001), (E) CSF by IP-FCM (N = 5 or 6; one-way ANOVA: p , 0.0001; Tukey’s multiple comparison test for relative mHTT levels at 0.5 h compared with other time points: pp = 0.0495; ppp = 0.0041; pppp = 0.007; ###p = 0.0003). A second y axis showing the % injected dose that was cleared to the CSF (area under curve = 18.82 6 4.319%) was added based on a standard curve generated using FL mHTT Q67 protein. F, Graphical over- view of experimental design where WT animals received a unilateral ICV injection with 500 ng of FL mHTT Q67; and brain, CSF, and plasma were collected at different time points after injec- tion. G, H, Quantification of mHTT in the (G) CSF by IP-FCM (N = 4-8 per time point; one-way ANOVA: p = 0.0041; Tukey’s multiple comparison test of 0.5 h compared with other time points: pp = 0.0146; ppp = 0.0046; #p = 0.0319), and (H) plasma by TR-FRET (N = 4-8 per time point; one-way ANOVA: p = 0.1768) at different time points after injection. I, Graphical overview of experimental design where WT animals received an intravenous bolus injection with 500 ng of FL mHTT Q67; and brain, plasma, and CSF were collected at different time points after injection. J, K, Quantification of mHTT in the (J) plasma by TR-FRET (N = 3-5 per time point; one-way ANOVA: p = 0.0009) and (K) CSF by IP-FCM (N = 3 or 4 per time point; one-way ANOVA: p = 0.1167).
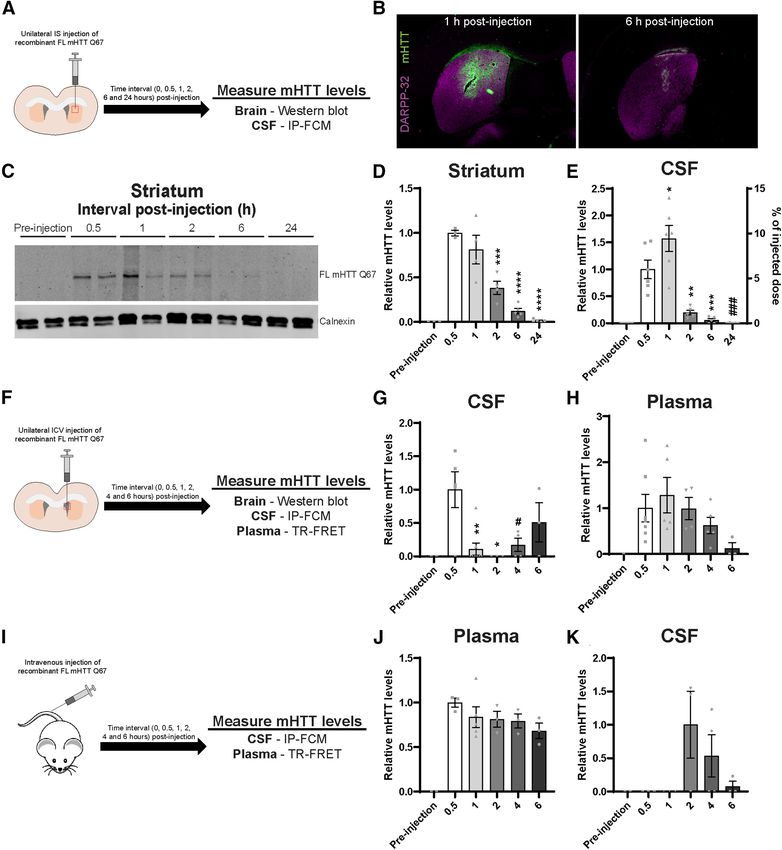
Caron et al. · Clearance of Huntingtin from the Brain to the CSF                                                             J. Neurosci., January 27, 2021 • 41(4):780–796 • 789

                                                                                                                             secreted from neuronal cells via an LE/
                                                                                                                             Lys secretory pathway and that its secre-
                                                                                                                             tion could be inhibited using a neutral
                                                                                                                             sphingomyelinase (nSMase) inhibitor,
                                                                                                                             GW4869 (Trajkovic et al., 2017). In
                                                                                                                             Hu18/18 primary neurons, we observed
                                                                                                                             that wtHTT was secreted into the media
                                                                                                                             and that this secretion was significantly
                                                                                                                             reduced by 81% following treatment with
                                                                                                                             GW4869 (Fig. 3A,B; unpaired t test: t(6) =
                                                                                                                             3.137, p = 0.0201). Moreover, we found
                                                                                                                             that treatment of Hu97/18 primary
                                                                                                                             neurons with GW4869 led to a signifi-
                                                                                                                             cant reduction of wtHTT by 73% and
                                                                                                                             mHTT by 68% in the media (Fig. 3C,
                                                                                                                             D; two-way ANOVA: GW4869 treat-
                                                                                                                             ment, F (1,12) = 27.55, p = 0.0002; HTT
                                                                                                                             allele, F (1,12) = 0.1050, p = 0.7515; int-
                                                                                                                             eraction, F(1,12) = 0.0001245, p = 0.9913;
                                                                                                                             Sidak’s multiple comparison test: pp =
                                                                                                                             0.0174, DMSO/wtHTT compared with
                                                                                                                             GW4869/wtHTT; #p = 0.0180, DMSO/
                                                                                                                             mHTT compared with GW4869/mHTT).
                                                                                                                             Notably, both wtHTT and mHTT were
Figure 6. Correlative reduction of plasma mHTT following ASO-mediated mHTT suppression in the CNS. Hu97/18 mice              secreted from Hu97/18 forebrain neurons
received a unilateral ICV bolus injection of either PBS vehicle or ascending doses (15, 25, 75, or 150 mg) of an ASO against at similar levels (Fig. 3D; Sidak’s multiple
human HTT; and 4 weeks later, tissues and plasma were collected for mHTT quantification by IP-FCM. A, B, Quantification of
                                                                                                                             comparison: p . 0.9999, DMSO/wtHTT
mHTT protein from (A) brain lysates (N = 8 per dose; log-transformed linear regression, R = 0.3773, p , 0.001) and (B)
                                                                                             2

plasma (N = 5-7 per dose; log-transformed linear regression, R = 0.2977, p , 0.01) after ASO treatment demonstrates
                                                                   2                                                         compared with DMSO/mHTT), and treat-
dose-dependent reduction of mHTT. C, Quantification of mHTT protein from liver lysates shows no reduction following CNS      ment with GW4869 resulted in similar
ASO treatment (N = 3-8 per dose; log-transformed linear regression, R2 = 0.0020, p = 0.8416). D, Comparison of mHTT IP-      reductions of wtHTT and mHTT in the
FCM MFI signal in brain and plasma following ASO-induced CNS HTT reduction shows a significant positive correlation (R2 =    culture media (Fig. 3D; Sidak’s multiple
0.5444. p , 0.0001), suggesting that the CNS contributes to circulating mHTT protein. A, Data from Southwell et al. (2015).  comparison: p . 0.9999 GW4869/wtHTT
                                                                                                                             compared with GW4869/mHTT). These
     To help elucidate this difference between the observed IP-                                                              data demonstrate that there is no allelic
FCM mHTT signal and Western blot mHTT levels, we CAG                                                bias in the secretion of HTT from Hu97/18 primary neurons (Fig.
sized the transgenes in both lines and found that YAC128 C6R                                        3C,D), suggesting that this process may be a normal physiological
mice have a longer CAG tract (Fig. 2F; 138 CAG repeats = 138                                        function of HTT. We failed to detect HTT in the media of both
Qs) than the YAC128 parent line (126 CAGs = 126 Qs).                                                Hu18/18 (Fig. 3E) and Hu97/18 (Fig. 3F) primary astrocytes, de-
Considering the observed increase in CSF mHTT IP-FCM signal                                         spite enrichment by immunoprecipitation with an antibody
noted in the YAC128 C6R mice, we wanted to determine                                                against HTT. This suggests that HTT is not secreted from primary
whether our assay quantifies FL mHTT with different Q lengths                                       astrocytes in vitro.
in a comparable way. To investigate this, we used an allelic series
of recombinant FL HTT proteins with polyQ tracts ranging from                                       In vivo cellular secretion contributes to CSF and plasma
Q2 to Q78 (Fig. 2G) to compare the relationship between polyQ                                       mHTT
tract length and HDB4E10/MW1 IP-FCM MFI signal at a variety                                         We next wanted to evaluate the relative contribution of mHTT
of known protein concentrations. We observed that MFI                                               secretion to mHTT in the CSF and plasma of animals. Since
increased with longer Q tracts (Fig. 2H). This demonstrates that                                    GW4869 is not brain penetrant, we used PDDC, a potent small-
HDB4E10/MW1 MFI is a measure of signal rather than absolute                                         molecule nSMase inhibitor that enters the brain after systemic
protein concentration and suggests that the increased MFI                                           administration (Rojas et al., 2019). Treatment of Hu97/18 neu-
observed in the CSF from YAC128 C6R line was because of the                                         rons with PDDC led to a significant reduction of both wtHTT and
longer polyQ tract in this line (138 Qs) compared with the                                          mHTT in the culture media (Fig. 3G,H; two-way ANOVA: PDDC
YAC128 mice (126 Qs), rather than increased mHTT concentra-                                         treatment, F(1,28) = 323.12, p , 0.0001; HTT allele, F(1,28) = 1.785,
tion. Despite this caveat that prohibits direct comparison of                                       p = 0.1923; interaction, F(1,28) = 0.02710, p = 0.8704; Sidak’s multi-
mHTT concentrations in the brain and CSF of these lines using                                       ple comparison test; ppppp , 0.0001, DMSO/wtHTT compared
IP-FCM, ample mHTT was detected in the CSF of YAC128 C6R                                            with PDDC/wtHTT; ####p , 0.0001, DMSO/mHTT compared
mice, demonstrating that it is released to CSF in the absence of                                    with PDDC/mHTT), similar to treatment with GW4869 (Fig. 3A–
neurodegeneration and must reach this compartment by other                                          D), which further validates that inhibition of nSMase suppresses
mechanisms.                                                                                         HTT secretion.
                                                                                                        To investigate the contribution of secretion under basal con-
HTT is secreted from primary neurons but not astrocytes                                             ditions, Hu97/18 mice received daily intraperitoneal injections
We next investigated whether HTT is secreted from primary                                           with either PDDC or vehicle for 5 d and mHTT in the CSF, and
forebrain neurons and astrocytes derived from Hu18/18 and                                           plasma was measured by IP-FCM ;6 h after the final injection
Hu97/18 humanized mice. Recently, it was shown that mHTT is                                         (Fig. 4A). We observed a treatment-induced reduction of mHTT of
You can also read