NLP-based Feature Extraction for the Detection of COVID-19 Misinformation Videos on YouTube
←
→
Page content transcription
If your browser does not render page correctly, please read the page content below

NLP-based Feature Extraction for the Detection of COVID-19
                    Misinformation Videos on YouTube

          Juan Carlos Medina Serrano, Orestis Papakyriakopoulos, Simon Hegelich
                         Technical University of Munich, Germany
                {juan.medina, orestis.p}@tum.de, simon.hegelich@hfp.tum.de

                      Abstract                                laden comments. We find that misinformation
    We present a simple NLP methodology for de-               videos contain a significantly higher propor-
    tecting COVID-19 misinformation videos on                 tion of conspiratorial comments.
    YouTube by leveraging user comments. We
    use transfer learning pre-trained models to gen-         • Based on this information, we use the percent-
    erate a multi-label classifier that can categorize         age of conspiracy comments as feature for
    conspiratorial content. We use the percentage              the detection of COVID-19 misinformation
    of misinformation comments on each video                   videos. We verify its efficiency by deploying
    as a new feature for video classification. We              simple machine learning models for misinfor-
    show that the inclusion of this feature in sim-
                                                               mation detection. We employ the videos’ title
    ple models yields an accuracy of up to 82.2%.
    Furthermore, we verify the significance of the
                                                               and the first 100 comments to validate feature
    feature by performing a Bayesian analysis. Fi-             significance.
    nally, we show that adding the first hundred
    comments as tf-idf features increases the video          • We show that including the first hundred com-
    classifier accuracy by up to 89.4%.                        ments as tf-idf features in the classifier in-
                                                               creases accuracy from 82.2% to 89.4%.
1    Introduction
The COVID-19 health crisis was accompanied by            2    Related Work
a misinfodemic: The limited knowledge on the na-
                                                         Previous research studies have extensively investi-
ture and origin of the virus gave ample space for
                                                         gated the possibilities and limits of NLP for detect-
the emergence of conspiracy theories, which were
                                                         ing misinformation. Researchers have provided the-
diffused on YouTube, and online social networks.
                                                         oretical frameworks for understanding the lingual
Although YouTube accelerated attempts to detect
                                                         and contextual properties of various types of misin-
and filter related misinformation, it yielded moder-
                                                         formation, such as rumors, false news, and propa-
ate results (Li et al., 2020; Frenkel et al., 2020).
                                                         ganda (Li et al., 2019; Thorne and Vlachos, 2018;
   In this study, we present a simple NLP-based
                                                         Rubin et al.; Zhou and Zafarani, 2018). Given the
methodology that can support fact checkers in de-
                                                         general difficulty in detecting misinformation, sci-
tecting COVID-19 misinformation on YouTube. In-
                                                         entists have also developed dedicated benchmark
stead of training models on the videos themselves
                                                         datasets to evaluate the effectiveness of NLP ar-
and predicting their nature, we exploit the vast
                                                         chitectures in misinformation-related classification
amount of available comments on each YouTube
                                                         tasks (Pérez-Rosas et al., 2018; Hanselowski et al.,
video and extract features that can be used in mis-
                                                         2018). Given the vast amount of misinformation
information detection. Our methodology comes
                                                         appearing in online social networks, various re-
with the advantage that labeling comments is sim-
                                                         search studies propose case-specific NLP method-
pler and faster than video labeling. Additionally,
                                                         ologies for tracing misinformation. For example,
no complex neural architecture is needed for the
                                                         Della Vedova et al. (2018) and Popat et al. (2018)
classification of videos.
                                                         combined lingual properties of articles and other
   Our study provides the following contributions:
                                                         meta-data for the detection of false news. Volkova
    • We create a multi-label classifier based on        et al. (2017), Qazvinian et al. (2011) and Kumar
      transfer learning that can detect conspiracy-      and Carley (2019) created special architectures that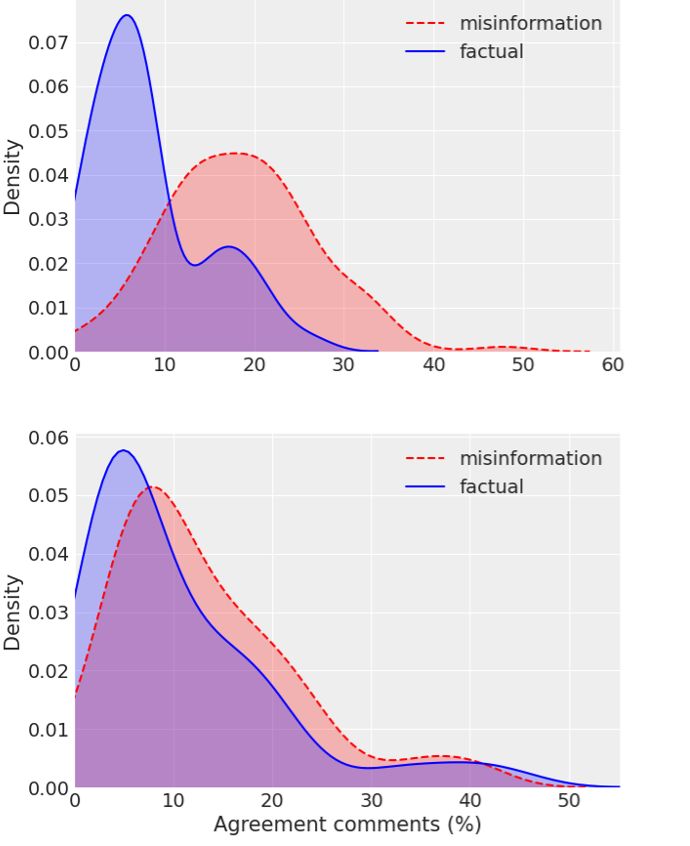
take into consideration the microblogging structure     made OR human origin”. From the remaining
of online social networks, while De Sarkar et al.       posts, we extracted and expanded the URLs. We
(2018) and Gupta et al. (2019) exploited sentence-      identified 1,672 unique YouTube videos. 10% of
level semantics for misinformation detection.           these videos had been blocked by YouTube as of
   Despite the deployment of such architectures         April 2020. For the rest of the videos, we watched
for fact checking, locating malicious content and       them, excluded the non-English videos, and manu-
promptly removing it remains an open challenge          ally labeled them as either misinformation, factual,
(Gillespie, 2018; Roberts, 2019). In the case of        or neither. To label a video as misinformation, we
COVID-19 misinformation, a large share of con-          validated that its message was conveying with cer-
spiratorial contents remain online on YouTube and       tainty a conspiracy theory regarding the origin of
other platforms, influencing the public despite con-    the coronavirus, as a man-made bioweapon or be-
tent moderation practices (Li et al., 2020; Frenkel     ing caused by 5G. We did not classify videos that
et al., 2020; Ferrara, 2020). Given this, it is im-     questioned its origin but showed no certainty about
portant to develop case-specific NLP tools that can     a hoax (which included well-known and verified
assist policymakers and researchers in the process      news media videos) as misinformation. We classi-
of detecting COVID-19 misinformation and man-           fied as factual those videos that included debunk-
aging it accordingly. Towards this end, we illus-       ing of conspiracy theories or presented scientific
trate how NLP-based feature extraction (Shu et al.,     results on the origins and causes of COVID-19. We
2017; Jiang et al., 2020) based on user comments        labeled the rest of the videos as neither. Two of the
can be effectively used for this task. User comment     authors (JCMS, OP) performed the labeling proce-
data has been employed to annotate social media         dure independently. For the cases where the labels
objects (Momeni et al., 2013), infer the political      did not agree, the third author was consulted (SH).
leaning of news articles (Park et al., 2011), and          Afterward, we collected the comments on both
to predict popularity (Kim et al., 2016). Previous      misinformation and factual videos using YouTube’s
studies explicitly employed comments as proxies         Data API1 . For this study, we only included videos
for video content classification (Huang et al., 2010;   with more than twenty comments. The final dataset
Filippova and Hall, 2011; Eickhoff et al., 2013;        consisted of 113 misinformation and 67 factual
Doğruöz et al., 2017). However, only Jiang and        videos, with 32,273 and 119,294 total comments
Wilson (2018) have analyzed user content to iden-       respectively. We selected a ten percent random
tify misinformation. However, they focused on lin-      sample of the comments from the misinformation
guistic signals and concluded that users’ comments      videos and proceeded to label them. This label-
were not strong signals for detecting misinforma-       ing procedure was performed in the same man-
tion.                                                   ner as the video classification to ensure data qual-
                                                        ity. For each comment, we collected two labels.
3     Methodology and Experiments                       First, we gave a label if the comment expressed
                                                        agreement (1) or not (0). Agreement comments
3.1    Dataset
                                                        included comments such as “this is the video I was
The first step of the study consisted of obtaining      looking for”, or “save and share this video before
a set of YouTube videos that included either mis-       YouTube puts it down”. The second label consid-
information or debunking content. We decided to         ered if comments amplified misinformation with
search for YouTube videos through user-generated        a conspiracy theory/misinformation comment (1)
content on social media platforms. For this, we         or without one (0). Comments that questioned the
queried the Pushshift Reddit API (Baumgartner           conspiracies (such as “could it be a bioweapon?”)
et al., 2020), and Crowdtangle’s historical data of     were not labeled as misinformation. 19.7% of the
public Facebook posts (Silverman, 2019) using the       comments in the sample were labeled as conspir-
query “COVID-19 OR coronavirus”. Additionally,          acy comment and 12.5% as agreement comment.
we downloaded the COVID-19 Twitter dataset de-          Only 2.2% of the comments were classified as both
veloped by Chen et al. (2020). The total dataset        agreement and conspiratorial. Although both agree-
included over 85 million posts generated between        ment and conspiracy labeled comments express the
January and April 2020. We significantly reduced        same message of believing in the misinformation
this dataset by querying the posts with “biowarfare
                                                           1
OR biological weapon OR bioweapon OR man-                      https://developers.google.com/youtube/v3
content from the videos, we decided to keep them
apart due to their different linguistic properties. To
compare the collection of agree-labeled comments
and conspiracy-labeled comments, we tokenized
and created a bag-of-words model. 19.4% of the
processed tokens appear on both collections. How-
ever, only 1.95% of the tokens have more than four
occurrences in the two collections. We applied χ2
tests for each of these remaining words and ob-
served that 50% occur in significantly different pro-
portions. In the end, only 0.96% of the vocabulary
has a significant similar number of occurrences in
the two datasets. The YouTube comments dataset
without user data can be accessed in this GitHub
repository2 , alongside a Google Colab notebook
with the code.
3.2 Classification of Users’ Comments
We first performed a multi-label classification on
the 10% sample of the misinformation videos’ com-
ments. We split the annotated data into training
(80%) and test (20%) datasets. We employed state-
of-the-art neural transfer learning for the classi-
fication by fine-tuning three pre-trained models:
XLNet base (Yang et al., 2019), BERT base (De- Figure 1: Precision and recall curves for binary F1
vlin et al., 2018) and RoBERTa base (Liu et al., scores for the conspiracy (upper figure) and agreement
(lower figure) label. The plot shows the results for three
2019). The fine-tuning consists of initializing the
neural-transfer classifiers.
model’s pre-trained weights and re-training on la-
beled data. We ran the models for four epochs
using the same hyperparameters as the base mod-
is the best performing model for the training and
els. For the experiments, we used 0.5 as a decision
test dataset on the conspiracy classification as for
threshold. Additionally, we trained two simpler
the test data on the agreement label. BERT is the
models as baselines: a logistic regression model us-
best performing model only for the training data
ing LIWC’s lexicon-derived frequencies (Tausczik
on the agree label. The three transformer models
and Pennebaker, 2010) as features, and a multino-
outperform the baseline models. This predictive
mial Naive Bayes model using bag-of-words vec-
superiority is more evident in the precision-recall
tors as features. Table 1 shows the average micro-
curves (with corresponding binary-F1 scores) of
F1 scores for the three transformer models after
the five models on the test data (Figure 1).
performing the fine-tuning five times. RoBERTa
We employed the fine-tuned RoBERTa model
2
https://github.com/JuanCarlosCSE/YouTube misinfo to predict the labels of the remaining comments
from the misinformation and factual videos. We
Agree Conspiracy then calculated the percentage of conspiracy com-
Train Test Train Test ments per video. We also obtained this percentage
LIWC 88.7 88.6 81 78.2
NB 94.2 82.4 94.3 78.8 for the agreement label. Figure 2 shows the result-
XLNet 97±0.1 93.1±0.3 93.9±0.5 84.8±0.6 ing density distributions from misinformation and
BERT 98.5±0.1 93.3±0.5 96.3±0.3 83.8±0.9 factual videos. We observed a difference between
RoBERTa 98.1±0.2 93.9±0.4 96.4±0.3 86.7±0.5
the distributions from the two types of videos. We
Table 1: Train and test micro F1 scores (mean and stan- confirmed this by performing Welch’s t-test for in-
dard deviation) from multi-label classification models: dependent samples. For the conspiracy comments
LIWC with logistic regression and Naive Bayes as base- percentage, the t-test was significant (ptributions. The t-test was not significant for the LR SVM RF
title 62.7 62.7 62.7
agreement percentage (p>0.1). conspiracy % 62.7 81.1 72.2
comments 66.7 83.9 82.8
title + conspiracy % 64.4 77.7 82.2
comments + conspiracy % 73.3 89.4 84.44
all 73.3 84.4 82.7
Table 2: Classification accuracy for logistic regression,
linear support vector machines, and random forest mod-
els for six feature settings. Results show the average of
10-k cross-validation.
alone achieves an accuracy of 81.1. Using the tf-
idf comment features the accuracy is slightly better
with 83.9. However, the conspiracy feature and
comments combined achieve the highest accuracy
of 89.4. We observe that the models with all the
features combined have lower accuracy than the
models omitting the title features. This may ex-
plain that the title is not a good feature. Using the
title feature alone does not improve the baseline
accuracy of 62.7. Interestingly, the accuracy for
the best model is still high (85.5%) when taking
Figure 2: Probability densities of misinformation and into consideration only videos with less than 100
factual videos regarding the percentage of conspirato- comments. This implies that our methodology is
rial comments (top) agreement comments (bottom). appropriate for the early detection of misinforma-
tion videos.
3.3 Classification of YouTube Videos 3.4 Bayesian Modeling
The next step consisted of classifying the set of To find the statistical validity of the conspiracy per-
YouTube videos to detect misinformation. For this, centage feature, we turned to Bayesian modeling as
we employed the percentage of conspiracy com- it allows us to obtain the full posterior distribution
ments of each video as a feature. Additionally, we of feature coefficients. We performed inference on
extracted content features from the videos’ titles three Bayesian logistic regression models using a
and from the raw first hundred comments per video Hamiltonian Monte Carlo solver. A simple model
(or all the comments for videos with fewer than 100 considered only the conspiracy percentage feature.
comments). For this, we preprocessed the titles and A second model included this feature and the ten
comments with tokenization, removal of stopwords, most relevant word features from the random for-
and usage of the standard term frequency-inverse est model trained only on the title and conspiracy
document (tf-idf) weighting for word frequencies percentage. A third model included the conspiracy
to create a document term matrix, whose columns feature, and the top ten most relevant words from
serve as input features. We selected six feature the linear SVM trained on the conspiracy feature
settings for our experiments: each of the set of and the first 100 comments. The first column of
features alone and the three possible combination Table 3 and 4 shows the importance of each of
between them . For each setting, we employed the features in the random forest and linear SVM
three classification models: logistic regression, lin- model, respectively. The two tables also show the
ear support vector machine (SVM), and random statistics of the posterior probability distributions
forest. We performed 10-fold cross-validation and of the model coefficients: the mean, standard devi-
report the mean accuracy in Table 2. We avoided ation, and the 1% and 99% quantiles. For the three
grid search to find better hyperparameters as we models, the coefficients distribution converged (the
did not have a test dataset. We observe that the Rb diagnostic (Vehtari et al., 2019) was equal to
SVM model has the highest accuracy for all the one). We specifically selected logistic regression
settings except for one. The conspiracy feature models for their interpretability. We observe thatfor the model based on the title word features, the RF mean SD 1% 99%
conspiracy % 19.2 28.25 4.8 18.19 39.94
posterior distribution of the conspiracy percentage coronavirus 2.95 -7.45 3.4 -15.57 0.01
feature coefficient is the only one that does not covid19 2.81 -5.17 2.4 -11.08 0.10
include zero in its 98% highest posterior density china 1.42 -4.28 3 -11.23 2.63
man 1.24 -6.04 2.8 -12.25 0.52
interval (Table 3). Although this is not equivalent bioweapon 1.24 4.81 5.5 -6.40 19.32
to traditional p-values, it conveys significance in conspiracy 1.1 -4.24 3.7 -13.96 3.72
new 1.03 -5.13 5.4 -18.93 6.39
a Bayesian setting. The model based on the 100 update 0.87 -0.15 2.5 -6.57 5.69
comments word features (Table 4) maintains the cases 0.83 -12.37 6.3 -26.75 2.10
conspiracy feature as significant. However, three outbreak 0.72 -1.25 2.9 -8.31 5.66
coefficients from the word features also avoid zero
Table 3: Top eleven features from the random forest
in their 98% interval. The model’s coefficients are model with the conspiracy and title as feature with the
negative for covid19 and lab, and positive for god. statistics of the coefficients’ posterior probability dis-
Finally, we compare the three Bayesian models tributions. The first column shows the percentage of
using the WAIC information criteria, which esti- feature importance.
mates out-of-sample expectation and corrects for
svm mean SD 1% 99%
the effective number of parameters to avoid overfit- conspiracy % 2.82 34.96 6.2 20.56 50.09
ting (Watanabe and Opper, 2010). Figure 3 shows virus 0.93 -6.70 5.3 -19.64 4.82
the resulting deviance of the three models. We ob- covid19 0.84 -28.8 10 -54.33 -6.20
god 0.75 19.29 7.6 3.39 37.54
serve that the second model is slightly better than allah 0.73 -40.09 26 -103.18 1.32
the simple model. However, the differences are china 0.72 -4.64 3.9 -14.60 3.76
included in the standard error of the title words fea- gates 0.69 3.39 16 -32.39 42.94
amir 0.68 -8.57 6.6 -24.66 5.81
ture model. This is not true for the simple model lab 0.68 -20.70 8.2 -40.57 -2.28
and the model including the comments features. cases 0.66 -22.41 14 -57.26 8.48
In this case, the full model outperforms the model trump 0.63 14.53 9.6 -7.23 36.92
based only on the conspiracy feature. This indicates Table 4: Top eleven features from the SVM model with
that there is important information in the videos’ conspiracy and first 100 comments as features with the
first hundred comments that is not explained by the statistics of the coefficients’ posterior probability distri-
conspiracy percentage feature on its own. butions. The first column shows the SVM coefficients.
4 Discussion
We have leveraged large quantities of user com-
ments to extract a simple feature that is effective
in predicting misinformation videos. Given that
the classifier is also accurate for videos with few
Figure 3: Deviance using WAIC as model selection
comments, it can be used for online learning. For
metric. Black error bars represent the standard error.
example, the user comments of videos containing
coronavirus can be tracked and classified as they
are posted. High levels of conspiracy comments content of the videos’ first 100 comments signif-
could then indicate that the video includes misinfor- icantly improves the accuracy of misinformation
mation claims. For this to work, it is not necessary video detection from 82.2 to 89.4. However, in
to have a conspiracy classifier with perfect accuracy large-scale settings, it may be prohibitive to store
given that the percentage of conspiracy comments the raw comments and continuously perform batch
feature is based on aggregating the classification classification. In contrast, the conspiracy percent-
results from all the comments. An improved clas- age feature only requires storing one conspiracy
sifier would be able to define a threshold that al- comment counter per video. Future research could
lows a balanced number of false positives and true leverage the video content to increase the classifier
negatives. The average percentage of conspirato- accuracy. The detection of misinformation on so-
rial comments would be maintained, irrespective cial media remains an open challenge, and further
of the wrong classifications. On the other hand, research is needed to understand how the COVID-
the accuracy of the video classifier is more critical. 19 misinfodemic spread to prevent future ones.
We found that using simple classifiers on the rawReferences Freedom: Censorship, Disinformation, and Propa-
ganda, pages 92–97, Hong Kong, China. Associa-
Jason Baumgartner, Savvas Zannettou, Brian Keegan, tion for Computational Linguistics.
Megan Squire, and Jeremy Blackburn. 2020. The
pushshift reddit dataset. In Proceedings of the Inter-
Andreas Hanselowski, Avinesh PVS, Benjamin
national AAAI Conference on Web and Social Media,
Schiller, Felix Caspelherr, Debanjan Chaudhuri,
volume 14, pages 830–839.
Christian M. Meyer, and Iryna Gurevych. 2018. A
Emily Chen, Kristina Lerman, and Emilio Ferrara. retrospective analysis of the fake news challenge
2020. Covid-19: The first public coronavirus twit- stance-detection task. In Proceedings of the 27th
ter dataset. arXiv preprint arXiv:2003.07372. International Conference on Computational Lin-
guistics, pages 1859–1874, Santa Fe, New Mexico,
Sohan De Sarkar, Fan Yang, and Arjun Mukherjee. USA. Association for Computational Linguistics.
2018. Attending sentences to detect satirical fake
news. In Proceedings of the 27th International Con- Chunneng Huang, Tianjun Fu, and Hsinchun Chen.
ference on Computational Linguistics, pages 3371– 2010. Text-based video content classification for
3380, Santa Fe, New Mexico, USA. Association for online video-sharing sites. Journal of the Ameri-
Computational Linguistics. can Society for Information Science and Technology,
61(5):891–906.
Marco L Della Vedova, Eugenio Tacchini, Stefano
Moret, Gabriele Ballarin, Massimo DiPierro, and Shan Jiang, Miriam Metzger, Andrew Flanagin, and
Luca de Alfaro. 2018. Automatic online fake news Christo Wilson. 2020. Modeling and measuring ex-
detection combining content and social signals. In pressed (dis) belief in (mis) information. In Proceed-
2018 22nd Conference of Open Innovations Associ- ings of the International AAAI Conference on Web
ation (FRUCT), pages 272–279. IEEE. and Social Media, volume 14, pages 315–326.
Jacob Devlin, Ming-Wei Chang, Kenton Lee, and Shan Jiang and Christo Wilson. 2018. Linguistic sig-
Kristina Toutanova. 2018. Bert: Pre-training of deep nals under misinformation and fact-checking: Evi-
bidirectional transformers for language understand- dence from user comments on social media. Pro-
ing. arXiv preprint arXiv:1810.04805. ceedings of the ACM on Human-Computer Interac-
A Seza Doğruöz, Natalia Ponomareva, Sertan Girgin, tion, 2(CSCW):1–23.
Reshu Jain, and Christoph Oehler. 2017. Text based
user comments as a signal for automatic language Young Bin Kim, Jun Gi Kim, Wook Kim, Jae Ho Im,
identification of online videos. In Proceedings of the Tae Hyeong Kim, Shin Jin Kang, and Chang Hun
19th ACM International Conference on Multimodal Kim. 2016. Predicting fluctuations in cryptocur-
Interaction, pages 374–378. rency transactions based on user comments and
replies. PloS one, 11(8):e0161197.
Carsten Eickhoff, Wen Li, and Arjen P De Vries. 2013.
Exploiting user comments for audio-visual content Sumeet Kumar and Kathleen Carley. 2019. Tree
indexing and retrieval. In European Conference on LSTMs with convolution units to predict stance
Information Retrieval, pages 38–49. Springer. and rumor veracity in social media conversations.
In Proceedings of the 57th Annual Meeting of the
Emilio Ferrara. 2020. What types of covid-19 conspir- Association for Computational Linguistics, pages
acies are populated by Twitter bots? First Monday. 5047–5058, Florence, Italy. Association for Compu-
tational Linguistics.
Katja Filippova and Keith B Hall. 2011. Improved
video categorization from text metadata and user Heidi Oi-Yee Li, Adrian Bailey, David Huynh, and
comments. In Proceedings of the 34th international James Chan. 2020. YouTube as a source of infor-
ACM SIGIR conference on Research and develop- mation on covid-19: a pandemic of misinformation?
ment in Information Retrieval, pages 835–842. BMJ Global Health, 5(5).
Sheera Frenkel, Ben Decker, and Davey Alba. 2020.
How the ’plandemic’ movie and its falsehoods Quanzhi Li, Qiong Zhang, Luo Si, and Yingchi Liu.
spread widely online. 2019. Rumor detection on social media: Datasets,
methods and opportunities. In Proceedings of the
Tarleton Gillespie. 2018. Custodians of the Internet: Second Workshop on Natural Language Processing
Platforms, content moderation, and the hidden de- for Internet Freedom: Censorship, Disinformation,
cisions that shape social media. Yale University and Propaganda, pages 66–75, Hong Kong, China.
Press. Association for Computational Linguistics.
Pankaj Gupta, Khushbu Saxena, Usama Yaseen, Yinhan Liu, Myle Ott, Naman Goyal, Jingfei Du, Man-
Thomas Runkler, and Hinrich Schütze. 2019. Neu- dar Joshi, Danqi Chen, Omer Levy, Mike Lewis,
ral architectures for fine-grained propaganda detec- Luke Zettlemoyer, and Veselin Stoyanov. 2019.
tion in news. In Proceedings of the Second Work- Roberta: A robustly optimized bert pretraining ap-
shop on Natural Language Processing for Internet proach. arXiv preprint arXiv:1907.11692.Elaheh Momeni, Claire Cardie, and Myle Ott. 2013. Svitlana Volkova, Kyle Shaffer, Jin Yea Jang, and
Properties, prediction, and prevalence of useful user- Nathan Hodas. 2017. Separating facts from fic-
generated comments for descriptive annotation of so- tion: Linguistic models to classify suspicious and
cial media objects. In Seventh International AAAI trusted news posts on Twitter. In Proceedings of the
Conference on Weblogs and Social Media. 55th Annual Meeting of the Association for Compu-
tational Linguistics (Volume 2: Short Papers), pages
Souneil Park, Minsam Ko, Jungwoo Kim, Ying Liu, 647–653.
and Junehwa Song. 2011. The politics of comments:
predicting political orientation of news stories with Sumio Watanabe and Manfred Opper. 2010. Asymp-
commenters’ sentiment patterns. In Proceedings of totic equivalence of Bayes cross validation and
the ACM 2011 conference on Computer supported widely applicable information criterion in singular
cooperative work, pages 113–122. learning theory. Journal of machine learning re-
search, 11(12).
Verónica Pérez-Rosas, Bennett Kleinberg, Alexandra
Lefevre, and Rada Mihalcea. 2018. Automatic de- Zhilin Yang, Zihang Dai, Yiming Yang, Jaime Car-
tection of fake news. In Proceedings of the 27th bonell, Russ R Salakhutdinov, and Quoc V Le. 2019.
International Conference on Computational Linguis- Xlnet: Generalized autoregressive pretraining for
tics, pages 3391–3401, Santa Fe, New Mexico, USA. language understanding. In Advances in neural in-
Association for Computational Linguistics. formation processing systems, pages 5753–5763.
Kashyap Popat, Subhabrata Mukherjee, Andrew Yates, Xinyi Zhou and Reza Zafarani. 2018. Fake news: A
and Gerhard Weikum. 2018. DeClarE: Debunking survey of research, detection methods, and opportu-
fake news and false claims using evidence-aware nities. arXiv preprint arXiv:1812.00315.
deep learning. In Proceedings of the 2018 Confer-
ence on Empirical Methods in Natural Language
Processing, pages 22–32, Brussels, Belgium. Asso-
ciation for Computational Linguistics.
Vahed Qazvinian, Emily Rosengren, Dragomir Radev,
and Qiaozhu Mei. 2011. Rumor has it: Identifying
misinformation in microblogs. In Proceedings of the
2011 Conference on Empirical Methods in Natural
Language Processing, pages 1589–1599.
Sarah T Roberts. 2019. Behind the screen: Content
moderation in the shadows of social media. Yale
University Press.
Victoria Rubin, Niall Conroy, Yimin Chen, and Sarah
Cornwell. Fake news or truth? using satirical cues
to detect potentially misleading news.
Kai Shu, Amy Sliva, Suhang Wang, Jiliang Tang, and
Huan Liu. 2017. Fake news detection on social me-
dia: A data mining perspective. ACM SIGKDD ex-
plorations newsletter, 19(1):22–36.
B Silverman. 2019. Crowdtangle for academics and
researchers.
Yla R Tausczik and James W Pennebaker. 2010. The
psychological meaning of words: Liwc and comput-
erized text analysis methods. Journal of language
and social psychology, 29(1):24–54.
James Thorne and Andreas Vlachos. 2018. Automated
fact checking: Task formulations, methods and fu-
ture directions. In Proceedings of the 27th Inter-
national Conference on Computational Linguistics,
pages 3346–3359, Santa Fe, New Mexico, USA. As-
sociation for Computational Linguistics.
Aki Vehtari, Andrew Gelman, Daniel Simpson, Bob
Carpenter, and Paul-Christian Bürkner. 2019. Rank-
normalization, folding, and localization: An im-
proved r for assessing convergence of mcmc. arXiv
preprint arXiv:1903.08008.You can also read