Optimizing NVMe over Fabrics (NVMe-oF) - SNIA
←
→
Page content transcription
If your browser does not render page correctly, please read the page content below
Storage Networking Industry Association

                                Optimizing NVMe® over Fabrics (NVMe-oF™)
                                       Comparing Performance of Different Transports with
                                     Host Factors using Synthetic & Real-World Workloads

                                                                                                      White Paper
                                                                                                       April 2021

AUTHORS:
Eden Kim, Calypso Systems, Inc.
Fred Zhang, Intel Corp.

ABSTRACT:
NVMe® over Fabrics (NVMe-oF™) performance is compared using RDMA (iWARP &
RoCEv2) and TCP transports across 100Gb Ethernet. Synthetic and real-world workloads
are applied across different Fabrics to a storage target using both standard (1500B) and
jumbo (9000B) MTU frames. Performance is compared between a six-SSD 3D XPointTM
LUN and a 6-SSD 3D NAND LUN. Results show the impact of different workloads (synthet-
ic corner case and real-world workloads), RDMA & TCP transport mechanisms (CPU
onload vs CPU offload) and different types of storage LUNs (3D XPoint vs 3D NAND).

                       COMPUTE, MEMORY,
                       AND STORAGE

    ©2021 SNIA. All Rights Reserved. All trademarks and copyrights are retained by their original holders.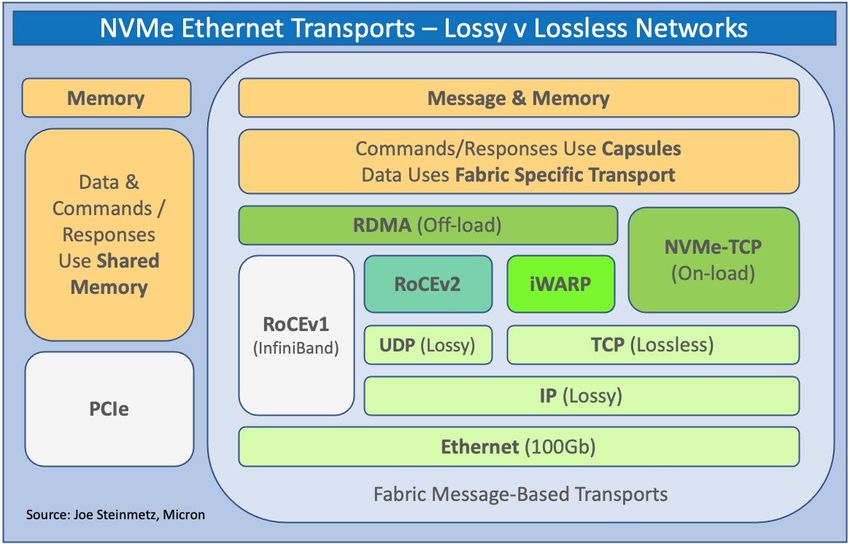
Spring 2021                                                     Back to Contents                                                            Rev 1.0

                                                        Table of Contents
Background ..................................................................................................................................... 4
SNIA Resources ............................................................................................................................... 4
I. Abstract ....................................................................................................................................... 5
II.    Introduction – NVMe over Fabrics (NVMe-oF) ...................................................................... 6
       A. NVMe-oF: What is it? .......................................................................................................... 6
       B. Know your NVMe-oF transports: What’s the difference? .................................................. 6
           Remote Direct Memory Access (RDMA) .......................................................................... 6
           Best Effort vs. Lossless Networks..................................................................................... 6
           iWARP .............................................................................................................................. 6
           RoCE (RDMA over Converged Ethernet) .......................................................................... 7
           TCP ................................................................................................................................... 7
       C. RoCEv2 v iWARP – UDP v. TCP ............................................................................................ 8
       D. NVMe-oF: How Mature is It? .............................................................................................. 8
III. Factors Impacting Different Ethernet Transport Performance ............................................. 9
       A. Scope of Discussion ............................................................................................................. 9
            Host .................................................................................................................................. 9
            Switch ............................................................................................................................... 9
            Network ........................................................................................................................... 9
       B. Onload vs Offload ............................................................................................................... 9
       C. MTU: 1500B v 9000B ........................................................................................................ 10
       D. Individual Drive Level Factors ........................................................................................... 10
            Individual Drive Manufacturer Specifications – 3D XPoint v 3D NAND SSD .................. 11
IV. Test Comparison: iWARP v RoCEv2 v TCP ............................................................................ 12
       A. Test Plan ............................................................................................................................ 12
            Objectives....................................................................................................................... 12
            Host Factors across Initiator & Target Server ................................................................ 12
            Test Topology ................................................................................................................. 12
       B. Test Workloads ................................................................................................................. 13
            Synthetic Corner Case Workloads ................................................................................. 13
            Real-World Workloads ................................................................................................... 13
            Visualizing Real-World Workloads using IO Stream Maps ............................................ 13
            Real-World Workload Comparison Table ...................................................................... 14
            Retail Web Portal ........................................................................................................... 15
            GPS Navigation Portal .................................................................................................... 16
            VDI Storage Server Cluster ............................................................................................. 17
       C. Test Set-Up ........................................................................................................................ 18
            Normalization for NVMe-oF Host Factors. .................................................................... 18
NVMe-oF White Paper                                                      2                                               SNIA CMSI/NSF 2021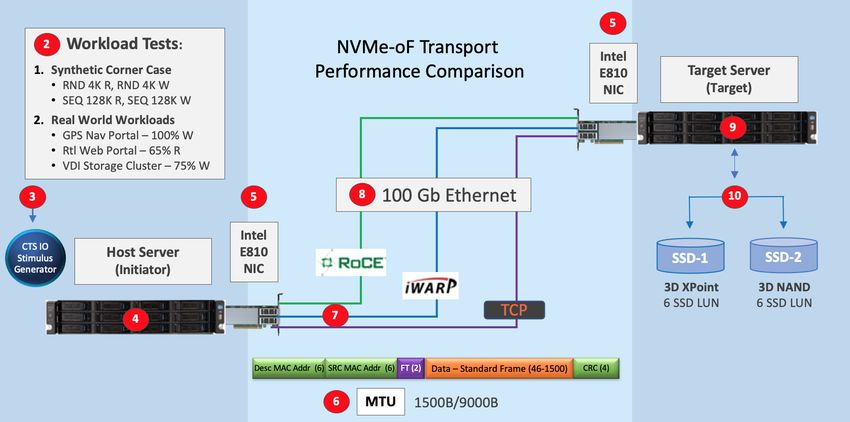
Spring 2021                                                    Back to Contents                                                         Rev 1.0

              Control PC, Database & CTS Scripting. ........................................................................... 18
              CTS IO Stimulus Generator. ........................................................................................... 18
              Host Initiator Intel Server. ............................................................................................. 18
              Intel Ethernet Network Adapter E810-CQDA2. ............................................................. 18
              100Gb Ethernet Cable. ................................................................................................... 18
              Target Server. ................................................................................................................. 18
              Target Storage LUNs. ..................................................................................................... 18
      D. Test Methodology ............................................................................................................. 19
           Metrics ........................................................................................................................... 20
           Real-World Workload IO Capture Methodology ........................................................... 20
           Pre-Conditioning & Steady State ................................................................................... 20
           Synthetic Corner Case Benchmark Tests ....................................................................... 20
           Real-World Workload Replay Test ................................................................................. 21
           Real-World Workload TC/QD Sweep Test ..................................................................... 21
           Test Flow ........................................................................................................................ 22
      E. Test Results ....................................................................................................................... 23
           Synthetic Corner Case: RND 4K & SEQ 128K RW ........................................................... 23
           Real-World Workloads: Replay Test .............................................................................. 24
           Real World Workloads: TC/QD Depth Sweep Test ........................................................ 25
           3D XPoint Storage LUN v 3D NAND Storage LUN .......................................................... 26
V.    Conclusions ........................................................................................................................... 27
About the Authors ........................................................................................................................ 28
      Fred Zhang, Intel Corp. .......................................................................................................... 28
      Eden Kim, CEO Calypso Systems, Inc. .................................................................................... 28

Appendix A: Transport Comparison - Synthetic Workloads ....................................................... 29
Appendix B: Transport Comparison - Real World Workloads .................................................... 29

NVMe-oF White Paper                                                    3                                              SNIA CMSI/NSF 2021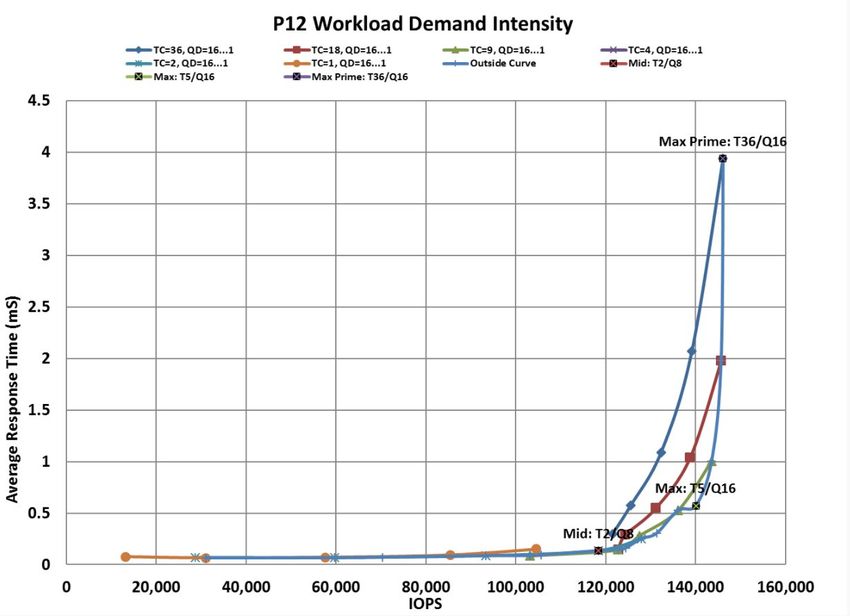
Spring 2021                                            Back to Contents                                              Rev 1.0

Background
                       White Paper Companion & Update to SNIA/Brighttalk Webcast
           This white paper is a companion and update to the SNIA/Brighttalk Webcast “Optimizing NVMe-oF Performance
 with different Transports: Host Factors” broadcast on September 15, 2020. This webcast was moderated by Tom Friend,
 principal at Illuminosi, with an introduction by David Woolf, University of New Hampshire. Webcast presenters were Fred
 Zhang, Intel Corp. and Eden Kim, Calypso Systems, Inc.
          In addition to the synthetic Random 4KB & Sequential 128KB Read/Write corner case workloads and the real-world
 GPS 100% Write Navigation Portal workload presented in the webcast, this white paper is updated with two additional real-
 world workloads: Retail Web 66% Read Portal and VDI 75% Write Storage Server Cluster.
           This white paper is a collaboration between the SNIA NSF (Networking Storage Forum), the SNIA SSS TWG (Solid
 State Storage Technical Working Group) and the SNIA CMSI (Compute, Memory & Storage Initiative).
         Click on the following to view the webcast, download the presentation or download the Questions & Answers to
 the Webcast. Questions concerning this white paper can be sent to Fred.zhang@intel.com or edenkim@calypsotesters.com.

              Tom Friend                 Fred Zhang                      Eden Kim                     David Woolf
               Illuminosi                Intel Corp.                Calypso Systems, Inc.         Univ. New Hampshire

SNIA Resources

                                                    SNIA Resources
           The Storage Networking Industry Association (SNIA) is non-profit global organization dedicated to developing
 standards and education programs to advance storage and information technology. The mission of the Compute, Memory &
 Storage Initiative (CMSI) is to support the industry drive to combine processing with memory and storage and to create new
 compute architectures and software to analyze and exploit the explosion of data creation over the next decade. The mission
 of the Networking Storage Forum (NSF) is to drive the broad adoption and awareness of storage networking solutions.
          SNIA, CMSI and the NSF can be found at snia.org, http://www.snia.org/forums/cmsi and at
 www.snia.org/forums/nsf/technology. Recent white papers can be found at the SNIA Educational Library while podcasts can
 be heard at snia.org/podcasts. SNIA related videos can also be seen at the SNIAVideo YouTube Channel.
           The NVMe website can be found at www.nvmexpress.org, the NVMe Specification can be found at
 www.nvmexpress.org/developers/nvme-specification/, and the NVMe-oF Specification can be found at
 https://nvmexpress.org/developers/nvme-of-specification/.
          SNIA Technical works including Performance Test Specifications (PTS), can be found at
 https://www.snia.org/tech_activities/work.
           Additional information about SNIA, CMSI or NSF can be found at https://www.snia.org/resources or email can be
 sent to askcmsi@snia.org.

NVMe-oF White Paper                                           4                                     SNIA CMSI/NSF 2021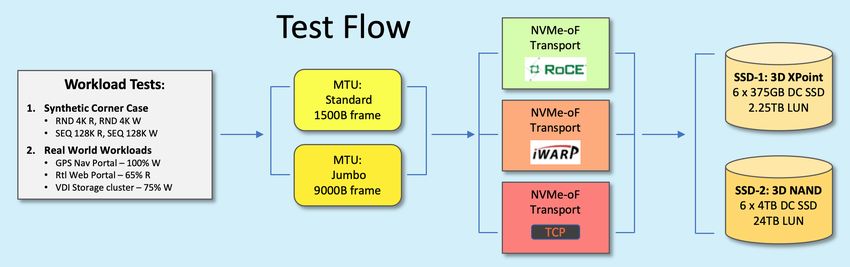
Spring 2021                                     Back to Contents                                          Rev 1.0

I. Abstract
       NVMe over Fabrics (NVMe-oF) storage is becoming more popular as different Fabrics transports
become available. This white paper examines various performance characteristics of different Ethernet
NVMe-oF transports: RDMA (iWARP & RoCEv2) and TCP.
         In this comparison, we apply both synthetic corner case and real-world workloads. Test IOs are
applied across 100GbE NVMe-oF Fabric from the Host Initiator server to the Target Storage server. We test
two types of storage that are directly attached to the Target Server – a six-drive 3D XPoint and a six-drive 3D
NAND Logical Storage Unit (LUN). Test set-up and conditions are normalized to isolate the impact of Host
factors on performance comparisons.
         Performance analysis is conducted to compare three key metrics:
              •   Maximum Transmission Unit (MTU) frame size (standard v. jumbo frames),
              •   3D XPoint six-SSD vs 3D NAND six-SSD LUNs
              •   Synthetic vs real-world workloads across iWARP, RoCEv2 & TCP transports
        Synthetic workloads are comprised of random 4K Read/Write (RND 4K R/W) and sequential 128K
Read/Write (SEQ 128K R/W) IOs. Real-world workloads are taken from a GPS Nav Portal (100% Write), a VDI
Storage Cluster (75% Write) and a Retail Web Portal (65% Read).
         Results show substantially similar performance for both standard 1500B (byte) frame and jumbo
9000B frame MTU. The 3D XPoint storage LUN shows substantially higher performance than the 3D NAND
storage LUN. RDMA transports (iWARP and RoCEv2), with CPU offload, show significantly higher performance
than TCP without CPU offload. RoCEv2 shows slightly lower IO Response Times than iWARP. These tests were
all done with the specified hardware and using different network cards could potentially yield different
results. Third party testing has shown that using a full NVMe/TCP hardware offload may result in better
performance and latency for NVMe/TCP, approximately equivalent to that of RDMA.
         iWARP and RoCEv2 show higher performance against 65% Read Retail Web and 100% Write GPS Nav
portal workloads while TCP shows higher performance against 75% Write VDI Storage Cluster workloads. This
difference may be due to the different IO Stream and block size content of the respective workloads (i.e.,
different workload IO Stream content will have different performance impact on various transports and/or
storage LUNs tested in this study).

                                         Figure 1 – Set-up & Test Plan
NVMe-oF White Paper                                    5                                   SNIA CMSI/NSF 2021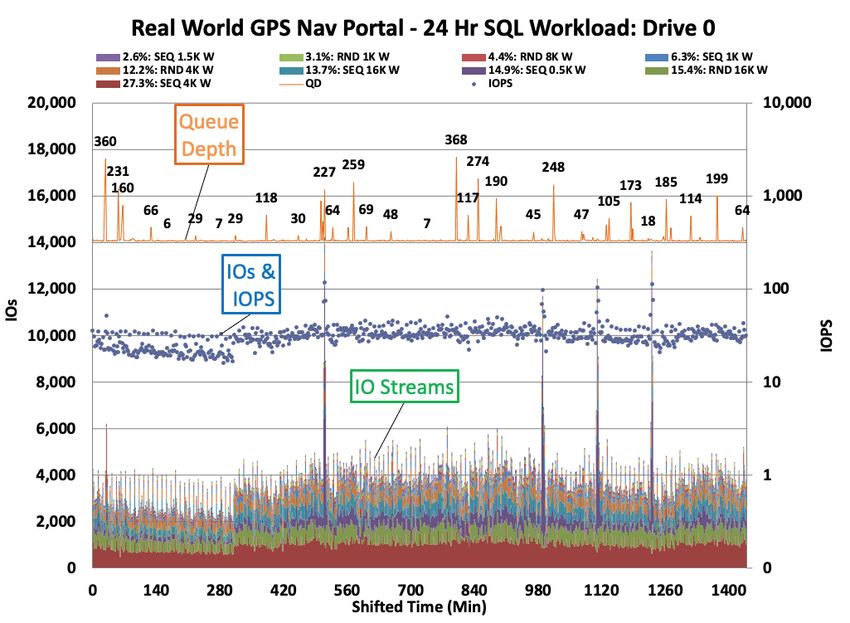
Spring 2021                                      Back to Contents                                           Rev 1.0

 II. Introduction – NVMe over Fabrics (NVMe-oF)
    A. NVMe-oF: What is it?
         NVM Express (NVMe) is the standard host controller interface for PCIe based Solid State Drives (SSD).
The NVMe over Fabrics (NVMe-oF) specification defines a protocol interface and related extensions that
enable the NVMe command set to be transmitted over interconnects such as RDMA, Fibre Channel and
others. NVMe-oF also extends NVMe deployment from a local to remote host for scale-out NVMe storage.

    B. Know your NVMe-oF transports: What’s the difference?
         There are 3 Ethernet-based transports for NVMe over Fabrics: iWARP RDMA, RoCEv2 RDMA and TCP.

         Remote Direct Memory Access (RDMA)
         Remote Direct Memory Access (RDMA) is a host-offload, host-bypass technology that enables a low-
latency, high-throughput direct memory-to-memory data communication between applications over a
network (RFC 5040 A Remote Direct Memory Access Protocol Specification). RDMA usually takes advantage
of network hardware offloads and reduces server resources typically dedicated to network functions. There
are two main implementations of RDMA on Ethernet for NVMe-oF: iWARP and RoCEv2.

         Best Effort vs. Lossless Networks
         Best Effort networks are networks that do not guarantee data can be delivered, or delivered in order,
or delivered without compromise of integrity. Internet Protocol (IP) network layer is an example of a Best
Effort network. IP networks generally rely on an upper-level protocol (e.g., TCP, or Transmission Control
Protocol) to provide additional mechanism to achieve a reliable data delivery. Such a mechanism could
include, but is not limited to, flow control and congestion management.

         Lossless networks, also called “no drop” networks, are so-called because they are designed to be
reliable and ensure that no packets will be dropped. Best effort networks, on the other hand, are defined by
their inability to guarantee delivery and, as a result, will require re-transmission in the event of packet loss.

         Lossless networks can be built on top of Best Effort networks, such as TCP over IP (TCP/IP). UDP over
IP (User Datagram Protocol over Internet Protocol or UDP/IP – see below), does not provide flow control and
congestion management, nor does it provide guaranteed delivery, thus requires additional Ethernet network
configuration or mechanisms to avoid dropping packets. These additional configurations include either
Priority Flow Control (PFC) at layer 2 (https://www.ieee802.org/1/pages/dcbridges.html) or Differentiated
Service Code Point (DSCP) PFC at layer 3 (RFC 2474 Definition of the differentiated services field in
the IPv4 and IPv6 headers, RFC 2475 An architecture for differentiated services).

         iWARP
         iWARP is a computer networking protocol that implements RDMA on top of the pervasive TCP over
IP (TCP/IP) protocol. (Note that "iWARP” is not an acronym.) iWARP is layered on Internet Engineering Task
Force (IETF) standard congestion-aware protocols such as Transmission Control Protocol (TCP) and Stream
Control Transmission Protocol (SCTP). As such, iWARP RDMA runs over standard network and transport
layers and works with all Ethernet network infrastructure that supports TCP/IP
         Since TCP provides reliable delivery, it can provide a reliable network service to upper level
applications on top of an unreliable IP network. iWARP is also known for low-latency hardware offload
engines on network adapters but such offload requires iWARP-capable network adapters.

NVMe-oF White Paper                                     6                                    SNIA CMSI/NSF 2021
Spring 2021                                    Back to Contents                                        Rev 1.0

         RoCE (RDMA over Converged Ethernet)
         Developed in 2009 by the InfiniBand Trade Association (IBTA), RoCEv1 (or RDMA over Converged
Ethernet) uses Ethernet data link layers and physical layers to support the InfiniBand (IB) transport and
network layer (Annex A16 RoCE, Supplement to InfiniBand Architecture Specification Volume 1 Release
1.2.1). RoCEv2 was further developed to operate on top of UDP/IP (Annex A17 RoCEv2, Supplement to
InfiniBand Architecture Specification Volume 1 Release 1.2.1). RoCEv2 provides low latency as well. See
Figure 2 below. Today, nearly all implementations of RoCE use RoCEv2 and the term “RoCE” generally means
RoCEv2.

            The User Datagram Protocol (UDP) is a communication protocol used across the Internet for
especially time sensitive transmissions such as video playback or DNS (Domain Name System) lookups. It
speeds up communications by not formally establishing a connection before data is transferred. This allows
data to be transferred very quickly. “The protocol is transaction oriented, and delivery and duplicate
protection are not guaranteed. Applications requiring ordered reliable delivery of streams of data should use
the Transmission Control Protocol (TCP)” (RFC768 User Datagram Protocol).
          Since UDP does not provide flow control or congestion management and RoCEv2 runs on top of UDP,
RoCEv2 typically requires Lossless Ethernet and relies on the use of Priority Flow Control (PFC) or a
congestion management solution such as Explicit Congestion Notification (ECN, RFC3168) to minimize packet
loss in the event of network congestion. RoCEv2 is ideal for deployment within one data center. RoCEv2 also
requires RoCE-capable RDMA network adapters (or rNICs) for hardware offload. There are RoCE-capable
rNICs that can deliver fast RoCE performance without requiring PFC or ECN, but this capability may be vendor
specific and might not operate across RoCE-capable NICs from different vendors.

         TCP
         TCP, or Transmission Control Protocol, is a widely accepted standard that defines how to establish
and maintain network communications when exchanging application data across a network. TCP works in
conjunction with Internet Protocol (IP), which determines how to address and route each packet to reach the
correct destination.
         NVMe over TCP (NVMe/TCP) was added to the NVMe-oF Specification v1.1. NVMe/TCP uses
standard TCP as a transport for NVMe-oF, thus it can work with any Ethernet network adapter without
additional specific requirements and without having to make network configuration changes or implement
special equipment. The TCP transport binding in NVMe-oF defines the methodology used to encapsulate and
deliver data between two hosts using normal TCP connections.
        NVMe/TCP, however, can have its downsides. For example, the specification can increase system
processor loads because TCP—in the absence of an adapter that performs TCP offload--relies on the host CPU
and OS to process the protocol stack and thus can require additional host system processing power.
        NVMe/TCP can also result in higher latency (or response time) rates because additional copies of
data must be maintained in the TCP stack. The extent of this latency depend on how the specification is
implemented and the type of workloads being supported, and may be reduced by using a network adapter
that supports TCP offload.

NVMe-oF White Paper                                   7                                  SNIA CMSI/NSF 2021
Spring 2021                                     Back to Contents                                       Rev 1.0

                                 Figure 2 – NVMe Ethernet Transports: UDP v TCP

    C. RoCEv2 v iWARP – UDP v. TCP
         iWARP and TCP are more tolerant to packet loss than RoCE. iWARP is based on the TCP/IP
architecture, which provides flow control and congestion management. Thanks to TCP, in the event of packet
loss iWARP supports selective re-transmission and out-of-order packet receive. These technologies can
further improve the performance in a Best Effort network.

         While the RoCEv2 standard implementation includes a mechanism for recovering from packet loss, it
traditionally recommends a “lossless” network because it will experience performance degradation if/when
packet loss occurs. To avoid this, RoCE usually uses Layer 2 IEEE Data Center Bridging enhancements (notably
Priority Flow Control) and/or Layer 3 ECN to minimize packet loss and ensure in-order-delivery.

    D. NVMe-oF: How Mature is It?
        NVMe-oF v1.0 specification was released in June 2016 and revised to v1.1 in October 2019 with
some refinement and the addition of TCP as a new transport. As of now, there are many Ethernet products
on the market supporting NVMe-oF.
          There is robust driver support in OS ecosystems. Linux drivers are available for NVMe-oF on both
Initiator and Target. VMware has an NVMe-oF initiator. There are also 3rd parties that are providing Microsoft
Windows NVMe-oF Initiators.
       The University of New Hampshire Inter-Operability Lab (UNH-IOL) also organizes interoperability and
conformance tests for various transports among different Ethernet product vendors.

NVMe-oF White Paper                                    8                                 SNIA CMSI/NSF 2021
Spring 2021                                      Back to Contents                                         Rev 1.0

III. Factors Impacting Different Ethernet Transport Performance
    A. Scope of Discussion
         There are many factors impacting NVMe-oF performance including Host, Switch and Network. This
white paper focuses on Host factors and we consider CPU offload vs. onload (software-based) technology,
different NVMe drive attributes and their impact on performance, and Maximum Transmission Unit (MTU)
frame size (1500B vs. 9000B) in the analysis of RDMA and TCP performance. Accordingly, our testing does not
consider Network (e.g., Switch) configurations, settings, topologies, or best practices as test variables.
         Host
        On the Host server, CPU and memory configuration impact the performance of NVMe-oF, especially
NVMe/TCP which relies on the Host OS protocol stack in software-based solutions. NVMe drive attributes
also impact the performance of NVMe-oF. Where there are no other performance bottlenecks, NVMe drive
performance can still be bottlenecked by IO R/W mix, transfer size and latency attributes present in many
workload scenarios.
         Switch
         Switch settings can impact the overall performance of NVMe-oF. The performance of NVMe-oF can
be significantly affected by buffering, oversubscription, the set-up of a dedicated traffic class, as well as
congestion control mechanisms for NVMe-oF. This is especially true for NVMe over RoCE, as RoCE usually
relies on a lossless network to support high performance. As noted above, this white paper and
corresponding test results do not attempt to suggest best practices for various switch conditions or best
practices.
         Network
         Network topologies are other factors to consider. Performance considerations include factors such
as: bandwidth over-subscription of the target storage, required fan-in ratios of Initiator and Target, Quality of
Service settings, Class of Service configurations, and numerous other conditions. As noted above, this white
paper and corresponding test results do not attempt to suggest best practices for various network conditions
or best practices.

    B. Onload vs Offload
        RDMA is a Host bypass and offload technology that results in lower CPU utilization. In NVMe over
RDMA, an RDMA engine on an RDMA Network Interface Card (RNIC) bypasses the Operating System (OS)
protocol stack and can use direct remote memory-to-memory data access.
        Traditional TCP relies on the OS kernel protocol stack. The CPU utilization might not be significant for
1Gb or 10Gb Ethernet but when the network speed moves up to 100Gb, the CPU utilization will go up
noticeably. As a result, software-based NVMe/TCP normally consumes more CPU cycles than RDMA for the
same workload due to that reliance upon the kernel.

NVMe-oF White Paper                                     9                                   SNIA CMSI/NSF 2021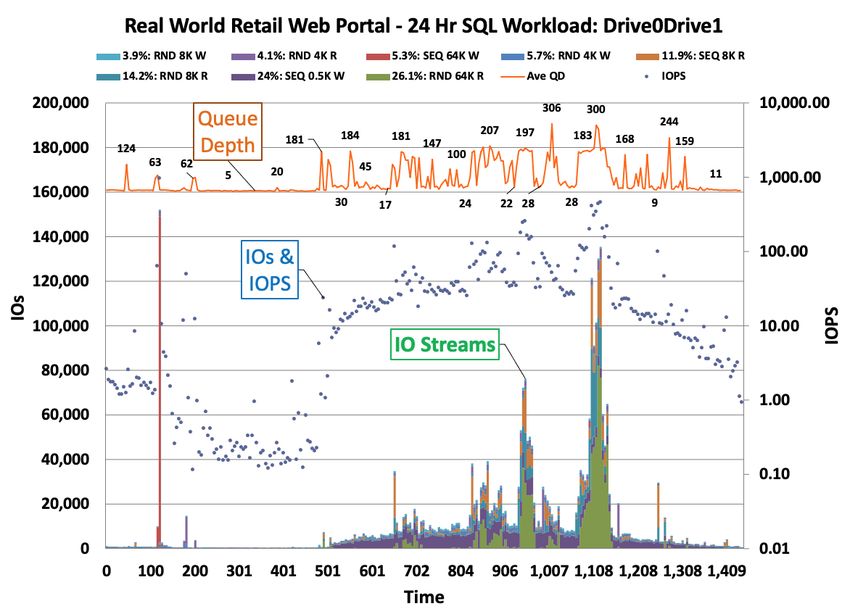
Spring 2021                                     Back to Contents                                       Rev 1.0

                                       Figure 3 – Onload v Offload Engines
        A complete TCP offload engine on network adapter would be able to achieve higher performance
with low CPU utilization.
         Note: There are also other technologies such as Storage Performance Development Kit (SPDK),
(spdk.io), that work in user space and operate in a polling mode with dedicated CPU cores to achieve high
throughput and low latency.

    C. MTU: 1500B v 9000B
          Maximum Transmission Unit (MTU) is the maximum size of the packet, at the Internet Protocol layer,
that can be transmitted over a given media without fragmentation. Ethernet frames add an additional 18
byte or 22 byte with IEEE 802.1Q tags. If jumbo frame is supported, the MTU Ethernet frame can be up to
9000 bytes (9KB). Higher MTU size might improve CPU utilization and bandwidth for large IO workloads, but
it can also potentially increase latency. The use of Ethernet jumbo frames also requires the jumbo frame
setting to be enabled on all servers, switches, and optional routers in the network to ensure proper function.

                             Figure 4 – MTU Frame Size: Standard 1500B v Jumbo 9000B

    D. Individual Drive Level Factors
        NVMe-oF is very much reliant on underlying NVMe drive performance, especially for Direct Attached
Storage (DAS). Other storage systems with storage head nodes on the Target Initiator, such as in Network
Attached Storage (NAS) devices add an additional layer of abstraction to the performance discussion. Factors
such as Policy settings, Quality-of-Service, and various Erasure Coding and RAID strategies combine with
NVMe drive performance and impact the overall performance of NVMe-oF.

NVMe-oF White Paper                                    10                                SNIA CMSI/NSF 2021
Spring 2021 Back to Contents Rev 1.0
Real-world workload IO patterns are also very different. Workloads can be Read intensive, Write
intensive or some combination of Reads (R) and Writes (W). IO Streams, which are Random (RND) or
Sequential (SEQ) R or W transfers of a specific data size, are also affected by their Demand Intensity (DI), or
Outstanding IO (OIO). Here, we use DI, OIO and Queue Depths (QD) interchangeably.
The type of underlying SSD also needs to be considered as NVMe drives perform differently based on
these factors. NVMe drives, therefore, need to be selected based on the expected IO Stream content and
Demand Intensity to deliver the best performance. Different NVMe drives are designed with different IO
characteristics and target performance ranges. Figure 5 below lists the NVMe SSD manufacturer
specifications for RND 4K R/W and SEQ 128K R or W performance used in this case study.
Individual drive level characteristics can be masked or modified by each layer of abstraction from
storage to Fabrics space and back. For example, using a large cache in front of the SSDs may reduce the
observed performance differences between using different types of SSDs. Therefore, SSD-level factors may
not have the expected impact on observed Host-level performance. Some examples of SSD-level factors
include the following:
Read-Write (RW) Mix. Small amounts of Write IOs may disproportionately impact mixed RW
workload performance. Also, drives designed for “Read or Write Intensive” workloads may be based on IO
Stream content that is markedly different from the actual application generated workload.
Block Size/Access. Small block RND and large block SEQ IO sizes may have different performance.
IO Streams. Real-world workloads comprised of mixed IO Streams can affect performance differently
than synthetic workloads that are comprised of single IO Streams and a fixed Demand Intensity (DI).
Demand Intensity (DI) Saturation. Lower DI can starve IOPS but reduce Response Times (RTs) while
higher DI can increase both IOPS & Response Times.
Storage Capacity. Smaller SSD capacity may become saturated, triggering garbage collection and RT
spikes.
Bottlenecks in IO Data Path. RTs can be impacted by each component in the IO data path making it
difficult to isolate the root cause of RT bottlenecks (see Figure 18 - Response Time Spikes).
Individual Drive Manufacturer Specifications – 3D XPoint v 3D NAND SSD
Figure 5 below lists manufacturer specifications for SSDs used in this study. While 3D XPoint SSDs
show symmetric RND 4K and SEQ 128K R/W performance, 3D NAND SSDs show asymmetric RND 4K R/W
performance. 3D XPoint SSDs have higher RND W performance and are lower capacity than the 3D NAND
SSDs. 3D NAND SSDs have higher SEQ R/W performance and are higher capacity than the 3D XPoint SSDs.
Note that the manufacturer specification optimal Queue Depth (QD) range is lower for 3D XPoint
(QD=16) than for 3D NAND (QD=256). This means that while drives can be exposed to any number of QD
jobs, the best (optimal) QD and associated performance is listed in the SSD manufacturer specification.
Manufacturer Spec RND 4K R RND 4K W SEQ 128K R SEQ 128K W
SSD-1: 3D XPoint 550,000 IOPS 550,000 IOPS 2,500 MB/s 2,200 MB/s
(6) x 375 GB SSD QD 16 QD 16 QD 16 QD 16
SSD-2: 3D NAND 636,500 IOPS 111,500 IOPS 3,000 MB/s 2,900 MB/s
(6) x 4.0 TB SSD QD 256 QD 256 QD 256 QD 256
Figure 5 - SSD Characteristics – Mfgr SSD Specifications
NVMe-oF White Paper 11 SNIA CMSI/NSF 2021Spring 2021 Back to Contents Rev 1.0
IV. Test Comparison: iWARP v RoCEv2 v TCP
A. Test Plan
Objectives
iWARP, RoCEv2 and TCP. The primary test objective in this study is to compare the performance of
iWARP, RoCEv2 and TCP transport protocols across 100Gb Ethernet. We assess the impact of RDMA
transports (iWARP and RoCEv2) that utilize CPU offload compared to traditional TCP transport without
offload (i.e., CPU onload). As noted above, we do not take into consideration additional significant factors for
solution performance, such as network topologies, QoS, switch configurations, or other network best
practices.
Workloads. The performance of synthetic corner case workloads (RND 4K RW and SEQ 128K RW) is
compared to the performance of three real-world workloads (GPS Nav Portal, Retail Web Portal and VDI
Storage Cluster). We observe the impact of synthetic workload RW mix for small block (4K) RND and large
block (128K) SEQ corner case workloads. We assess the impact of multiple IO Stream real-world workloads of
differing RW mixes (100% W v 66% R v 75% W). We also evaluate the impact of differing sequences of IO
Stream combinations and Queue Depths (QDs) over the course of the real-world workload IO Capture.
MTU. We compare standard (1500B) and jumbo (9000B) MTU frame size on performance.
Storage LUNs. We measure the difference in performance between 6-drive 3D XPoint storage LUN
and 6-drive 3D NAND SSD storage LUN (RAID 0). We consider IO access patterns (IO Stream size, RW mix and
RND or SEQ access), the ability of storage design to handle different workload types, and the ability of LUNs
to saturate 100Gb Ethernet with IOs.
Host Factors across Initiator & Target Server
We attempt to normalize Host Initiator and Target Storage server configuration and settings to
isolate the impact on performance by Host factors across 100Gb Ethernet (see test set-up below). These
Host factors include, among other items:
• CPU offload of RDMA transports (iWARP & RoCEv2) versus CPU onload transport (TCP)
• MTU frame size (standard vs jumbo)
• Test workload composition and settings (see Test Workloads & Test Methodology below)
• IO Stream content (IO transfer size, RW mix, RND or SEQ access and QD)
• Outstanding IO (OIO)/Demand Intensity (DI) – measured by Thread Count (TC) x QD
• IO Size (transfer size or block size)
• Performance across a range of Demand Intensity
Test Topology
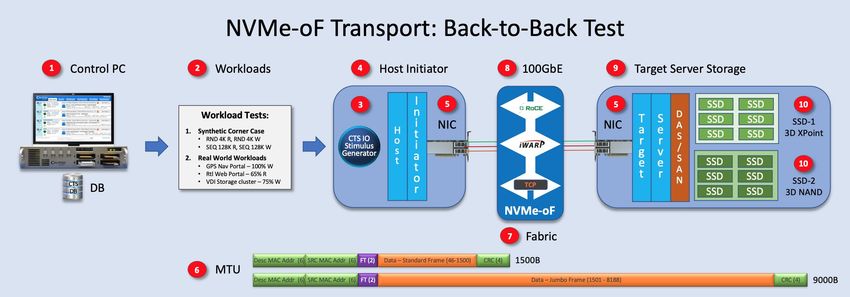
In our “Back-to-Back Test Topology” we apply test IOs from a Host across the NMVe-oF transport to
a Target without use of a Switch (see Figure 6 below). Test Workloads (2) are generated from the Calypso
Test Suite (CTS) IO Stimulus generator (3) which is mounted on the Host Initiator server (4). The CTS IO
Stimulus generator is a Calypso IO engine that allows direct, remote or Fabrics test of logical storage. The CTS
IO Stimulus generator (3) is a Linux based libaio (Asynchronous IO) which utilizes a 48-bit random number
generator to load the test threads and queues with non-repeating, random binary data.
Test scripts are generated from a CTS control server database (1,2,3). IO Stream commands, test
settings and test steps for synthetic and real-world workloads (2) are compiled from the CTS database (1) and
sent to the CTS IO Stimulus generator (3) residing on the Host Initiator server (4).
The CTS IO Stimulus generator (3) then sends test script IO commands to logical storage (10) across
the 100Gb Ethernet Fabrics (7,8) via Intel E810-CQDA2 NIC (5) to the target server (9) and the test storage LUNs
NVMe-oF White Paper 12 SNIA CMSI/NSF 2021Spring 2021 Back to Contents Rev 1.0
(10). Test result data packets are transmitted to, and archived on, the CTS Control Server database (1) for
subsequent display, reporting and data analytics.
Figure 6 – Back-to-Back Test Topology
B. Test Workloads
NVMe-oF testing applies both synthetic corner case benchmark and real-world application workloads
to 3D XPoint SSD and 3D NAND SSD LUNs.
Synthetic Corner Case Workloads
Synthetic corner case benchmark tests apply a fixed and constant workload to the target storage.
Corner case tests are designed to saturate target storage to determine performance outside the range of
normal operation and to compare IO performance against manufacturer specifications.
The “four corners” benchmark tests are typically small block RND RW (RND 4K) and large block SEQ
RW (SEQ 128K). Each IO Stream is applied independently and separately to steady state, usually at a fixed
Outstanding IO (OIO) such as OIO = 1 (T1/Q1) or OIO = 128 (T4/Q32).
Real-World Workloads
Real-world application workloads apply various combinations and sequences of IO Streams and Queue
Depths (QD) to storage, as observed from real-world workload IO captures. Each real-world workload has a
unique composition and sequence of IO Streams and QDs. These IO Streams and QDs are a constantly-changing
combination of non-typical block sizes and of varying Outstanding IO (OIO). The intent of real-world application
workload testing is to assess the performance of storage in response to an IO workload akin to that observed
during application and storage use in real-world deployment. See Figure 7: Real-World Workloads Comparison
Table below.
Visualizing Real-World Workloads using IO Stream Maps
IO Stream Maps are used to present the IO Streams, Queue Depths and IO metrics of real-world
workloads. IO Stream Maps are derived from IO captures of IO Streams that occur at a given level of the
software stack (i.e., file system or block IO) when real-world applications are run. IO Stream statistics are
averaged over a given time-step, or time interval of observation. These IO steps are then used to create an IO
Stream Map that shows IO Streams, metrics and events (Process IDs) that occurred during the IO capture. Using
IO Capture time-step statistics allows viewing of very long duration captures without the associated very large
data sets. The real-world application workload testing utilizes the IO Stream statistics derived from the IO
Captures.
NVMe-oF White Paper 13 SNIA CMSI/NSF 2021Spring 2021 Back to Contents Rev 1.0
Real-World Workload Comparison Table
Figure 7 shows the three Real-World Workloads used in this study. While every real-world workload
is unique, any workload can be generally characterized by its overall RW mix, the selected or occurring IO
Streams, total IOs, total IO Streams that occur during the capture, and by the range of QDs (Minimum,
Maximum and Median).
Each workload shows the overall RW mix of the IO Capture, the IO Capture level (file system or block
IO), the total IOs observed, the total IO Streams observed, the nine most frequently occurring IO Streams by
percentage of IOs, and the minimum, maximum and median QD of the workload.
IO Captures for multiple drives (such as 2-Drive 24-Hour or 6-Drive 12-Hour) means that the IO
Streams and metrics for each storage device are consolidated into a single composite IO Stream Map and
associated metrics and statistics. Multiple drive composite IO Stream Map consolidation is a feature of the
CTS IOProfiler toolset.
IO
Real-World RW Mix Total Total IO Min Max Median
Capture 9 Most Frequent IO Streams by % of IOs
Workload Normalized
Level
IOs Streams QD QD QD
18.5% RND 64K R 17.0% SEQ 0.5K W
Retail Web 10.0% RND 8K R 8.4% SEQ 8K R
Portal: 65% R Block IO 4.5 M 5,086 4.0% RND 4K W 3.7% SEQ 64K W 5 306 19
2-Drive, 24-hour 3.4% SEQ 64K R 2.9% RND 4K R
2.7 % RND 8K W
21.6% SEQ 4K W 12.0% RND 16K W
GPS Nav 11.7% SEQ 0.5K W 10.7% SEQ 16K W
Portal: 100% W Block IO 3.5 M 1,033 9.6% RND 4K W 4.9% RND 8K W 6 368 8
1-Drive, 24-hour 3.4% RND 8K W 2.4% RND 2K W
2.1% SEQ 1.5K W
19.3% RND 4K R 11.3% RND 4K W
VDI Storage 9.1% SEQ 4K R 8.2% SEQ 32K R
Cluster: 75% W Block IO 167 M 1,223 4.2% SEQ 128K R 3.6% RND 32K R 64 1024 128
6-Drive, 12-hour 3.3% SEQ 4K W 3.3% RND 8K R
2.3% SEQ 8K R
SNIA CMSI Reference Workloads – Retail Web Portal, GPS Nav Portal and VDI Storage Cluster workloads can be viewed at www.testmyworkload.com
Figure 7 - Real-World Workloads: Comparison Table
The Retail Web Portal (see Figure 8) can be characterized as 2-drive, 24-hour workload comprised of
different retail SQL Server events (such as morning boot storm, opening, daily activities, closing activities and
2 am back-up), a mix of different IO Streams, a range of block sizes from 0.5K to 64K, and a normalized RW
mix of 65% R IOs.
The GPS Nav Portal (see Figure 10) can be characterized as a single-drive, 24-hour workload
comprised of homogenous IO activity related to GPS Navigation, smaller block size IO Streams, occurrence of
periodic SEQ 0.5K IO spikes, and a normalized RW mix of 100% W IOs.
The VDI Storage Cluster (see Figure 12) can be characterized as a six-drive RAID 0 LUN, 12-hour
workload comprised of traditional storage block sizes (non-fragmented block sizes), IO Streams with higher
QDs (up to 1,024) and a normalized RW mix of 75% W IOs.
NVMe-oF White Paper 14 SNIA CMSI/NSF 2021Spring 2021 Back to Contents Rev 1.0
Retail Web Portal
Figure 8 below shows an IO Stream Map for a two-drive 24-hour, 66% Read Retail Web Portal which is
comprised of different activities and IO Streams over the course of the day. The x-axis indicates time, showing
both hours and key events over the 24-hour IO Capture. Each data point represents a 5-minute time-step over
which the IO statistics are averaged. The y-axis shows IOs, IOPS and IO Streams with their associated IO metrics.
Figure 8 – IO Stream Map: Retail Web Portal
Each color in the stacked columns represents a distinct IO Stream of a RND/SEQ access, block size
and RW mix. The orange line shows the average QD for each step of the IO Capture and ranges from QD=7 to
QD=306 with a median QD=19. The blue dots are IOs and IOPS that occur over the 24-hour capture.
9 IO Stream Retail Web Portal Note: The red SEQ 64K IO Stream spike at 2 am for Back-up, the
71% of 4.5M Total IOs low level of blue IOPs and IOs during early morning hours of limited use,
5,086 Total IO Streams
66% R / 34% W; Median QD=19 the purple SEQ 0.5K W dominant IO Streams during morning boot storm
and the mixed IO Streams and peak IOs and IOPS that occur over the
course of daily transactions and activities.
Figure 9 shows the Cumulative Retail Web Portal 9 IO Stream
Workload selected for display in the IO Stream Map. There were 5,086
total IO Streams observed over the 24-hour IO Capture with an overall
66:34 RW mix. The 9 most frequently occurring IO Streams represent
71% of the total 4.5 million IOs that occur.
The normalized RW mix for the 9 IO Stream workload is 65:35 RW,
i.e., while the overall workload has a 66:34 RW mix for all 5,086 IO
Streams, there are 65% Reads based on only the 9 selected IO Streams.
The 4 dominant IO Streams by % of IO occurrence are RND 64K R
(18.5%), SEQ 0.5K W (17%), RND 8K R (10%) and SEQ 8K R (8.4%). The
key characteristics of each real-world workload are summarized in Figure
Figure 9 - Rtl Web 9 IO Stream
7: Real-World Workloads Comparison Table.
NVMe-oF White Paper 15 SNIA CMSI/NSF 2021Spring 2021 Back to Contents Rev 1.0
GPS Navigation Portal
Figures 10 and 11 below show the single-drive IO Stream map and 9 IO Stream Workload for a 24-
hour GPS Navigation Portal. The IO Stream map shows a more homogenous composition and occurrence of
IO Streams as compared to the multiple event-based Retail Web Portal in Figure 8 above.
Figure 10 - IO Stream Map: 24-hour GPS Nav Portal
Note: IO Stream maps can display one or more drive IO captures. The CTS IO Stream Map feature
can combine the IO Streams and statistics from multiple concurrent drive IO captures into a single composite
IO Stream map.
9 IO Stream GPS Nav Portal Figure 10 shows four SEQ 0.5K W spikes of 12,000 IOs and a QD
78% of 3.5M Total IOs
1,033 Total IO Streams range of QD=6 to QD=368 with a median QD=8. Note that the IOs are
6% R / 94% W; Median QD=8 more tightly clustered in a band around 10,000 IOs as compared to the
Retail Web Portal IO range between 40,000 and 160,000 IOs.
The 9 most frequently occurring IO Streams represent 78% of
the total 3.5 million IOs that occur. The normalized RW mix for the 9 IO
Stream workload is 100% W, i.e., a RW mix of 100% W is observed
when based only on the 9 selected IO Streams as opposed to 94% W for
the overall 1,033 IO Streams.
Block sizes for the 9 IO Streams are smaller than the Retail
Web Portal IO Streams and range up to 16K (compared to 64 K in the
Retail Web Portal workload).
The 4 dominant IO Streams by % of IO occurrence are SEQ 4K
W (21.6%), RND 16K W (12%), SEQ 0.5K W (11.7%) and SEQ 16K W
(10.7%). See Figure 7: Real-World Workloads Comparison Table.
Figure 11 - GPS Nav 9 IO Stream
NVMe-oF White Paper 16 SNIA CMSI/NSF 2021Spring 2021 Back to Contents Rev 1.0
VDI Storage Server Cluster
Figures 12 and 13 below show the six-drive IO Stream Map and 9 IO Stream Workload for a 12-hour,
75% Write VDI 6-Drive Storage Cluster. The IO Stream map shows a homogenous composition of IO Streams
and QDs with varying IO peaks.
Figure 12 - IO Stream Map: 12-hour VDI Storage Cluster
In Figure 12 above, IOPS vary as QD changes such that there is a peak of 1.4M IOs when QD peaks at
1,024. The QD range is QD=7 to QD=1,024 with a median QD=128.
9 IO Stream VDI Storage Cluster
Note that IOs are tightly clustered in a band around 1.4 M IOs as
65% of 167 M Total IOs
1,223 Total IO Streams compared to the Retail Web Portal IO range between 40,000 and
25% R / 75% W; Median QD=128
160,000 IOs and GPS Nav Portal band of 10,000 IOs.
In Figure 13 VDI Storage Cluster Cumulative Workload, the
block sizes for the 9 IO Streams are predominantly RND/SEQ 4K RW,
RND/SEQ 8K RW with some SEQ 32K RW and SEQ 128K R. This
reflects the IO block sizes more typically associated with block IO
storage.
The 9 most frequently occurring IO Streams represent 65%
of the total IOs that occur. Here, there are 167 M IOs compared to
4.5 M and 3.5 M IOs in the Retail Web and GPS Nav Portal
workloads. The normalized RW mix for the 9 IO Stream workload is
75% W, i.e., the 75% W RW mix based only on the 9 selected IO
Streams, not on all 1,233 IO Streams.
The 4 dominant IO Streams by % of IO occurrence are RND
Figure 13 - VDI Cluster 9 IO Stream 4K R (19.3%), RND 4K W (11.3%), SEQ 4K R (9.1%) and SEQ 32K R
(8.2%). See Figure 7: Real-World Workloads Comparison Table.
NVMe-oF White Paper 17 SNIA CMSI/NSF 2021Spring 2021 Back to Contents Rev 1.0
C. Test Set-Up
Normalization for NVMe-oF Host Factors. Because IO Stream workloads and composition are
affected by each layer of software and abstraction, every effort is made to normalize the impact of the
hardware/software stack on performance measurements. This allows us to assess the impact of NVMe-oF
Fabrics transport Host Factors. See Figure 6: Back-to-Back Test Topology.
We have seen that Real-world workloads are comprised of a constantly changing combination of IO
Streams and QDs. The capture and curation of Real-world workloads thus requires faithful and accurate
compilation, reproduction and curation of IO Capture steps and IO metrics into test workloads and scripts.
Control PC, Database & CTS Scripting. The Calypso Control Server supports testing of Real-world
workloads with the Calypso Test Software (CTS) Database 4.0.1, CTS 6.5 programmatic test scripting and
IOProfiler Real-world application workload IO Capture Module 6.5. The CTS Control Server prepares and
compiles IO Captures into Real-world workload test scripts.
The CTS Control Server is a SuperMicro X11SSH-F-O LGA 1151 Micro ATX Server, Intel Xeon Quad-
Core E3-1225 v5 3.3GHz CPU, 80W 8MB L3, 32 GB 2133 Mhz DDR4 ECC RAM, 64-bit Windows 7 Pro OS,
Calypso CTS 6.5, CTS DB 4.0.1 and 10/100Mb/s Ethernet which connects remotely over TCP to the Host
Initiator server.
CTS IO Stimulus Generator. The CTS IO Stimulus generator 2.0.2 is mounted on the Host Initiator
server. Compiled test scripts are sent from the Control PC to the CTS IO Stimulus generator which then
applies test IOs to Target logical storage. Test measurement data packets are transmitted to, and archived
on, the Control Server database for subsequent replay, reporting and data analytics.
Host Initiator Intel Server. The Host Initiator is an Intel Server Board S2600WF, Intel Xeon
Platinum 8280 2.7 GHz 28 core CPU, 198 GB 2166 Mhz DDR4 ECC RAM, RHEL OS 8.1 kernel 5.7.8 and
Intel Ethernet Network Adapter E810-CQDA2.
Intel Ethernet Network Adapter E810-CQDA2. Test IOs are applied to logical storage via Host server
NIC card across 100Gb Ethernet to the Target server NIC. The Intel Ethernet Network Adapter E810-CQDA2
Network Interface Card (NIC) supports all Ethernet based transports for NVMe over Fabrics. This allows use of
a single NIC in the test set-up and eliminates the need to change NICs when there are changes in Ethernet
transports.
A single adapter can handle all Ethernet based traffic including RDMA iWARP, RDMA RoCEv2 and
standard TCP. The Intel E810-CQDA2 also features 8 SerDes and MAC which can support multiple port
configurations including: 100Gb/50Gb/25Gb/10Gb. The Intel E810 also supports up to 4x 25Gb ports or 8x 10
Gb ports per server.
100Gb Ethernet Cable. QSFP28 Direct Attach 100Gb Ethernet Cable is a high density, low power,
passive, direct attach 100Gb Ethernet cable designed for short distance direct interconnect. Here, a 1-meter
cable connects the Intel E810 NICs for the Host and Target server in a “back-to-back” (without a switch)
configuration.
Target Server. The Target server is an Intel Server Board S2600WF, Intel Xeon Platinum 8280 2.7 GHz
28 core CPU, 198 GB 2166 Mhz DDR4 ECC RAM, RHEL OS 8.1 kernel 5.7.8 and Intel Ethernet Network Adapter
E810-CQDA2.
Target Storage LUNs. Target storage consists of two separate six-drive RAID 0 LUNs. SSD-1 is
comprised of six-375 GB 3D XPoint SSDs with LUN capacity 2.25 TB. SSD-2 is comprised of six-4TB 3D NAND
SSDs with LUN capacity 24 TB. SSD-1 is a lower capacity (2.25 TB) LUN based on 3D XPoint SSDs while SSD-2 is
a higher capacity (24 TB) LUN based on 3D NAND SSDs.
NVMe-oF White Paper 18 SNIA CMSI/NSF 2021Spring 2021 Back to Contents Rev 1.0
Note: Manufacturer specified QD refers to the optimal QD setting to obtain the listed performance
values and does not indicate a minimum or maximum QD required for normal drive operation.
Test Set-Up: NVMe-oF Transport Test
Item Description Note
Calypso CTS Control Server; CTS test
CTS Software, Database & Test Scripting IO Capture; Curation & Creation of
Control Server Software 6.5; CTS Database 4.0.1;
Real-world workload scripts; Archival, Analytics & Reporting of Test Results
IOProfiler IPF 6.5
Real-World
Calypso IOProfiler (IPF) Real-World Time-step IO Capture of Real-World Application Workloads: Block IO level IO
Workload IO
Application Workload IO Capture Captures
Capture
Synthetic Corner Case RND 4K RW; SEQ 128K RW – Single Stream T4Q32
Test Workloads
Real-World Application Rtl Web; GPS Nav; VDI Storage Cluster – 9 IO Stream
IO Stimulus
CTS IO Stimulus Generator 2.0.2; Host based AIO Stimulus Generator; Application of Test IOs across NVMe-oF
Workload
Libaio 48-bit RND number generator Fabrics to Target Storage; Transmits test results data to CTS Control Server
Generator
Intel Server Board S2600WF; Intel
Host Initiator Intel Xeon 8280 2.7Ghz 28 core CPU, 198GB 2166 Mhz DDR4 ECC RAM, RHEL
Xeon Platinum 8280, single 28 core
Server 8.1 kernel 5.7.8
CPU, 198 GB DDR4 ECC RAM
Network Intel Ethernet Network Adaptor E810-CQDA2Host NIC & Target NIC; ice-1.1.3,
Intel Ethernet Network Adapter E810-
Interface Card rdma-1.1.21, NVM 2.1 0x8000433E; iWARP, RoCEv2, TCP; Link Flow Control
CQDA2Multi-transport NIC
(NIC) On
100Gb Ethernet QSFP28 Direct Attach High density, low power, passive, short distance (1.0m) direct attach 100Gb
Cable 100Gb Ethernet cable cable
Maximum
1500B Standard frame
Transmission
9000B Jumbo frame
Unit (MTU)
Ethernet RDMA (iWARP, RoCEv2) RDMA offset (iWARP, RoCEv2)
Transport TCP No RDMA non stateful offload (TCP)
Target Storage Intel Server S2600WF; single 28 core XEON 8280 2.7Ghz 28 core CPU, 198 2166 Mhz DDR4 ECC RAM, RHEL 8.1
Server CPU, 198 GB DDR4 ECC RAM kernel 5.7.8
Target Storage 3D XPoint – LUN capacity 2.25TB Mfgr Spec: RND 4K IOPS: 550K IOPS R; 550K IOPS W – QD16
LUN – SSD-1 RAID 0 SSD LUN - 6 x 375 GB SSD SEQ 128K MB/s: 2500 MB/s R; 2200 MB/s W – QD16
Target Storage 3D NAND - LUN capacity 24.0TB Mfgr Spec: RND 4K IOPS: 636K IOPS R; 111K IOPS W – QD256
LUN - SSD-2 RAID 0 SSD LUN - 6 x 4TB SSD SEQ 128K MB/s: 3000 MB/s R; 2900 MB/s W – QD256
Figure 14 - Test Set-up: NVMe-oF Transport Test
D. Test Methodology
Our Test Set-up attempts to normalize the hardware/software environment to isolate the impact of
Host Factors on NVMe-oF performance. We apply different Synthetic and Real-World Application Workloads
across two RDMA (iWARP and RoCEv2) transports and across TCP. We evaluate performance differences
using two types of storage LUNs (SSD-1 3D XPoint v SSD-2 3D NAND) and MTU frame size (standard 1500B v
jumbo 9000B).
Single IO Stream synthetic corner case tests are generated by the test software. Multiple IO Stream
Real-world application workloads are based on IO Streams observed by IO Step Capture tools, in this case at
the block IO level. IO Captures are archived in the Control Server database and used to compile three 9 IO
Stream test workloads and to create real-world workload test scripts.
Test scripts are transmitted from the Control Server database to the IO Stimulus Generator on the
Host Initiator. The IO Stimulus Generator applies test IOs across the Host Initiator NIC - 100Gb Ethernet cable
– NIC to the Target Storage LUNs (SSD-1 or SSD-2). Test measurement data packets are transmitted back
across the NVMe-oF to the Control Server database for display, data analytics, post processing and reporting.
NVMe-oF White Paper 19 SNIA CMSI/NSF 2021Spring 2021 Back to Contents Rev 1.0
Metrics
IOPS, MB/s & Response Times (RT) are referred to and used per SNIA PTS definitions. Higher IOPS &
MB/s and lower RTs indicate better performance. Average RT (ART) averages all RTs while Maximum RT
(MRT) is the single highest RT observed. “Five Nines” (5 9s) RT Quality-of-Service (QoS) evaluates 99,999 (5
9s) of each 100,000 IO RTs (or drops 1 out of every 100,000 IO RTs.) 5 9s QoS is often referred to as the “long
tail” RTs and more accurately reflects RT distributions and hence is known as the IO “Quality-of-Service”.
Outstanding IO (OIO), or Demand Intensity (DI), is the total TC x QD of the test IOs being applied to
storage at a given time. Corner case test Max OIO=128, real-world workload Replay test Max OIO ranges from
306 to 1,024 while the real-world workload TC/QD Sweep test has a Max OIO=576.
Real-World Workload IO Capture Methodology
The Real-world application workloads used herein are derived from real-world workload IO captures
taken at the block IO level using IO Capture tools. Real-world workloads are designed to assess how storage
and applications perform to the IO Streams and QDs observed during real-world application and storage use.
Real-world workload source captures are captures of IO Stream activity whose statistics are averaged
over a series of pre-defined steps, or time-steps. No personal or actual data is recorded. IO Stream metrics
are averaged for each time-step and used to characterize IO Stream activity over time periods (seconds,
hours, days or weeks) and to re-create IO Stream Maps from the database. SNIA CMSI reference source
workloads and IO Capture tools can be viewed and downloaded for free at www.TestMyWorkload.com.
Pre-Conditioning & Steady State
The Real-world workload Thread Count/Queue Depth Sweep (TC/QD Sweep) test is used as a pre-
conditioning and steady state determinant for all tests. This test is first run to steady state after which all
other tests are immediately run without a device Purge or pre-conditioning. The application of subsequent
test workloads is based on the steady state previously achieved in the initial TC/QD Sweep test.
The TC/QD Sweep test steady state is determined by applying a SEQ 128K W pre-conditioning for
twice the LUN User capacity followed by running the SNIA Real World Storage Workload (RWSW)
Performance Test Specification (PTS) steady state methodology until steady state is reached. See SNIA RWSW
PTS v1.0.7 here.
After SEQ 128K W pre-conditioning, the Applied Test Workload (or the IO Streams selected as the
test workload – see RWSW PTS Definitions 2.1.2) is run until five consecutive round measurements of the
TC/QD tracking variable meets a maximum 20% data excursion/10% slope steady state window from which
all data measurements are reported. In this case, the highest OIO (or TC/QD) combination of the Applied Test
Workload is used as the steady state tracking variable.
Synthetic Corner Case Benchmark Tests
Synthetic corner case tests are comprised of four, single IO Stream access pattern tests: RND 4K R,
RND 4K W, SEQ 128 K R and SEQ 128K W. In each case, the storage is pre-conditioned to steady state by first
applying the Real-world workload TC/QD Sweep test (see above).
After TC/QD Sweep pre-conditioning/steady state is achieved, each corner case workload is run for
10 minutes at an Outstanding IO (OIO) of 128 by setting Thread Count to 4 and Queue Depth to 32 (T4Q32).
The synthetic corner case benchmark tests are used to compare IOPS and RT QoS performance for
MTU frame size, storage LUN and NVMe-oF transport. The test results can also be used to compare NVMe-oF
LUN performance to the manufacturer performance specifications for the underlying SSDs (Figure 5 above).
NVMe-oF White Paper 20 SNIA CMSI/NSF 2021Spring 2021 Back to Contents Rev 1.0
Real-World Workload Replay Test
We run two types of Real-world workload tests in this study: Replay test and the TC/QD Sweep test.
In the Replay test, we re-create and run the sequence and combination of IO Streams and QDs observed in
the IO Capture. In the TC/QD Sweep test, we apply a fixed composite of IO Streams for each step of the
TC/QD Sweep test while varying the range of OIO (Outstanding IO or Demand Intensity) to assess IO and
response time saturation of the application and storage.
The Replay test is designed to measure how storage performs to an actual workload observed during
real-world use. Once a real-world workload is captured as an IO Capture (see IO Capture Methodology), the
time-step statistics are used to compile a Replay test script. The test script time-step duration can be set by
the user to allow for a very long real-world capture (min, hours, days) to be replayed over a shorter test
duration or for a shorter fine grain resolution capture (uSec, Sec) to be replayed over a longer test duration.
The IO operations generated and performed by the Replay test script reflect the various time-step
statistics. The Replay test script does not replicate the exact order and timing sequence of all the IO
operations as observed within the IO Capture.
Replay test results can be viewed as a “single number” (or average value across time) for easy
comparison, i.e., the comparison of IOPS, MB/s and response times averaged over an entire Replay test.
However, more importantly, the Replay test allows the test operator to observe measurements for various
subsets of time, i.e., for specific time periods, events or Process IDs (PIDs) that occur during the IO Capture.
This allows for the analysis of discrete events of interest such as back-up, boot storm, daily activities and
more.
Real-World Workload TC/QD Sweep Test
The TC/QD Sweep test is designed to evaluate real-world workload performance saturation as
Demand Intensity (or OIO) is increased. In this test, some number of IO Streams of interest, usually the
dominant IO Streams by percentage of IO occurrence over the course of the IO Capture, are used to construct
a fixed combination of IO Streams for each step of the TC/QD Sweep test. Here, we have selected the 9 most
frequently occurring IO Streams for each real-world workload as our composite Applied Test Workload. See
Figures 7, 9, 11 - 9 IO Stream Workloads and Figure 13 Real-World Workload Comparison Table.
This 9 IO Stream composite is applied to test storage for each step of test script. After pre-
conditioning the storage by applying SEQ 128K W for twice the LUN capacity, the 9 IO Stream workload is run
while changing the Demand Intensity for each one-minute period from a low OIO to a high OIO (e.g., OIO=1
to OIO=576). A steady state tracking variable, in this case OIO=576, is observed until performance stays
within a steady state window defined as no more than a 20% data excursion and 10% slope for the best linear
fit curve for five consecutive OIO rounds.
TC/QD Sweep test results are presented, and can be easily compared, as Demand Intensity (DI)
Outside (OS) Curves. The DI OS Curve presents IOPS as a function of increasing OIO. IOPS are on the x-axis
while average response times (ARTs) are on the y-axis. IOPS and ARTs are plotted in a best linear fit curve
from minimum to maximum OIO. The resultant DI OS Curve shows an increase in IOPS and ARTs as OIO
increases.
The figure of merit in a DI OS Curve is the optimal OIO point just before the “knee” of the DI OS
Curve where IOPS are high and ARTs have not yet rapidly increased. While the knee of the DI Curve is
algorithmically determined (60% slope increase formula), DI OS Curves typically show a sharp increase in
ARTs with a commensurate levelling or decrease (or “foldback”) in IOPS. See Figure 15 – Demand Intensity
Curve and Figure 16 – Demand Intensity Outside Curve below.
NVMe-oF White Paper 21 SNIA CMSI/NSF 2021You can also read