Oxygen dependence of photosynthesis and light-enhanced dark respiration studied by High-Resolution PhotoRespirometry
←
→
Page content transcription
If your browser does not render page correctly, please read the page content below
MitoFit Preprints 2021.5            doi:10.26124/mitofit:2021-0005
                                                                                Open Access

                                                           Experimental Communication

Oxygen dependence of photosynthesis and
light-enhanced dark respiration studied by
High-Resolution PhotoRespirometry
  Nora Went1,2, Marco Di Marcello1,            Erich Gnaiger1,3*
1Oroboros Instruments, Innsbruck, Austria; 2MCI Management Centre Innsbruck, Austria;
3Dept Visceral, Transplant and Thoracic Surgery, D Swarovski Research Laboratory,
Medical Univ Innsbruck, Austria
* Corresponding author: erich.gnaiger@oroboros.at
 Posted Online 2021-04-30

Abstract
                              The bioenergetic crosstalk between mitochondria
                              and chloroplasts plays a key role in maintaining
                              metabolic integrity and controlling metabolite
                              production for growth and regulation of cell
                              concentration. Dark respiration and photosynthesis
                              were measured in the green alga Chlamydomonas
                              reinhardtii at varying oxygen concentrations and
                              three cell concentrations using the NextGen-O2k with
                              the    PhotoBiology      Module.      Maximum      net
photosynthesis at a light intensity of 350 µmol∙s-1∙m-2 (blue light) was inhibited at
hyperoxia by 40 % at oxygen concentrations of 550 to 650 µM. Light-enhanced dark
respiration reached a (negative) maximum within 30 to 60 s after light-dark
transitions and was 3.5- to 4-fold higher than steady-state dark respiration
independent of O2 concentration in the range of 200 to 650 µM.
Keywords ‒ high-resolution          respirometry,   photosynthesis,   dark    respiration,
Chlamydomonas reinhardtii

High-Resolution PhotoRespirometry and cell culture
      High-resolution respirometry based on the Oroboros O2k is extensively applied to
the study of mitochondrial physiology in the biomedical field [1,2]. Real-time oxygen flux
was measured using the NextGen-O2k, a two-chamber instrument, in growth medium
TRIS at 25 °C. Light intensities (blue) were controlled with the PhotoBiology-Module in
the range from 0 to 350 µmol∙s-1∙m-2 (Figure 1). Data were recorded by DatLab 7.4.
     Algae were grown photoautotrophically in growth medium TRIS (N- and P-nutrient
replete) at 25 °C and a light intensity of 100 µmol∙s-1∙m-2 (16:8 h L:D) [3]. Six cultures
(N=6) were harvested by centrifugation at 1000 g (10 min) and diluted in TRIS.

 www.mitofit.org                                                                   1 of 4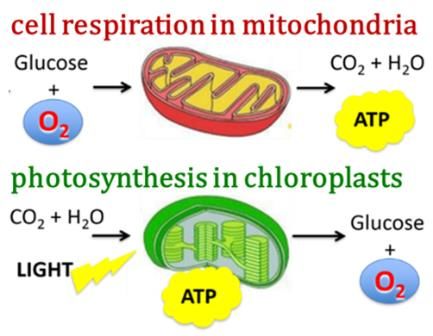
Inhibition of photosynthesis at hyperoxia

1. O2 flow as a function of the light regime and O2 concentration
                                                The net O2 production rate (net
                                             photosynthesis NP) was stimulated from
                                             dark respiration DR at normoxia to a
                                             maximum by stepwise increments of light
                                             intensity (blue light; 10 to 350
                                             µmol∙s-1∙m-2). The compensation point at
                                             zero NP was between 10 and 20
                                             µmol∙s-1∙m-2.     Light-enhanced    dark
                                             respiration LEDR was a sharp (negative)
                                             maximum of respiration immediately after
                                             switching off the light (Figure 1).
                                                1a. The O2 concentration was
                                             prevented from reaching severe hyperoxia
                                             by intermittently opening the chambers
                                             (arrows, air) and continuing the record of
                                             O2 flow per cell IO2 [amol∙s-1∙x-1] [4].
                                                1b. The O2 concentration increased in
                                             the closed chamber due to NP. The decline
                                             in maximum NP was reversed by lowering
                                             the O2 concentration.
Figure 1. O2 flow IO2 as a function of the      1c. Light-enhanced dark respiration
light regime and O2 concentration cO2.       LEDR was a sharp (negative) maximum
Superimposed traces of cO2 and IO2 in two    respiratory flux per volume JO2
O2k-chambers.         Maximum          net   [pmol∙s-1∙mL-1] at 30-60 s after light-dark
photosynthesis NP was obtained at light      transitions. Instrumental background BG
                                             indicated a small transient disturbance of
intensities of 300 to 350 µmol∙s-1∙m-2
                                             the O2 signal by switching off the light,
(vertical numbers).
                                             which was accounted for in the
                                             background correction for O2 flux.

2. Dark respiration
                                  In each of five culture harvests (experimental replica;
                                  N=5), dilution group G3 was diluted to G2. G2 was
                                  diluted further to G1. Cell concentration Cce of G3 was
                                  approximately 9∙106 x∙mL-1. Dark respiration DR
                                  expressed as O2 flow per cell [amol∙s-1∙x-1] was
                                  independent of Cce. DR is shown relative to DR of G3
                                  (Figure 2). DR was measured initially at normoxia
                                  simultaneously in two technical repeats of three cell
                                  dilutions (n=2 repeats × 3 dilution groups; Figure 3).
Figure 2. Dark respiration DR measured simultaneously in three cell dilutions,
expressed relative to dilution group G3.
 2                                                Went et al (2021) MitoFit Preprints 2021.5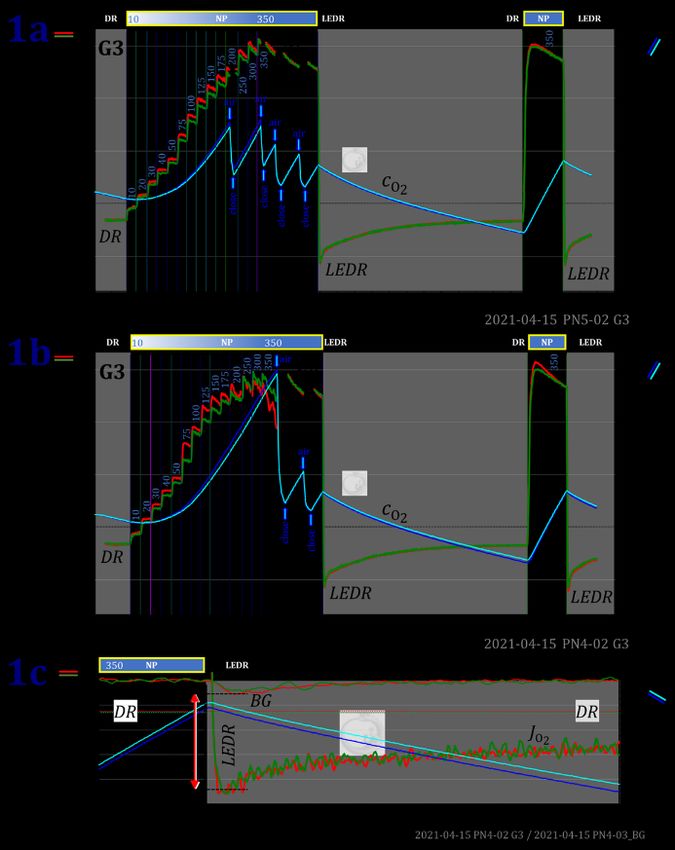
MitoFit 2021 doi:10.26124/mitofit:2021-0005

3. Maximum net photosynthesis as a function of cell concentration and
   O2 concentration
                                                 A stepwise increase of light intensity
                                              (Figure 3; vertical numbers, 10 to 350
                                              µmol∙s-1∙m-2) stimulated net photo-
                                              synthesis NP to a maximum while O2
                                              concentration increased from 220 µM to
                                              400, 520, and 550 µM depending on cell
                                              count per volume in the closed reaction
                                              chamber (Figure 3; dilution groups G1 to
                                              G3).
                                                 The lower NP capacity at higher cell
                                              concentration was caused by hyperoxic
                                              inhibition of photosynthesis (Figure 4).

                                              Figure 3. O2 flow at different cell
                                              concentrations (G1 to G3) determines
                                              O2 concentrations at increasing light
                                              intensities in the closed chamber.
                                              Superimposed        traces   of  oxygen
                                              concentration cO2 and O2 flow per cell IO2
                                              in two O2k-chambers. Maximum net
                                              photosynthesis NP was obtained at light
                                              intensities of 300 to 350 µmol∙s-1∙m-2
                                              (vertical numbers). DR returned to initial
                                              levels 2 h after the LEDR peak.

4. Oxygen dependence of net photosynthesis and light-enhanced dark
   respiration
                                                 Independent of cell concentration, NP
                                              was inhibited gradually from normoxia to
                                              severe hyperoxia by up to 40 %. There
                                              were no consistent differences between
                                              measurements in the morning (am) or
                                              afternoon (pm; Figure 4).
                                                 Light-enhanced dark respiration LEDR
                                              measured at normoxia and hyperoxia was
                                              3.5- to 4-fold higher than DR. LEDR did not
                                              significantly depend on O2 concentration
                                              (Figure 4).
Figure 4. Oxygen dependence of net photosynthesis NP and light-enhanced dark
respiration LEDR. O2 flux ratios normalized for DR. Red and green circles: data from
Figure 1a and 1b.
 www.mitofit.org                                                                      3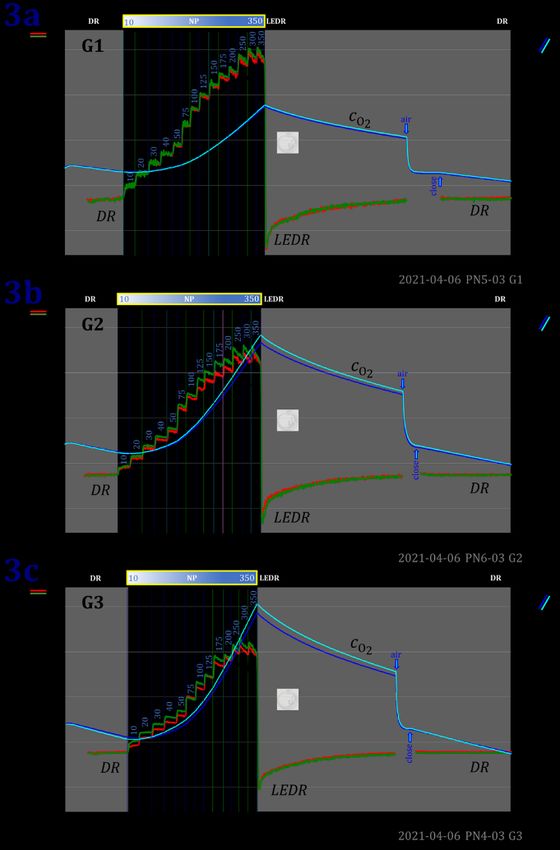
Inhibition of photosynthesis at hyperoxia

Conclusions
The decline of net O2 production under hyperoxia was not caused by compensatory light-
enhanced photorespiration LEPR, if LEDR is proportional to LEPR [5,6], but by inhibition
of photosynthesis at high oxygen concentrations. LEDR was 3.5- to 4-fold higher than
steady-state dark respiration DR. DR returned to initial levels 2 h after the LEDR peak.
Acknowledgements
                                          Presented at ISAP2021 - https://isap2020-phycology.org/. The
                                          hardware and electronics of the NextGen-O2k PB-Module was
                                          developed in collaboration with WGT-Elektronik GmbH & Co KG.
                                          We thank M. Huete-Ortega for technical support. The NextGen-O2k
                                          project has received funding from the European Union’s Horizon
                                          2020 research and innovation program under the grant agreement
                                          No 859770.

Author contributions
NW and MDM conducted and EG designed the experiment. NW and EG carried out the data analysis and co-
wrote the manuscript. All authors commented on and approved the manuscript.

Conflicts of interest
EG is founder and CEO of Oroboros Instruments, Innsbruck, Austria.

Data availability
Original files are available Open Access at Zenodo repository: 10.5281/zenodo.4729616

Abbreviations
Cce count concentration of cells [Mx∙mL-1]; cO2 amount concentration of oxygen [µM]; DR dark respiration;
JO2 oxygen flux per volume [pmol∙s-1∙mL-1]; IO2 oxygen flow per cell [amol∙s-1∙x-1]; LEDR light-enhanced dark
respiration; NP net photosynthesis

References
1.   Doerrier C, Garcia-Souza LF, Krumschnabel G, Wohlfarter Y, Mészáros AT, Gnaiger E (2018) High-
     Resolution FluoRespirometry and OXPHOS protocols for human cells, permeabilized fibers from small
     biopsies of muscle, and isolated mitochondria. Methods Mol Biol 1782:31-70.
2.   Gnaiger E (2020) Mitochondrial pathways and respiratory control. An introduction to OXPHOS
     analysis. 5th ed. Bioenerg Commun 2020.2:112 pp. doi:10.26124/bec:2020-0002
3.   Huete-Ortega M, Di Marcello M, Iglesias-Gonzalez J, Gnaiger E (2020) High-resolution respirometry for
     chloroplast and mitochondrial bioenergetics in Chlamydomonas reinhardtii ― towards biotechnology
     exploitations. MitoFit Preprint Arch EA. doi:10.26124/mitofit: ea20.algaeurope.0001
4.   Gnaiger E et al ― MitoEAGLE Task Group (2020) Mitochondrial physiology. Bioenerg Commun
     2020.1:44 pp. doi:10.26124/bec:2020-0001.v1
5.   Shimakawa G, Kohara A, Miyake C (2020) Characterization of light-enhanced respiration in
     cyanobacteria. Int J Mol Sci 22:342. doi: 10.3390/ijms22010342
6.   Xue X, Gauthier DA, Turpin DH, Weger HG (1996) Interactions between photosynthesis and respiration
     in the green alga Chlamydomonas reinhardtii. Characterization of light-enhanced dark respiration. Plant
     Physiol 112:1005–14. doi.org/10.1104/pp.112.3.1005
Copyright: © 2021 The authors. This is an Open Access preprint (not peer-reviewed) distributed
under the terms of the Creative Commons Attribution License, which permits unrestricted use,
distribution, and reproduction in any medium, provided the original authors and source are
credited. © remains with the authors, who have granted MitoFit Preprints an Open Access
publication license in perpetuity.

 4                                                                Went et al (2021) MitoFit Preprints 2021.5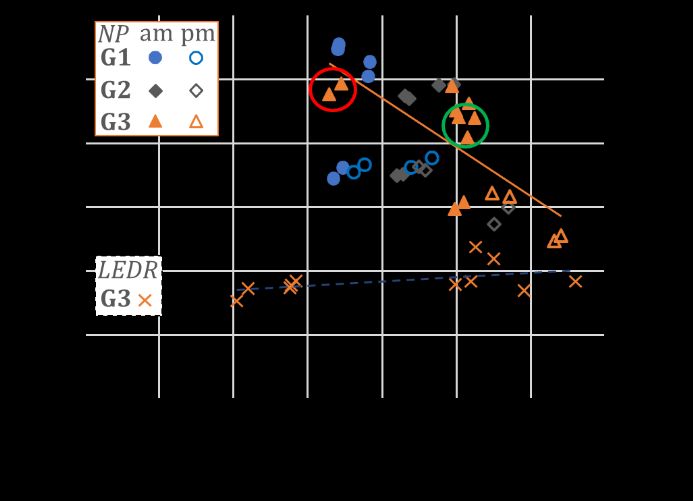
You can also read