Pathway to Zero Energy Windows - Advancing Technologies and Market Adoption April 2022 - NREL
←
→
Page content transcription
If your browser does not render page correctly, please read the page content below

Pathway to Zero Energy Windows
Advancing Technologies and Market Adoption

April 2022
Pathway to Zero Energy Windows: Advancing Technologies and Market Adoption

Disclaimer
This work was prepared as an account of work sponsored by an agency of the United States Government. Neither the
United States Government nor any agency thereof, nor any of their employees, nor any of their contractors, subcon-
tractors or their employees, makes any warranty, express or implied, or assumes any legal liability or responsibility
for the accuracy, completeness, or any third party’s use or the results of such use of any information, apparatus, prod-
uct, or process disclosed, or represents that its use would not infringe privately owned rights. Reference herein to
any specific commercial product, process, or service by trade name, trademark, manufacturer, or otherwise, does not
necessarily constitute or imply its endorsement, recommendation, or favoring by the United States Government or
any agency thereof or its contractors or subcontractors. The views and opinions of authors expressed herein do not
necessarily state or reflect those of the United States Government or any agency thereof, its contractors or subcon-
tractors.

                                                           ii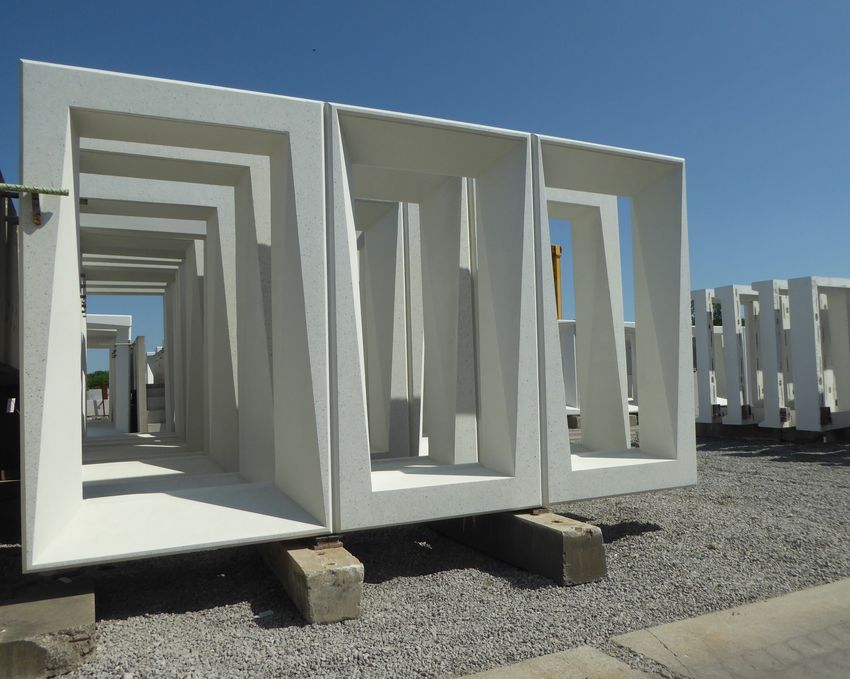
Pathway to Zero Energy Windows: Advancing Technologies and Market Adoption

Authors
The author of this report is:
           Chioke Harris, National Renewable Energy Laboratory

The technical manager of this report is:
           Marc LaFrance, U.S. Department of Energy (DOE)

The program managers providing overall guidance for this report are:
           Ram Narayanamurthy, DOE
           Erika Gupta, DOE (now with Siemens)
           Karma Sawyer, DOE (now with the Pacific Northwest National Laboratory).

Acknowledgments
The author and technical manager would like to thank the many researchers who contributed to this report as well as
the stakeholders who provided input throughout the development of this report. The authors would like to thank the
following list of contributors.
     Contributors:
           DOE: Sven Mumme and David Nemtzow
           Lawrence Berkeley National Laboratory (LBNL): D. Charlie Curcija, Luis Fernandes, Robert Hart,
           Christian Kohler, Jared Langevin, Eleanor Lee, and Steve Selkowitz
           National Renewable Energy Laboratory (NREL): Lena Burkett, Christopher CaraDonna, Shanti Pless,
           Marlena Praprost, Janet Reyna, Rob Tenent, Lance Wheeler, and Philip White
           Oak Ridge National Laboratory (ORNL): André Desjarlais, Diana Hun, Simon Pallin, and
           Som Shrestha
           Prescriptive Data: Cindy Zhu (previously a DOE ORISE Fellow)
           View, Inc.: Rob Guglielmetti (previously at NREL).

                                                         iii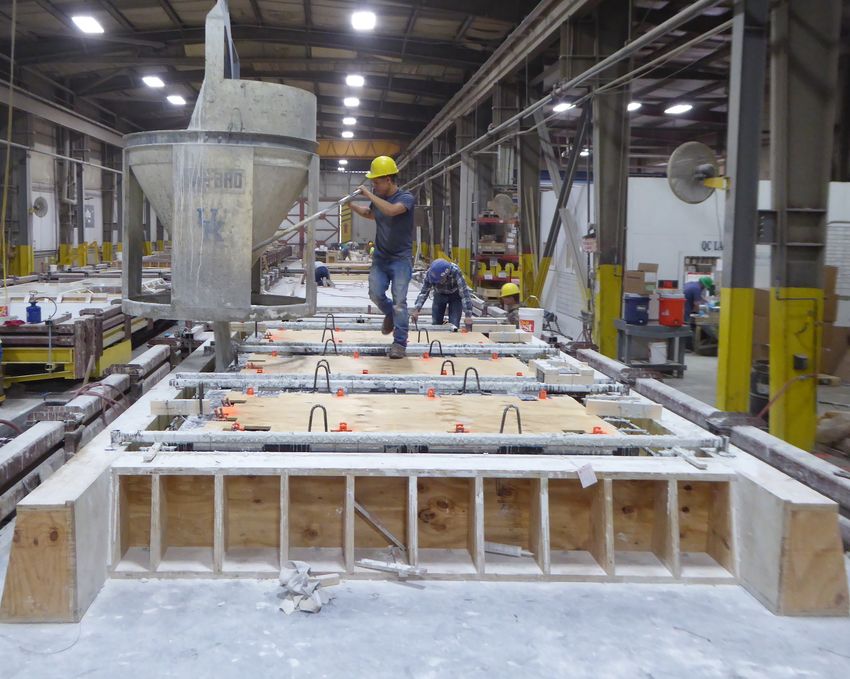
Pathway to Zero Energy Windows: Advancing Technologies and Market Adoption

List of Acronyms
 ABC              Advanced Building Construction Initiative
 BTO              Building Technologies Office
 DOE              U.S. Department of Energy
 ECM              energy conservation measure
 EERE             Office of Energy Efficiency and Renewable Energy
 EIA              U.S. Energy Information Administration
 GEB              grid-interactive efficient building
 HVAC             heating, ventilation, and air conditioning
 IGU              insulated glass unit
 ISO              independent system operator
 LBNL             Lawrence Berkeley National Laboratory
 LSG              light to solar gain ratio
 MPC              model predictive control
 NFRC             National Fenestration Rating Council
 NGO              nongovernmental organization
 NIR              near-infrared
 NREL             National Renewable Energy Laboratory
 ORNL             Oak Ridge National Laboratory
 PACE             property-assessed clean energy program
 PV               photovoltaic
 R&D              research and development
 SHGC             solar heat gain coefficient
 TRL              technology readiness level
 Tsol             solar transmittance
 Tvis             visible light transmittance
 uPVC             unplasticized polyvinyl chloride
 VIG              vacuum-insulated glazing

                                                   iv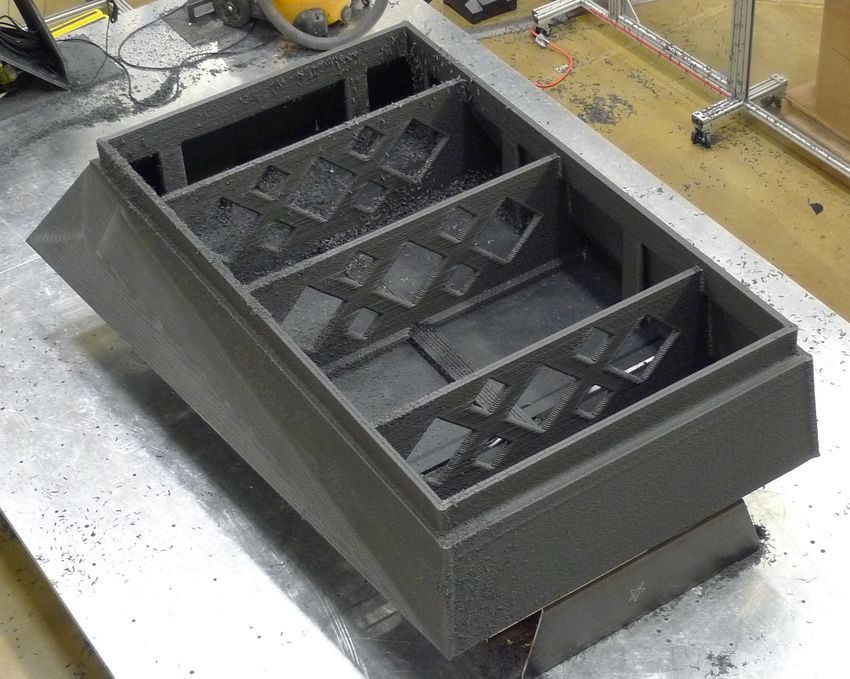
Pathway to Zero Energy Windows: Advancing Technologies and Market Adoption

Executive Summary
Background
As of 2021, buildings account for 39.1% of total U.S. primary energy use and 75% of total U.S. electricity use [1].
Much of this energy is used to maintain a comfortable indoor environment. The building envelope consists of trans-
parent and opaque elements that serve as a controllable barrier to help maintain the indoor environment regardless
of external conditions. The envelope also allows the exchange of light and air, as well as other transfers with the
external environment when it is beneficial for the building occupants. By leveraging desirable external environmental
conditions (e.g., fresh air and natural light) and mitigating the influence of undesirable conditions (e.g., moisture,
hot or cold temperatures, wind), the building envelope can reduce the need for space conditioning and electric light,
and thus reduce energy use associated with lighting and heating, cooling, and ventilation equipment. In turn, high-
performance building envelopes can reduce the substantial CO2 emissions associated with energy use to satisfy
heating, cooling, and lighting needs in buildings.
As the transparent portion of the building envelope, windows provide a visual connection for building occupants
to the surrounding environment. Windows are a critical element to creating indoor spaces that people enjoy. High-
performance windows, daylighting, and shading systems that can substantially reduce undesirable heat transfer and
air leakage compared to current typical systems have the potential to dramatically enhance occupant satisfaction.
Future high-performance transparent facade technologies could deliver a three-fold improvement in performance
over the current ENERGY STAR® specification.
This document focuses on research and development (R&D) for windows and window system technologies and
provides guidance for the U.S. Department of Energy (DOE) Building Technologies Office’s (BTO) investments—in
partnership with industry and researchers—in developing the next generation of high-performance, highly efficient,
affordable, cost competitive windows, as well as integrated daylighting and shading technologies. This document
also addresses areas where DOE invests in software and design tools that translate complex physics into easy-to-use
energy performance and optimization methods used by industry and other stakeholders for implementation.
Improving the energy performance of windows, daylighting, and shading technologies in U.S. buildings is key to
achieving aggressive climate goals that support a clean energy economy and an equitable energy future for commu-
nities across the United States. Rapid deployment and broad adoption of advanced, high-performance transparent
facade technologies are required to realize the full potential of windows to reduce energy use and carbon emissions.
In turn, continued successful market entry and widespread adoption of these technologies requires sustained, long-
term R&D investment. This document outlines multiple avenues for technology development, deployment, and
adoption to increase the impact that the transparent facade can have on these goals.
Overall, windows are responsible for 8.6% of energy use in buildings, and they influence end uses that make up
about 43% of building energy use (Figure ES-1). Although windows compose only 8% of building surface area,
they represent 45% of thermal energy transmission through the building envelope.1 Energy use associated with
windows varies widely among buildings depending on climate, building vintage, window and glazing characteristics,
window/wall ratios, and other factors.
Although windows have a significant annual energy impact, their biggest impact is on occupant comfort and on peak
electricity and natural gas use. Comfort is a major concern in cold climates where poorly insulated windows create
extreme radiant discomfort and generate cold drafts from air dropping across the surface of the glass—many building
occupants report that it feels as if the windows are open or have very large edge gaps. In hot summers, with static
glass optical properties, occupants in perimeter zones may be uncomfortably warm even with conventional blinds
and shading installed. Providing consistent visual comfort can be a challenge in all climates throughout the year
during sunny or other bright sky conditions. Highly insulating and dynamic solar control technology solutions can
solve these problems in residential and commercial buildings independent of climate, and have the potential to save
more than 1.6 quads of energy by tailoring window characteristics to align with ambient conditions and occupant
needs, thus offsetting significant energy use associated with windows.

1 See:   https://windows.lbl.gov/window-heat-transfer-fraction

                                                                 v
Pathway to Zero Energy Windows: Advancing Technologies and Market Adoption

                                   The Importance of Windows
                                 Windows provide our homes and places of work with
                              light, view, and feeling of being part of the outside world.

    ENERGY USE                                                                                            BENEFITS

                                                                                                           Peak load
    25% ofand
            heating
              cooling
        energy use
                                                                                                           reduction

                                                                                                          Thermal
    10%        of total building
               energy use
                                                                                                          comfort

                                                                                                      Visual
     8% ofarea,envelope
                  but                                                                                 comfort

                                                                                                 Resilience to extreme
    45% ofheatenvelope
                 transfer                                                                        weather conditions

                                         Figure courtesy of Cristen Farley, LBNL.

                     Residential                                                     Commercial
          Heating                                                         Heating
    Water Heating
                                                                    Refrigeration
          Cooling
     Refrigeration                                                        Cooling
   Clothes Dryers
                                                                       Ventilation
       Televisions
          Lighting                                                       Lighting
          Cooking                                               Office Electronics
                                                                        (non−PC)
 Fans and Pumps
                                                                      Computers
       Computers
         Freezers                                                  Water Heating
 Clothes Washers
                                                                         Cooking
     Dishwashers
       Other Uses                                                     Other Uses

                     0   1    2     3    4     5     6                               0   1   2   3    4    5     6
                         Primary Energy (quads)                                          Primary Energy (quads)

  Figure ES-1. Windows affect end uses (highlighted with darker bars) that compose about 43% of building
 energy use and lead directly to 8.6% of building energy use, corresponding to 3.25 quads of primary energy
                                              use (see Figure 3).
                                    Data from the EIA 2021 Annual Energy Outlook [1].

Current Technologies—Opportunities and Challenges
Modern windows provide improved thermal performance, including reduced air leakage, but also offer enhanced
amenities such as daylight, views to the outdoors, and natural ventilation. Optimizing the energy performance of

                                                           vi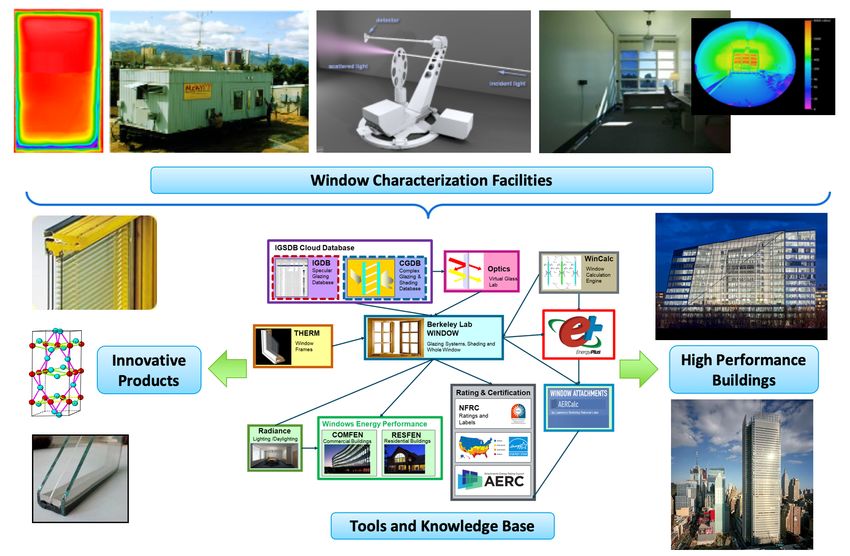
Pathway to Zero Energy Windows: Advancing Technologies and Market Adoption

windows requires taking into account heat conduction, convection, and radiation while also ensuring that aesthetic
considerations are satisfied. Opportunities exist in improving window glazing, gas filling, vacuum insulation, in-
sulating frames, and air leakage (air infiltration and exfiltration). Furthermore, improvements to dynamic facades
and glazing, fixed and operable attachments, and daylight redirection can significantly increase the value of window
systems.
BTO’s Windows Program has played a major role in the development and high market adoption of low-emissivity
(low-e) glass and improved frame performance that has resulted in today’s typical ENERGY STAR windows being
two to three times better performing than windows installed in the 1980s (Figure ES-2) [2]. The Windows Program
also played a key role in the development of dynamic glazing and the highest thermally performing windows on
the market, which offer dramatic improvements over ENERGY STAR windows with static solar control. However,
further R&D is needed to achieve the next level of performance and affordability.

                               Figure ES-2. Market share by glazing type; triple-pane is still 2%.
                                             Figure updated from Selkowitz, Hart, and Curcija [3].

R&D is needed to enable next-generation windows that have the same thermal performance of most existing build-
ings’ insulated walls,2 while also harvesting passive heating contributions in winter and rejecting unwanted solar
heat gain in summer. An R-10 (0.1 U-factor) window with dynamic glazing has the ability to be energy positive in
many climates, thus resulting in buildings with less energy use than if they did not have any windows at all.
Additional opportunities exist for whole-building modeling software tools to better capture the energy and nonenergy
impacts of window features, and to allow for outputs to be readily incorporated into building design workflows, as
well as building operation. Today, the overwhelming majority of U.S. windows are designed using DOE/Lawrence
Berkeley National Laboratory (LBNL) software tools that enable performance improvements to be assessed and
incorporated with much less impact compared to the prior approach, which required the construction of costly pro-
totypes. New software tools that clearly articulate the impact of window and window attachment performance and
design decisions on whole-building energy use, heating, ventilation, and air-conditioning (HVAC) system require-
2 Many   walls have R-11 or R-13 cavity insulation, and with structural thermal shorts have only R-10 or lower performance.

                                                                        vii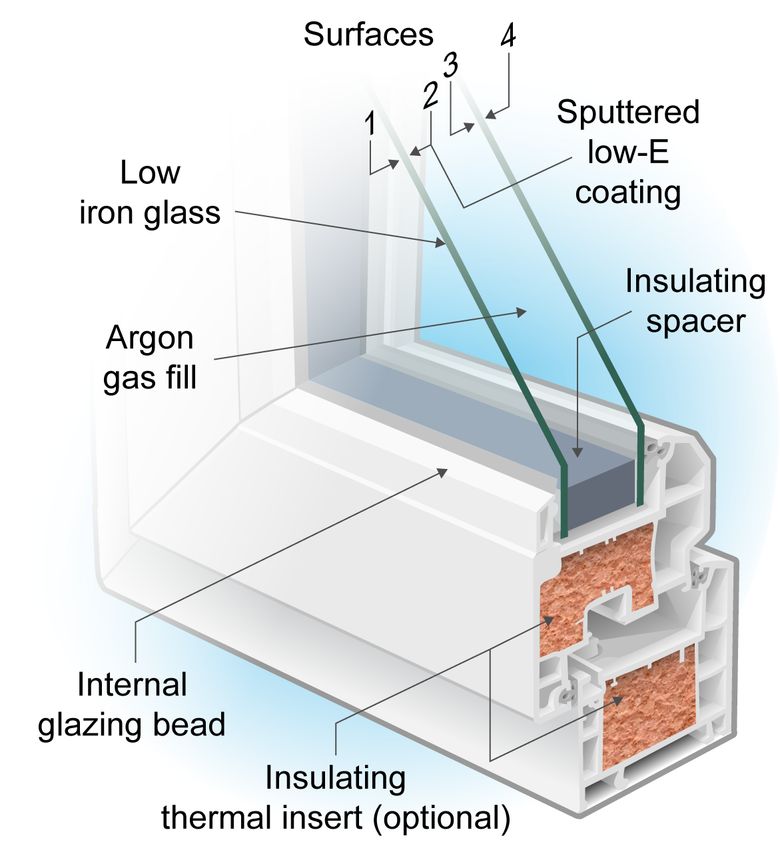
Pathway to Zero Energy Windows: Advancing Technologies and Market Adoption

ments, and nonenergy benefits like occupant visual and thermal comfort could help with customer acquisition and
could minimize value engineering of transparent facade elements that can substantially reduce energy use.

Future Technology Development
R&D, including new material discovery, novel technological approaches, as well as applied engineering, is key to
addressing many of the performance and cost challenges faced by industry to produce highly efficient affordable
windows that can achieve mainstream market acceptance. These technologies are generally expected to offer signifi-
cant energy savings compared to the current cost-effective technology, but they also have other energy and nonenergy
benefits—reduced peak load, time-shifted envelope-related thermal loads to match distributed renewable generation
availability, reduced glare, increased thermal comfort, and improved occupant satisfaction and productivity.
High-performance windows are crucial to achieving low-energy buildings. Modifications to the frame, advanced
glazing packages, and subcomponents are essential to achieving window performance that can surpass ENERGY
STAR performance by more than three times. These include advanced glazing (e.g., thin triple or vacuum-insulated
glazing [VIG]), higher-performing inert gas fills (e.g., krypton), or replacing the fill with a transparent low-conductivity
solid material and developing highly insulated window spacers and frames (Figure ES-3).

  Figure ES-3. Thin-triple-pane glazing requires production engineering and will fit in about 80% of existing
                   frames; VIGs need extensive R&D to become affordable and practical.
                                                 Photos courtesy of LBNL.

For this report, modeling helped establish price and performance targets for residential and commercial win-
dows. Table ES-1 summarizes these targets, which were guided by an energy savings analysis that includes future
energy prices, building replacement and new construction rates, window replacement rates, and projected baseline
(“business-as-usual”) improvements in window performance. The targets are based on energy savings estimates
under a technical potential scenario, which assumes immediate national adoption of the specified high-performance
windows and thus represents an upper bound on total energy savings potential.
This analysis used energy savings and the resulting utility bill savings with varying simple payback targets to de-
termine market-acceptable price premiums for given window performance levels. The savings estimates from this
analysis yield the following results: to be cost-effective in typical residential buildings, windows can have a total
installed price premium of 2.10 $/ft2 window area for 0.17 U-factor windows (assuming a 5-year payback period),
ranging to a total installed price premium of 6.60 $/ft2 window area for 0.077 U-factor windows (assuming a 10-year
payback period). These varying cost-effectiveness thresholds, defined using simple payback, allow for a range of
financing mechanisms for residential buildings to amortize the cost of window upgrades. For commercial build-
ings, total installed price premiums range from 2.70 $/ft2 window area to 10.10 $/ft2 window area for 0.17 and 0.1
U-factor windows assuming an acceptable payback of 3 and 7 years, respectively.
The difference between residential and commercial window installed price premiums is a result of the lower perfor-
mance of existing commercial windows compared to residential windows and the low rates of window performance

                                                           viii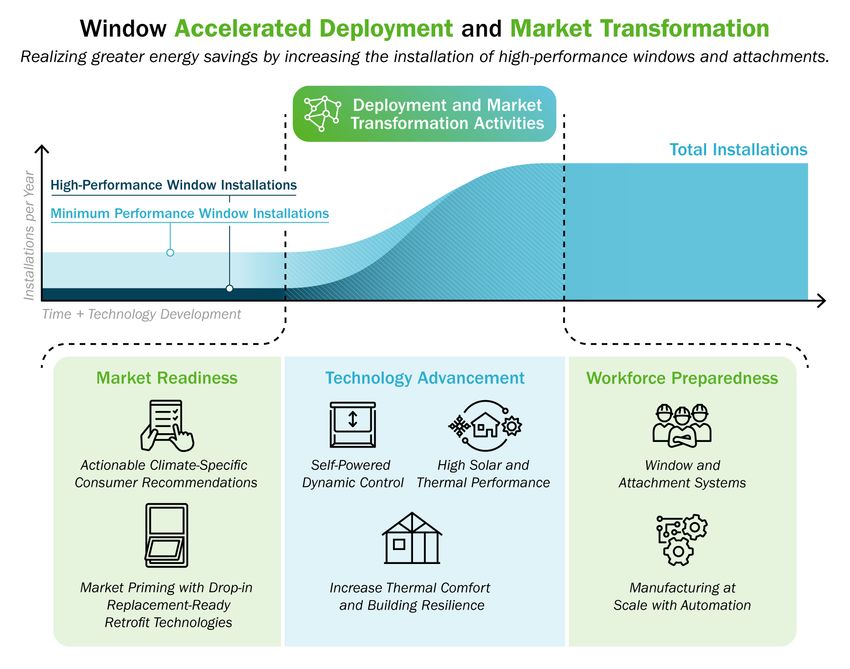
Pathway to Zero Energy Windows: Advancing Technologies and Market Adoption

upgrades in commercial buildings. The lower performance level of the existing window stock yields much larger
per-building energy savings from upgrades in commercial buildings versus residential buildings, thus yielding better
cost-effectiveness at higher installed prices. These targets are based on stock-wide performance, including both new
construction and existing buildings. In general, upgrading existing buildings with new high-performance windows
yields much greater energy savings compared to newer construction. Accordingly, primary energy savings decrease
between 2030 and 2050 because of the gradual replacement of some older buildings with new construction that, by
default, meets or exceeds projected future building energy codes. As a result, these new buildings deliver less savings
with a given upgrade (e.g., to 0.17 U-factor) than existing buildings.

 Table ES-1. Whole-window performance and installed price premium targets are based on two cost-effective
      payback period ranges (5–10 years for residential and 3–7 years for commercial buildings) and the
    corresponding primary energy savings for the upper end of the performance range in 2030 and 2050.

                                                                   Windows
                                                                                                  Primary Energy             Avoided CO2
    Building                                                      Installed Price
                             Performance                                                          Savings (quads)           Emissions (Mt)
    Sector                                                           Premium
                                                                                                   2030     2050            2030     2050
  Residential         0.17–0.077                          2.10–6.60          $/ft2 window          1.72          1.41        83.9         66.8
                                          U-Factor
  Commercial           0.17–0.1                          2.70–10.10               area             0.89          0.64        48.0         34.9

Dynamic facades and glazing, including shading systems with variable solar heat gain control characteristics in
response to diurnal and seasonal changes in heating and cooling demand, occupancy, and available daylight can
substantially lower energy use compared with static glazing. With a 10-year target payback period, high-performance
dynamic windows with an operating range between 0.05 and 0.65 solar heat gain coefficient3 are 4.30 $/ft2 window
area for residential buildings and 11.80 $/ft2 window area for commercial buildings by 2030. Ten-year payback
periods allow for higher price premiums, though such long investment periods might only be feasible for some
building owners. Buildings with the greatest energy savings potential include those with high window-wall ratios,
high perimeter to floor area ratios, older, single-pane glazing and metal frames, and significant daytime winter
heating or summer cooling needs. If all of these price and performance targets are successfully realized by 2030 and
if the technologies are applied to the entire stock by 2050, annual U.S. primary energy savings would exceed 1.6
quads, or almost 2% of total U.S. primary energy use. CO2 emissions in 2050 would be reduced by almost 68 Mt
annually, or about 1% of U.S. CO2 emissions.
Novel approaches that rely on low-cost, high-throughput production methods could reduce product costs and expand
availability of dynamic glazing and shading systems along with holistic building systems that can allow for longer
investment scenarios. Self-powering systems (e.g., using photovoltaic [PV] cells, or transparent PV for glazing)
for automated attachments and dynamic glazing would reduce installation and construction complexity while also
simplifying ongoing maintenance. Additionally, improved control methods such as model predictive control and
adaptive models using sensor inputs, user feedback, or machine learning algorithms can be used to improve energy
efficiency performance and user satisfaction over the life of the installation (Figure ES-4). More broadly, the use of
sensors and advanced controls to support the operation of high-performance dynamic facade technologies will likely
be required.
Visible light redirection increases the usability of available natural light to illuminate interior spaces. The calculated
installed price based on a technical potential scenario for light redirection systems, assuming 40% lighting energy
savings, is 3.70 $/ft2 window area added into existing windows. Light redirection systems must be designed so that
they avoid glare and thermal discomfort while still being aesthetically pleasing, and they usually require integration
with sensors and controls to turn off electric lighting when not needed. Technologies that do not depend on side-
lighting for visible light redirection have the potential to be effective for spaces with low or otherwise incompatible
ceilings and for windowless interior spaces.

3 Smalldifferences in the solar heat gain coefficient range between the target and commercialized technologies should not significantly impact
 energy savings or market-acceptable price premiums.

                                                                        ix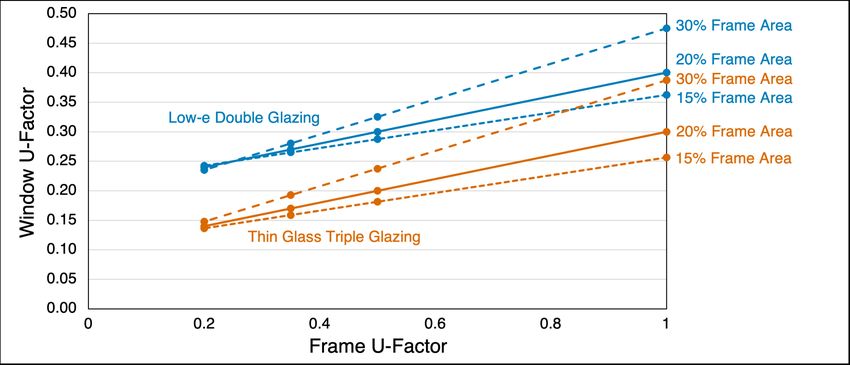
Pathway to Zero Energy Windows: Advancing Technologies and Market Adoption

  Figure ES-4. Dynamic window systems can be fully integrated with building energy management systems.
                                                            Figure courtesy of LBNL.

Accelerating Market Adoption
A small share of buildings each year receive window retrofits, and the majority of these window replacements do not
take advantage of available high-performance window technologies. Window replacements are often perceived to
be expensive, but when windows are already planned to be replaced, the incremental cost to install products with su-
perior energy performance compared to the typical new window can be quite small. The ready availability of higher
performance windows and customer and installer awareness of the additional energy and nonenergy benefits are
among the barriers to broader adoption of higher-performance windows even when window replacements are already
planned. These window replacements thus represent a missed opportunity for an energy performance upgrade for
minimal additional cost. Through a range of deployment and market transformation activities, BTO seeks to accel-
erate the adoption of high-performance transparent facade technologies, especially retrofits of existing buildings,
by increasing the total number of retrofits each year, and converting all updates to retrofits that reduce energy use
associated with windows.

Integration
The integration of advanced windows and integrated window system technologies into a building can be improved by
the consideration of holistic system-level strategies as well as incorporating technologies and business practices from
other industries. Window and opaque envelope features that can deliver energy savings also affect building occupants
and the operation of major building subsystems, including space conditioning, ventilation, and lighting.
In residential buildings, advanced windows can allow for the downsizing of mechanical equipment and eliminate the
need to run ductwork to the perimeter, typically installed above or below windows. Improved comfort and reduced
peak cooling are additional benefits of advanced windows with appropriate solar control, and dynamic solar control
can also offer passive heating in winter. Replacement of older windows can be a challenge because of high cost, but
during major renovation, integration with wall systems can allow for entire home renovation that may also lead to
increased property values. Thus, whole-house integrated solutions may offer increased financial viability and afford-
ability that can be justified based on financing at the time of purchase or refinancing for upgrade, where the energy
savings are greater than the increased monthly expenditures. These approaches are consistent with BTO’s Advanced
Building Construction (ABC) Initiative,4 which seeks automation in whole-building design and renovation.
Commercial buildings also have significant opportunities for integration that help improve comfort and reduce
HVAC system capacities. A major benefit is the ability to harvest natural daylight through automated solar control,
4 See:   https://www.energy.gov/eere/buildings/what-advanced-building-construction-initiative.

                                                                         x
Pathway to Zero Energy Windows: Advancing Technologies and Market Adoption
including dynamic glass and window shades. Integrated facade and electric lighting control systems have been
shown to reduce whole-building energy use by approximately 20% [4] while reducing peak demand by up to 25%5 .
These integrated systems can have a particularly significant effect at the perimeter of the building, where peak
period lighting demand can be reduced by 30–40%. System-level approaches can be pursued during design for new
construction, which offer the greatest financial benefit, but they also can play a key role in building renovation. For
example, secondary glazing systems can be incorporated as an upgrade to existing buildings without disrupting
occupants. Solutions today include low-e glass panels (i.e., storm windows), but in the future they could include
dynamic and vacuum glazing. Such windows could dramatically improve the thermal and optical performance of
large glass facades, and the avoided cost of full HVAC system replacement can help offset window upgrade costs.
Energy used at different times and locations will vary in cost and impacts according to the fuel used, market struc-
tures, and technological constraints. For electricity, the increasing penetration of variable renewable energy gen-
eration underscores the need for additional flexibility to facilitate balancing electricity demand and supply. Active
control of building electric loads can provide demand-side flexibility. BTO is developing a new strategy to elaborate
the potential for buildings to provide grid services through demand flexibility, which complements BTO’s continuing
focus on energy savings [5].6 Buildings that can automatically and dynamically adjust the timing of their electric-
ity use in response to time of use or real time electricity rates could yield significant utility bill savings, and these
savings could be an important benefit of windows and shading with dynamic solar control.
5 This percentage represents median non-coincident peak electricity demand reduction by building type among simulated commercial buildings
with window-wall ratios greater than 0.25.
6 See: https://www.energy.gov/eere/buildings/geb
xiPathway to Zero Energy Windows: Advancing Technologies and Market Adoption
Manually Operated Shade
Electric Power [W] 400 Lighting
Cooling
300 Other
200
100
0
Smart Control of Electrochromic Window
400 Shade base
Lighting
Electric Power [W]
300 Cooling
Other
200
100
0
00 03 06 09 12 15 18 21
Time of Day
Figure ES-5. Dynamic glazings have been field validated and show significant potential in reducing peak
electricity demand, reducing total annual energy use, and improving comfort.
Figure adapted from Gehbauer et al. [6] and photo courtesy of LBNL, Test Facility 71T.
Market Transformation and Implementation
To realize the energy savings potential of novel technologies developed for windows, these technologies must be
brought to market by companies that can market, sell, distribute, and support them, and adopted by building own-
ers, architects, and builders. Beyond window technology development, BTO conducts technical field validation of
advanced windows in collaboration with industrial partners. DOE also supports technical analyses to enable stake-
holders to pursue downstream market activities. The building construction and window industry in the United States
is a mature market with significant inertia; fundamental changes take time. Prevailing construction and building
retrofit market conditions and adjacent factors can create significant barriers to technology uptake. These barriers can
be financial, knowledge-related, or implementation-related. Approaches to addressing these barriers can include a
range of voluntary actions, marketing and information sharing strategies, and policy interventions by stakeholders as
well as technical assistance to enable industry and other stakeholders. Although the market is slow to mature, past
BTO window successes have matured and today’s window industry is producing much higher-performing products
because of this federal investment. Key market studies have estimated the economic value of the energy savings as
a result of double-pane low-e (e.g., ENERGY STAR) high market share to be $150 billion [7]. The potential for
dramatic improvements in the future is likely with continued technical innovation.
About the Building Technologies Office
The mission of BTO is to invest in R&D and additional approaches that accelerate the development and adoption of
novel technologies and practices that can improve the efficiency, reduce the energy costs, and reduce the carbon foot-
print of the nation’s residential and commercial buildings, in both the new and existing buildings markets. Research
supported by BTO is focused on reducing energy intensity and cost for technologies across the buildings sector,
while maintaining or enhancing occupant comfort, productivity, and product performance. Progress supports the
goal of reaching net-zero buildings-related carbon emissions by 2050. Achieving this goal will make building energy
costs more affordable for U.S. families and businesses.
About the BTO Emerging Technologies Program
The BTO Emerging Technologies Program7 supports R&D for technologies, systems, and software tools that con-
tribute to reductions in building energy use, improving energy efficiency to achieve targeted climate goals. The
7 See: https://www.energy.gov/eere/buildings/emerging-technologies
xiiPathway to Zero Energy Windows: Advancing Technologies and Market Adoption
Emerging Technologies Program provides R&D support in several areas: lighting; building equipment; building con-
trols; building electric appliances, devices, and systems; windows; opaque envelope; and building energy modeling.
The Emerging Technologies Program contributes to BTO’s energy use intensity reduction goal by supporting the
development of cost-effective, energy-efficient technologies. Broadly, to make significant progress toward BTO’s
goals, any next-generation envelope technologies must achieve widespread adoption. As a result, specific emphasis
is placed on developing technologies that will have market-acceptable characteristics, including payback period and
total installed price, aesthetics, durability, and sustained energy performance during the lifetime of the technology.
xiiiPathway to Zero Energy Windows: Advancing Technologies and Market Adoption
Table of Contents
Executive Summary . . . . . . . . . . . . . . . . . . . . . . . . . . . . . . . . . . . . . . . . . . . . . . . . v
1 Introduction . . . . . . . . . . . . . . . . . . . . . . . . . . . . . . . . . . . . . . . . . . . . . . . . . . 1
1.1 Buildings and Their Contribution to U.S. Energy Use . . . . . . . . . . . . . . . . . . . . . . . . . . 1
1.2 Influence of Windows on Building Energy Use . . . . . . . . . . . . . . . . . . . . . . . . . . . . . 1
1.3 U.S. Department of Energy Building Technologies Office . . . . . . . . . . . . . . . . . . . . . . . . 5
1.4 BTO Emerging Technologies Program . . . . . . . . . . . . . . . . . . . . . . . . . . . . . . . . . . 6
1.5 Organization and Purpose of This Report . . . . . . . . . . . . . . . . . . . . . . . . . . . . . . . . . 6
2 Current Technologies—Opportunities and Challenges . . . . . . . . . . . . . . . . . . . . . . . . . . . 8
2.1 Highly Insulating IGUs . . . . . . . . . . . . . . . . . . . . . . . . . . . . . . . . . . . . . . . . . . 12
2.2 High-Performance Frames . . . . . . . . . . . . . . . . . . . . . . . . . . . . . . . . . . . . . . . . 13
2.3 Dynamic Facades and Daylighting . . . . . . . . . . . . . . . . . . . . . . . . . . . . . . . . . . . . 14
2.3.1 Fixed and Operable Attachments . . . . . . . . . . . . . . . . . . . . . . . . . . . . . . . . . 15
2.3.2 Daylight Redirection . . . . . . . . . . . . . . . . . . . . . . . . . . . . . . . . . . . . . . . 15
2.3.3 Dynamic Glazing . . . . . . . . . . . . . . . . . . . . . . . . . . . . . . . . . . . . . . . . . 16
2.3.4 Dynamic Facades . . . . . . . . . . . . . . . . . . . . . . . . . . . . . . . . . . . . . . . . . 16
2.4 Characterization of Window System Performance and Benefits . . . . . . . . . . . . . . . . . . . . . 18
2.5 Cross-Cutting Barrier: Envelope Retrofit Adoption . . . . . . . . . . . . . . . . . . . . . . . . . . . 19
3 Future Technology Development . . . . . . . . . . . . . . . . . . . . . . . . . . . . . . . . . . . . . . . 22
3.1 High-Performance Windows . . . . . . . . . . . . . . . . . . . . . . . . . . . . . . . . . . . . . . . 23
3.1.1 High-Performance Glazing . . . . . . . . . . . . . . . . . . . . . . . . . . . . . . . . . . . . 25
3.1.2 Highly Insulating Window Frames . . . . . . . . . . . . . . . . . . . . . . . . . . . . . . . . 26
3.2 Dynamic Facades and Glazing . . . . . . . . . . . . . . . . . . . . . . . . . . . . . . . . . . . . . . 29
3.2.1 Reducing Manufacturing Costs . . . . . . . . . . . . . . . . . . . . . . . . . . . . . . . . . . 31
3.2.2 Increasing Spectral Selectivity . . . . . . . . . . . . . . . . . . . . . . . . . . . . . . . . . . 31
3.2.3 Wired Systems . . . . . . . . . . . . . . . . . . . . . . . . . . . . . . . . . . . . . . . . . . 32
3.2.4 Improving Dynamic Facade Component Sensors, Controls, and System Integration . . . . . . 33
3.3 Visible Light Redirection . . . . . . . . . . . . . . . . . . . . . . . . . . . . . . . . . . . . . . . . . 34
3.4 Systems-Level Performance Evaluation and Characterization of Windows . . . . . . . . . . . . . . . 37
4 Integration . . . . . . . . . . . . . . . . . . . . . . . . . . . . . . . . . . . . . . . . . . . . . . . . . . . 38
4.1 Systems-Level Approach . . . . . . . . . . . . . . . . . . . . . . . . . . . . . . . . . . . . . . . . . 38
4.1.1 Building Construction and Retrofit with a Systems-Level Approach . . . . . . . . . . . . . . 38
4.1.2 Incorporating New Technologies With Advanced Building Construction Approaches . . . . . 39
4.2 Grid-interactive Efficient Buildings . . . . . . . . . . . . . . . . . . . . . . . . . . . . . . . . . . . . 41
4.2.1 Grid Services and Dynamic Building Operations . . . . . . . . . . . . . . . . . . . . . . . . 41
4.2.2 Co-Benefit of High-Performance Windows: Energy Resilience . . . . . . . . . . . . . . . . . 42
4.2.3 GEB-Relevant Window Technologies . . . . . . . . . . . . . . . . . . . . . . . . . . . . . . 42
5 Market Transformation and Implementation . . . . . . . . . . . . . . . . . . . . . . . . . . . . . . . . 48
5.1 Technology Development Pathway . . . . . . . . . . . . . . . . . . . . . . . . . . . . . . . . . . . . 48
5.2 Facilitating Technology Adoption With Market Transformation Partners . . . . . . . . . . . . . . . . 49
5.2.1 Financing . . . . . . . . . . . . . . . . . . . . . . . . . . . . . . . . . . . . . . . . . . . . . 51
5.2.2 Window Market Awareness . . . . . . . . . . . . . . . . . . . . . . . . . . . . . . . . . . . 51
5.2.3 Whole-Building Market Awareness . . . . . . . . . . . . . . . . . . . . . . . . . . . . . . . 52
5.3 Stakeholder Engagement in Technology Implementation . . . . . . . . . . . . . . . . . . . . . . . . 53
References . . . . . . . . . . . . . . . . . . . . . . . . . . . . . . . . . . . . . . . . . . . . . . . . . . . . . 56
Appendix A Establishing Technology Performance and Price Targets . . . . . . . . . . . . . . . . . . . 62
xivPathway to Zero Energy Windows: Advancing Technologies and Market Adoption
List of Figures
Figure ES-1.Primary energy use by end use in residential and commercial buildings . . . . . . . . . . . . . . vi
Figure ES-2.Insulated glass unit (IGU) configuration market shares from 1970 to 2017 . . . . . . . . . . . . . vii
Figure ES-3.Photographs of double-pane, thin-triple-pane, and vacuum-insulated glazing . . . . . . . . . . . . viii
Figure ES-4.Dynamic transparent facade data and control flow diagram . . . . . . . . . . . . . . . . . . . . . x
Figure ES-5.Dynamic glazing impact on peak electricity demand and photograph of evaluation of dynamic
glazing in a test facility . . . . . . . . . . . . . . . . . . . . . . . . . . . . . . . . . . . . . . . . . . . . xii
Figure 1. U.S. primary energy use by sector . . . . . . . . . . . . . . . . . . . . . . . . . . . . . . . . . . 1
Figure 2. Primary energy use by end use in residential and commercial buildings . . . . . . . . . . . . . . 2
Figure 3. Primary energy use by building envelope component . . . . . . . . . . . . . . . . . . . . . . . . 3
Figure 4. Composition of the residential and commercial building stock among new and existing buildings
in 2021 and 2050 . . . . . . . . . . . . . . . . . . . . . . . . . . . . . . . . . . . . . . . . . . . . . . . 4
Figure 5. Heat transfer modes within an IGU . . . . . . . . . . . . . . . . . . . . . . . . . . . . . . . . . . 9
Figure 6. Heat transfer through window frames and the impact of thermal bridging . . . . . . . . . . . . . 10
Figure 7. Cutaway diagram of a vinyl-frame window and IGU . . . . . . . . . . . . . . . . . . . . . . . . 10
Figure 8. IGU configuration market shares from 1970 to 2017 . . . . . . . . . . . . . . . . . . . . . . . . 12
Figure 9. Window U-factor as a function of frame U-factor, frame area, and IGU type . . . . . . . . . . . . 14
Figure 10. Photographs of dynamic glazing installations . . . . . . . . . . . . . . . . . . . . . . . . . . . . 17
Figure 11. Window software tools and characterization facilities . . . . . . . . . . . . . . . . . . . . . . . . 20
Figure 12. Price premiums for residential and commercial windows as a function of U-factor and payback
period . . . . . . . . . . . . . . . . . . . . . . . . . . . . . . . . . . . . . . . . . . . . . . . . . . . . . 25
Figure 13. Arconic OptiQ window cutaway and thermal performance plot . . . . . . . . . . . . . . . . . . . 27
Figure 14. Photographs of additive manufacturing of forms for precast building facade panels . . . . . . . . 40
Figure 15. Indoor temperatures after a utility service interruption in the winter . . . . . . . . . . . . . . . . 43
Figure 16. Indoor temperatures after a utility service interruption in the summer . . . . . . . . . . . . . . . . 43
Figure 17. Hourly electric load from a home with either a typical or high-performance building envelope . . 44
Figure 18. Dynamic glazing impact on peak electricity demand . . . . . . . . . . . . . . . . . . . . . . . . 46
Figure 19. Dynamic transparent facade data and control flow diagram . . . . . . . . . . . . . . . . . . . . . 47
Figure 20. Technology commercialization process . . . . . . . . . . . . . . . . . . . . . . . . . . . . . . . 49
Figure 21. Example Home Energy Score report . . . . . . . . . . . . . . . . . . . . . . . . . . . . . . . . . 53
xvPathway to Zero Energy Windows: Advancing Technologies and Market Adoption
List of Tables
Table ES-1.Whole-Window Performance and Installed Price Premium Targets for 2030 and Corresponding
Primary Energy Savings in 2030 and 2050 . . . . . . . . . . . . . . . . . . . . . . . . . . . . . . . . . . ix
Table 1. 2016 Window Sales for Residential and Commercial Buildings . . . . . . . . . . . . . . . . . . . 3
Table 2. Residential Retrofit Projects Undertaken in 2019 in Owner-Occupied Units . . . . . . . . . . . . . 4
Table 3. Commercial Retrofit Projects Undertaken in 2012 . . . . . . . . . . . . . . . . . . . . . . . . . . 5
Table 4. Summary of Major Challenges and Opportunities by Opportunity Area . . . . . . . . . . . . . . . 8
Table 5. Whole-Window Performance and Installed Price Premium Targets for 2030 and Corresponding
Primary Energy Savings and Avoided CO2 Emissions in 2030 and 2050 . . . . . . . . . . . . . . . . . . 25
Table 6. Critical Characteristics for High-Performance Windows (IGUs and Frames) . . . . . . . . . . . . 28
Table 7. Future Research Opportunities Related to IGUs and Window Frames . . . . . . . . . . . . . . . . 29
Table 8. Dynamic Window Performance and Installed Price Premium Targets for 2030 and Corresponding
Primary Energy Savings and Avoided CO2 Emissions in 2030 and 2050 . . . . . . . . . . . . . . . . . . 30
Table 9. Critical Characteristics for Dynamic Glazing . . . . . . . . . . . . . . . . . . . . . . . . . . . . . 34
Table 10. Future Research Opportunities Related to Dynamic Glazing and Facades . . . . . . . . . . . . . . 34
Table 11. Visible Light Redirection Performance and Installed Price Premium Targets for 2030 and Corre-
sponding Primary Energy Savings and Avoided CO2 Emissions in 2030 and 2050 . . . . . . . . . . . . . 35
Table 12. Critical Characteristics of Daylighting and Visible Light Redirection Technologies . . . . . . . . . 36
Table 13. Future Research Opportunities Related to Daylighting and Visible Light Redirection Systems . . . 37
Table 14. Possible Stakeholder Supporting Activities . . . . . . . . . . . . . . . . . . . . . . . . . . . . . . 54
xviPathway to Zero Energy Windows: Advancing Technologies and Market Adoption
1 Introduction
1.1 Buildings and Their Contribution to U.S. Energy Use
Modern buildings need energy to provide heating and cooling, to operate appliances and devices, and to illuminate
spaces. The building services provided through energy use are central to the purposes that buildings serve in our
society—and this energy adds up. In 2021, residential and commercial buildings in the United States contributed
20.8 and 17 quadrillion Btu (quads), or 21.8% and 17.9%, to total U.S. primary energy use, respectively [1]. As
shown in Figure 1, residential and commercial buildings together represent more domestic energy use than either the
industrial or transportation sectors. On a primary energy basis, electricity composes a majority of building energy
use: 27.1 quads or 72% of all building energy use [1]. Direct fossil fuel use in buildings is limited to only a few end
uses, such as heating, water heating, and cooking, but still represents 10.1 quads or 26.6% of primary energy use in
buildings [1].
Buildings Residential Commercial
Industrial
Transportation
0 10 20 30 40
Primary Energy (quads)
Figure 1. Residential and commercial buildings together are the largest single sector of primary energy use in
the United States.
Data from the U.S. Energy Information Administration (EIA) 2021 Annual Energy Outlook [1].
The breakdown of energy use among building services and devices (i.e., end uses) for an individual building can vary
widely depending on the building type or function, square footage (size), local climate, and many other factors. More
generally, the division of U.S. buildings’ energy use among end uses differs between residential and commercial
buildings, as shown in Figure 2. For residential buildings, energy use is dominated by space conditioning—heating
and cooling—comprising 9.1 quads, or 44% of total residential energy use [1]. Water heating (2.9 quads, 14%) and
refrigeration (0.8 quads, 2.8%) are also significant contributors, and together with space conditioning, represent more
than 60% of total residential energy use [1]. In commercial buildings, space conditioning and mechanical ventilation
together remain the dominant end use (5.2 quads, 30%) [1]. Lighting is also a significant contributor to primary
energy use that is relevant to windows, representing 1.3 quads or 7.8% of the total in commercial buildings [1].
1.2 Influence of Windows on Building Energy Use
Both transparent (i.e., windows) and opaque (i.e., walls, roof, and foundation) components of the building envelope
protect building occupants from undesirable external environmental conditions. Some envelope elements can also
be configured to take advantage of desirable external conditions by allowing visible light, infrared radiation, or air to
pass through. Both strategies—leveraging desirable external environmental conditions and mitigating the influence
of undesirable conditions—can reduce the need for space conditioning and electric lighting, and thus reduce energy
use associated with lighting and heating, cooling, and ventilating equipment.
High-performance windows, such as those discussed in this report, have substantial potential to reduce energy use in
buildings. Data in Figure 2 show that 38% of U.S. buildings’ primary energy use is from space heating and cooling.
Figure 3 shows the breakdown of that energy use by envelope component—both windows (through heat conduction
1Pathway to Zero Energy Windows: Advancing Technologies and Market Adoption
Residential Commercial
Heating Heating
Water Heating
Refrigeration
Cooling
Refrigeration Cooling
Clothes Dryers
Ventilation
Televisions
Lighting Lighting
Cooking Office Electronics
(non−PC)
Fans and Pumps
Computers
Computers
Freezers Water Heating
Clothes Washers
Cooking
Dishwashers
Other Uses Other Uses
0 1 2 3 4 5 6 0 1 2 3 4 5 6
Primary Energy (quads) Primary Energy (quads)
Figure 2. Apart from “other uses” in commercial buildings, heating is the largest single end-use contributor
to total primary energy use in both residential and commercial buildings. When all space conditioning-related
end uses—heating, cooling, fans and pumps, and ventilation—are taken together, they represent significantly
more energy than any other end use. These end uses (along with lighting, to a lesser degree), highlighted
with darker bars, represent the energy that can be reduced with performance improvements in windows.
Data from the EIA 2021 Annual Energy Outlook [1].
and solar heat gain) and the opaque envelope.8 The opaque envelope is represented by the major building elements
where sensible heat transfer9 occurs—the roof, walls, and foundation. Air and moisture flows that carry sensible
and latent heat into or out of the building (denoted by “air leakage”) pass primarily through interfaces between
components, such as around window sashes and frames, between window frames and rough openings, between
walls and the roof and foundation, and around miscellaneous penetrations through the opaque envelope (e.g., ducts
and electrical outlets). Based on the data shown in Figure 3, for both residential and commercial buildings, the
components that offer the greatest opportunity for energy savings (meaning they represent the largest contributors
to energy use) are air leakage, walls, and conduction through windows. The data shown in Figure 3 represent U.S.
totals, and the balance of energy use among envelope components varies by climate zone. For example, solar heat
gain through windows reduces net HVAC energy use in heating-dominated climates, but not in cooling-dominated
climates. Related to this, as single-pane windows are replaced with low-emissivity (low-e) double-pane windows,
significant overall energy savings are realized, but passive solar heat gain benefits are diminished. Note that the data
in Figure 3 do not include the potential lighting energy savings from the management of visible light available from
windows or skylights to offset electric lighting needs (“daylighting”).
Taken together, windows for new construction and for retrofits of existing buildings represent a substantial market
in the United States, as shown in Table 1. Notably, in residential buildings, the retrofit market is already larger—
by number of units sold—than the new construction market. Novel technologies that are appropriate for retrofits
are therefore especially relevant to the current market. In commercial buildings, new construction dominates, but
retrofits still make up one-third of the total market. Technologies that can reduce the price of commercial building
window retrofits or expand the nonenergy benefits of replacement windows might help increase the uptake of new
8 These data do not account for the potential for daylighting to reduce lighting loads.
9 “Sensible heat” denotes heat transfer that causes the temperature of the system to be increased or decreased. “Latent heat” denotes heat transfer
that occurs without a change in temperature; it relates to the difference in how a 90°F day feels in Phoenix and Atlanta. In the context of the
building envelope, this type of heat transfer is associated with the movement of water vapor (i.e., changes in humidity) through the opaque
envelope.
2Pathway to Zero Energy Windows: Advancing Technologies and Market Adoption
Residential
Heating
Roof
Cooling Walls
Foundation
Commercial
Air Leakage
Heating Windows (Conduction)
Windows (Solar Heat Gain)
Cooling
−1 0 1 2 3 4 5 6 7 8
Primary Energy (quads)
Figure 3. The breakdown of heating, cooling, and ventilation system energy use attributable to building
envelope components in residential and commercial buildings shows that the opaque envelope is the single
largest contributor to envelope-related energy use, followed by air leakage and heat conduction through
windows. Bars with negative values represent component contributions that reduce energy use (e.g., solar
heat gain through windows in the heating season).
Data from Scout [8].
Table 1. The breakdown of window sales in 2016 by millions of units (residential) and million square feet
(commercial) shows that although both sectors have some sales to existing buildings, the retrofit market
share in commercial buildings lags significantly behind that of residential buildings.
Data from the American Architectural Manufacturers Association [9].
Residential Commercial
(million units) (million ft2 )
New Construction 21.4 306
Existing/Retrofit 27.6 152
Total 49.1 458
windows as part of commercial building retrofit projects. Of particular interest, 105 million square feet of the 458
million square feet of commercial windows delivered in 2016 were for curtain wall systems [9].
The composition of the building stock changes over time as new buildings are built and some old buildings are de-
molished, but existing buildings, particularly residential buildings, tend to persist in the U.S. building stock. Figure 4
shows the effect of building construction and demolition on the prevalence of “existing” buildings (built before 2021)
and “new” buildings (built in or after 2021); residential buildings are shown by housing unit and commercial build-
ings by available square footage. Because windows, air- and water-resistive barriers, and insulation are built into the
envelope at the time of construction, it is generally easiest to augment the energy performance of the envelope during
initial construction.
Though it might be easiest to incorporate high-performance envelope components in new construction, the data in
Figure 4 highlight the importance of developing technologies that are also suitable for retrofit of existing buildings.
By 2050, these data indicate that 40% of the commercial square footage existing today will have been supplanted,
though projected growth in the commercial buildings sector means that 56% of the commercial square footage in
2050 will have been built in or after 2021. In the residential sector, 114 million housing units that exist today—93%
of the stock—will still be in service in 2050.
Table 2 shows the approximate number of retrofits of various envelope components in millions of owner-occupied
housing units in 2015. These data show that some retrofits, particularly those that involve key critical structural
3Pathway to Zero Energy Windows: Advancing Technologies and Market Adoption
Residential
2021 New
2050 Existing
0 25 50 75 100 125 150
Housing Units (millions)
Commercial
2021 New
2050 Existing
0 25 50 75 100 125
Floorspace (billion square feet)
Figure 4. To maximize energy savings, new technologies must be suitable for retrofitting existing buildings,
particularly in the residential sector, where by 2050, nearly three-quarters of the building stock will still be
composed of “existing” buildings—those built before 2021. A greater share of the commercial building stock
built before 2021 is expected to be demolished by 2050 compared to the residential building stock, but even
then, approximately 60% of square footage existing in 2021 will remain in the stock in 2050.
Data from the EIA 2021 Annual Energy Outlook [1].
Table 2. In residential buildings, windows/doors and roofs are replaced at rates comparable to HVAC systems,
though with widely differing median project sizes. The median expenditure for window and door
replacements suggests only a few windows are typically being replaced, as compared to substantial or
complete replacement of the heating or cooling system in HVAC projects.
Data from U.S. Census Bureau 2019 American Housing Survey [10].
Number of Projects
Median Expenditure
(millions)
HVAC 10.5 $4,000
Insulation 2.6 $900
Windows/Doors 7.3 $1,500
Roofing 7.1 $7,000
Siding 2.1 $3,500
or life safety components (e.g., roofs) are pursued more frequently, in spite of their high prices, than retrofits to
insulation or siding that might be principally to improve aesthetics or thermal comfort. HVAC systems are shown
as a cost and scale point of comparison to underscore that although HVAC systems must often be replaced because
of major mechanical faults, other envelope components are also regularly replaced. The replacement of envelope
components at a rate that approaches or even exceeds the total number of new housing units built each year suggests
that there might be meaningful opportunities for package retrofits that simultaneously repair or replace a major
envelope component and improve energy performance. Table 3 shows renovation data for commercial buildings in
2012. These data show similar relationships between upgrade rates for different envelope components, where roof
replacements occur at rates comparable to HVAC system upgrades and replacements, while insulation upgrades lag
behind.
Novel approaches discussed in this report have the potential to increase the retrofit rates or adoption of envelope
energy performance upgrades for existing buildings by addressing the labor requirements (and concomitant price
implications), disruption to building occupants, and other factors that currently limit the frequency of window re-
placements. Furthermore, in many cases window replacement is not an option, but window attachments such as
low-e panels (storm windows), cellular shades, low-e window films, and a large variety of shading products can be
added to existing windows to improve performance. Recently, the U.S. Department of Energy (DOE) supported the
4Pathway to Zero Energy Windows: Advancing Technologies and Market Adoption
Table 3. Among commercial buildings constructed before 2008, roof replacement occurred at a rate nearly
comparable to HVAC system upgrade or replacement. Other envelope upgrades were less prevalent, led by
windows and followed by insulation upgrades and other exterior wall renovations.
Data from EIA 2012 Commercial Buildings Energy Consumption Survey [12].
Number of Buildings Percentage of
(millions) Pre-2008 Buildings
HVAC 1.10 21.0%
Insulation 0.38 7.2%
Windows 0.56 10.7%
Roof 0.99 18.8%
Exterior Walls 0.19 3.7%
formation of the Attachment Energy Rating Council, which has developed initial product ratings and is continuing to
add more product categories [11].
1.3 U.S. Department of Energy Building Technologies Office
Research supported by DOE’s Building Technologies Office (BTO) is focused on reducing energy intensity and cost
for technologies across the buildings sector, while maintaining or enhancing occupant comfort, productivity, and
product performance. In essence, a building must use energy more productively and efficiently, not only use less
energy. Progress toward achieving this goal will make building energy costs more affordable—especially beneficial
to U.S. families and businesses.
BTO’s approach to improving energy productivity includes its grid-interactive efficient building (GEB)10 strategy,
which advances the role buildings can play in energy system operations and planning. This strategy includes both
new and existing residential and commercial buildings, including their end-use equipment. BTO’s strategy supports
greater affordability, resilience, environmental performance, reliability, and other goals, recognizing that:
• Building end uses can be dynamically managed to help meet grid needs and minimize electricity system costs,
while meeting occupants’ comfort and productivity requirements.
• Technologies like rooftop photovoltaics, electrochemical and thermal energy storage, combined heat and
power, and other distributed energy resources can be co-optimized with buildings to provide greater value and
resilience to both utility customers and the electricity system.
• The value of energy efficiency, demand response, and other services provided by behind-the-meter distributed
energy resources can vary by location, hour, season, and year.
Developing next-generation building technologies, including building materials, components, equipment, energy
models, and systems, is critical to increasing energy productivity cost-effectively.
To achieve these objectives, BTO sponsors R&D efforts that target improving the largest energy uses within build-
ings (shown in Figure 2): lighting, space conditioning, water heating, appliances, and miscellaneous electric loads,
as well as the building envelopes themselves. BTO’s R&D support also includes system-level efforts, including
developing algorithms for improved energy modeling and system controls required to better predict and manage
energy-efficient equipment and whole-building energy usage, particularly to enable grid-responsive operations.
BTO collaborates with industry, academia, and other leaders across the building sector to develop, validate, and ver-
ify solutions that help building owners and homeowners reduce energy use. Ultimately, design and decision tools
10 Agrid-interactive efficient building is an energy-efficient building that uses smart technologies and on-site distributed energy resources to
provide flexibility while co-optimizing for energy cost, grid services, and occupant needs and preferences, in a continuous and integrated way.
For more information, see the Grid-interactive Efficient Buildings Technical Report Series. The Overview of Research Challenges and Gaps
report can be found at https://www1.eere.energy.gov/buildings/pdfs/75470.pdf and contains introductory information as well as links to the
other four technical reports in the series.
5Pathway to Zero Energy Windows: Advancing Technologies and Market Adoption
developed with BTO support help building owners and operators apply efficient building operational practices and
technologies through improved understanding of their costs and benefits, resulting in more cost-effective, comfort-
able, and healthy buildings.
Finally, BTO works with industry, professional societies, trade groups, and nonprofits such as ASTM and ASHRAE
to develop and implement methods to evaluate and validate the energy performance of building components. BTO
also evaluates changes to model building energy codes developed by ASHRAE and the International Code Council,
which inform state and local building code processes. While the weight of glass and the lead time of window man-
ufacturing means that most windows in the U.S. are manufactured domestically, BTO’s continuing investment in
advancing high-performance window technologies can help ensure that U.S. window manufacturing remains relevant
in the global market.
1.4 BTO Emerging Technologies Program
The BTO Emerging Technologies program supports R&D for technologies, systems, and software tools that can
contribute to improving energy efficiency and load flexibility. The Emerging Technologies program provides R&D
support in several areas: lighting; building equipment; building controls; building electric appliances, devices, and
systems; windows; opaque envelope; and building energy modeling. The majority of Emerging Technologies funding
is distributed competitively through solicitations (i.e., Funding Opportunity Announcements), which in general are
open to applications from large industry, small businesses, academia, national laboratories, and other entities. BTO
also invests in state-of-the-art capabilities at DOE national laboratories that support its mission; these facilities are
available to the buildings R&D community for cooperative research, component evaluation, and product performance
validation. Lawrence Berkeley National Laboratory (LBNL) is designated the core window energy performance
laboratory, and the National Renewable Energy Laboratory (NREL) is designated as the enabling laboratory for
window durability. Oak Ridge National Laboratory (ORNL) is designated as the enabling laboratory for window air
and moisture leakage, and Pacific Northwest National Laboratory (PNNL) is designated as the enabling laboratory
for window market transformation.
The Emerging Technologies program contributes to BTO’s energy use intensity reduction goal by supporting the
development of cost-effective, energy-efficient technologies. Broadly, to make significant progress toward BTO’s
goals, any next-generation window technologies must achieve widespread adoption. As a result, specific emphasis
is placed on developing technologies that will have market-acceptable characteristics, including payback period and
total installed price, aesthetics, durability, and sustained energy performance over the lifetime of the technology.
1.5 Organization and Purpose of This Report
This report focuses on R&D for energy-efficient window technologies. It is the result of collaboration with promi-
nent researchers and leaders in the field and aims to provide strategic guidance for BTO’s investments in developing
the next generation of high-performance, cost-competitive windows.
The R&D opportunities identified in this report are predicated on an assessment of the need for improvements in
the performance of windows. This assessment is included in Section 2, “Current Technologies—Opportunities and
Challenges,” and provides the motivation for the fundamental and enabling research areas identified in Section 3,
“Future Technology Development.” Section 3 includes a discussion of the current state of research, future research
opportunities, technology-specific performance metrics, and the associated national energy savings potential. Tech-
nical, manufacturing, and market risks are also noted briefly in Section 3. The final two sections address topics that
are important to the successful market entry of the technologies in Section 3. Section 4, “Integration,” addresses two
opportunities to fully realize a broader value proposition for envelope technologies: the adoption of a systems-level
approach to new building design and deep retrofit planning, and the application of envelope technologies to benefit
electric grid operations. Section 5, “Market Transformation and Implementation,” examines the technology transfer
landscape as it relates to moving technologies from early-stage R&D to market-ready, commercially available prod-
ucts. Section 5 discusses the roles of industry, academia, national laboratories, and other public- and private-sector
entities alongside BTO in accelerating technology R&D and commercialization, and facilitating market readiness.
6You can also read