PC-Axis User Instructions
←
→
Page content transcription
If your browser does not render page correctly, please read the page content below
Euroopa Liit
             Euroopa Sotsiaalfond   Eesti tuleviku heaks

         PC-Axis
User Instructions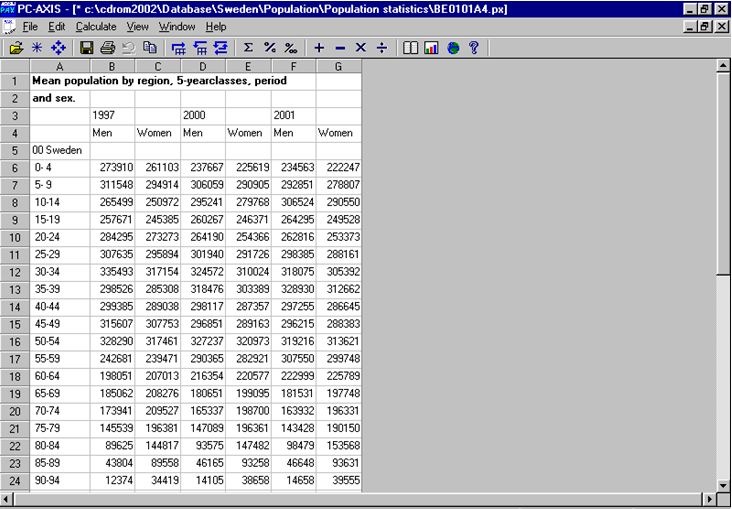
Table of Contents

Introduction.......................................................................................................................................................................... 3
Installation............................................................................................................................................................................ 3
Using the Program........................................................................................................................................................... 3
Support Functions in PC-Axis.................................................................................................................................... 5
Opening a Table................................................................................................................................................................. 5
Selecting Variables........................................................................................................................................................... 6
Changing a Table in PC-Axis...................................................................................................................................... 7
Simple Calculations......................................................................................................................................................... 8
Changing the Presentation of a Table................................................................................................................... 8
Drawing Graphs................................................................................................................................................................. 9
Saving a Table..................................................................................................................................................................... 9

2
Introduction
PC-Axis is a program designed for using tables in PC-Axis (.px) format. It enables users to create
their own databases, form new tables out of existing database tables , manipulate data within one
table and between different tables, convert tables into other formats, present data graphically,
etc.
PC-Axis uses English as its user interface language, which means that the menu, support functions
(Help), and error messages are all displayed in English. The English conjunctions “by” and “and”
are used in the generated table headings. This manual has been prepared based on the Swedish
PC-Axis manual.

Installation
Download the zipped version of PC-Axis software (.zip), and store it on your computer. Unzip the
downloaded file (pca2008setup2.zip), and run pcasetup2008.exe.

Using the Program
Run Pcaxis.exe, located in the Pcaxis2008 folder, to start the program, and open the desired data
table. It is recommended to create a separate folder when creating your own database and to
store all of your data tables in this folder.
You can see the meanings of the toolbar buttons by moving the mouse pointer on the desired
button. Functions of the buttons are also listed below.

                Open Database

                Footnote

                Select new values

                Save

                Print

                Undo

                                                                                                3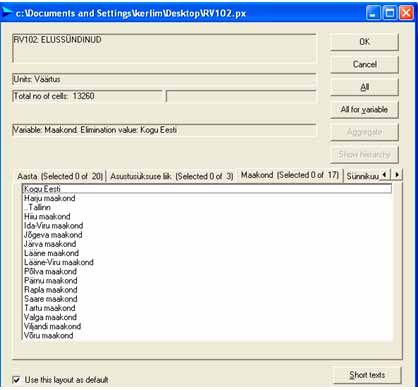
Copy

    Pivot the table clockwise

    Pivot the table counter-clockwise

    Pivot by choice

    Sum

    Percentage

    Per mil

    Add

    Subtract

    Multiply

    Divide

    More information

    Graphs

    Maps

    Search help

4
Support Functions in PC-Axis
Support information concerning menus, commands, and use of PC-Axis can be obtained from
the Help menu by clicking the ‘?’ button or by pressing F1.
You can search for a solution to your problem in the displayed Help window by using either
Contents or Index (figure 1). Enter the word or phrase to be searched for in the appropriate field.
Figure 1. Help
Opening a Table
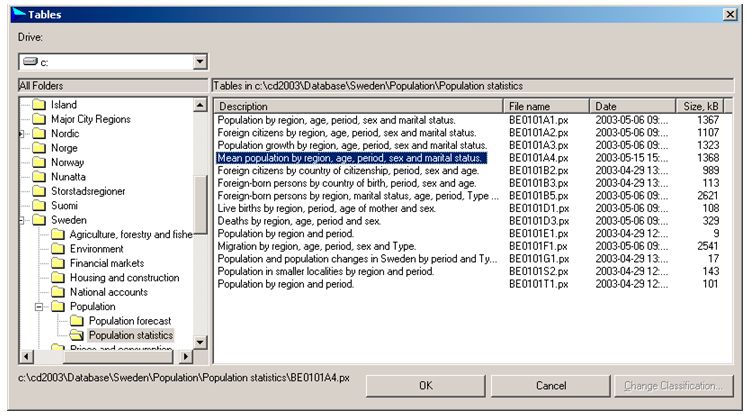
A table can be opened by selecting File – Open Database or by clicking the . button. Select
a folder containing stored data from the list on the left side in the window displayed. Select the
desired data table from the window on the right. Click on a table to select it or highlight it with
the mouse and press ENTER.
Figure 2. Selecting a data table
5Selecting Variables
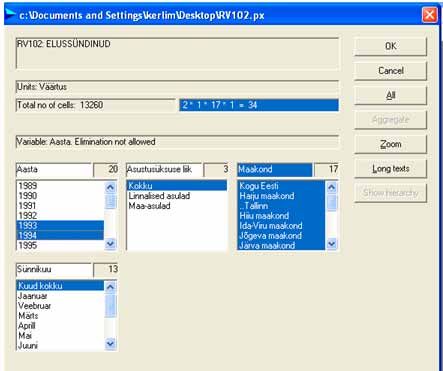
Click on the desired attributes with the mouse to select values for your table (figure 3). To select
multiple values for one attribute, press and hold the CTRL key and select the desired values using
the mouse.
Click on the name field of a variable to select all available values. Click the All button to select the
values for all variables.
In the case of long variable names, you can view the data using an alternative menu by clicking
the Long texts button. Click on Short texts to return to the previous view.
Figure 3. Options for selecting variable values. The Long text view is displayed on the right.
You can select Long text view as the default setting by marking the Use this layout as default
checkbox. To return to the previous view, select either:
1) the Short text button located at the lower right corner of the window, or
2) View – Advanced, Information, and then mark the Show value selection in layout with
small list boxes checkbox.
In both cases the resulting table looks similar.
6Figure 4. The table created based on the selected variables.
By pressing the button on the toolbar, footnote information is displayed for the table. If
additional information exists, the button will be enabled.
Changing a Table in PC-Axis
You can change the appearance of a table in several ways according to your preferences.
The position of variables included in the table may be changed using the pivot table function. In
addition to the option of pivoting the table clockwise and counter-clockwise , you can
also change the position of the variables yourself. Click the button or select Edit – Change
variable order to do this. You can drag variables from the text column to the header and vice
versa using the mouse. The order of the variables can also be changed. Click OK after finding the
desired variable layout.
Select Edit – Change value order to adjust the order of a variable’s values. Select the variable
whose order of values you wish to change from the window displayed. Press OK. Mark a value in
the box on the left and transfer it to the box on the right using the double arrow (>>) between the
two boxes in the order you wish the values to be displayed. If you are satisfied with the order of the
values remaining in the box on the left-hand side after transferring some of these values to the
box on the right, you can then move values simultaneously onto the right-hand side by selecting
the Move rest button. You can sort values on the right either in ascending (Sort ascending) or
descending (Sort descending) order.
7Other commands in the Edit menu Delete variable can be used to delete any unnecessary variable(s). Delete value can be used to delete values selected from a table. Change text can be used to modify the title of the table and/or the text contained within. Change texts/codes can be used to determine whether a value is displayed using text, code or both. You can join tables together by using the Edit menu options Link with table and Overlay with table. The tables you wish to combine must be similar. If one of the tables has been modified previously, the same modifications have to be performed on the other table. Combining tables can be used to update a table. For example, you can update an existing table using the data from a previous year. The Link with table option can be used to add different periods/values to the table. The Overlay with table option is used when adding a new variable when dealing with two tables containing different content; for example, while creating one table based on data imported and exported from other tables. After choosing the method which will be used for joining the two tables, a folder will be displayed to select the other table with which it will be combined. If no options are provided, this means that no suitable tables are found in the specified folder. Simple Calculations All possible calculations which you can perform using PC-Axis are listed in the Calculate menu. First, select an operation to be performed. Choose the values which the operation will be applied to from the display window. If you do not wish to retain the original values in the table, select Initial cases – excluded in the right-hand corner. After that, assign a name and a code to the new value. Changing the Presentation of a Table You can change the way in which a table is presented by using the commands located in the View menu. Commands marked with a check are already in effect. Zero Rows – rows with zero values are deleted Zero Columns – columns with zero values are deleted Grid Lines – grid lines are displayed Column Identities – column identifiers (i.e. the letters above columns) are displayed 8
Row Numbers – row numbers are displayed
Show Table Title – table title is inserted above the table
Fonts –change the font style and size
Alignment –change the alignment of the text
Language –change the language of the information bar

Drawing Graphs
You can draw various graphs based on a PC-Axis table – bar graphs, line graphs, pie charts and
population pyramids. To do this, click the button or select View – Graphs from the menu.
You can select a suitable graph type from the box on the right-hand side of the displayed window
and choose whether you desire either a two- or three-dimensional graph from above the box.
Some graph types require a specific table structure (e.g. a population pyramid requires the age
attribute located in a text column and gender in a column header).
You can change the appearance of the graph with the Adjust button – the background colour, text
on the X and Y axes, legend, and title can be modified. Changes are displayed immediately on the
drawing visible in the background.
The graph can be printed, saved to a file and copied. Click the appropriate button on the left-
hand side in order to copy the graph, go to the worksheet into which you wish to add the object,
select Paste special and then choose Bitmap format from the options. The graph is copied using
an image format and cannot be changed or modified in MS Office.

Saving a Table
You can save the created table to your computer or a server by using the File – Save as command.
If you want to save the table using another file format, select the Convert option, and a desired
file format in the File Format field. You can also choose to save the explanatory information along
with the table by using the checkboxes on the right-hand side.

                                                                                                 9
You can also read