PD-1 blockade delays tumor growth by inhibiting an intrinsic SHP2/Ras/MAPK signalling in thyroid cancer cells
←
→
Page content transcription
If your browser does not render page correctly, please read the page content below
Liotti et al. Journal of Experimental & Clinical Cancer Research             (2021) 40:22
https://doi.org/10.1186/s13046-020-01818-1

 RESEARCH                                                                                                                                           Open Access

PD-1 blockade delays tumor growth by
inhibiting an intrinsic SHP2/Ras/MAPK
signalling in thyroid cancer cells
Federica Liotti1, Narender Kumar1, Nella Prevete1,2, Maria Marotta3, Daniela Sorriento4, Caterina Ieranò5,
Andrea Ronchi6, Federica Zito Marino6, Sonia Moretti7, Renato Colella8, Efiso Puxeddu7, Simona Paladino3,
Yoshihito Kano9, Michael Ohh10,11, Stefania Scala5 and Rosa Marina Melillo1,3*

  Abstract
  Background: The programmed cell death-1 (PD-1) receptor and its ligands PD-L1 and PD-L2 are immune
  checkpoints that suppress anti-cancer immunity. Typically, cancer cells express the PD-Ls that bind PD-1 on
  immune cells, inhibiting their activity. Recently, PD-1 expression has also been found in cancer cells. Here, we
  analysed expression and functions of PD-1 in thyroid cancer (TC).
  Methods: PD-1 expression was evaluated by immunohistochemistry on human TC samples and by RT-PCR, western
  blot and FACS on TC cell lines. Proliferation and migration of TC cells in culture were assessed by BrdU
  incorporation and Boyden chamber assays. Biochemical studies were performed by western blot,
  immunoprecipitation, pull-down and phosphatase assays. TC cell tumorigenicity was assessed by xenotransplants in
  nude mice.
  Results: Human TC specimens (47%), but not normal thyroids, displayed PD-1 expression in epithelial cells, which
  significantly correlated with tumour stage and lymph-node metastasis. PD-1 was also constitutively expressed on TC
  cell lines. PD-1 overexpression/stimulation promoted TC cell proliferation and migration. Accordingly, PD-1 genetic/
  pharmacologic inhibition caused the opposite effects. Mechanistically, PD-1 recruited the SHP2 phosphatase to the
  plasma membrane and potentiated its phosphatase activity. SHP2 enhanced Ras activation by dephosphorylating
  its inhibitory tyrosine 32, thus triggering the MAPK cascade. SHP2, BRAF and MEK were necessary for PD-1-mediated
  biologic functions. PD-1 inhibition decreased, while PD-1 enforced expression facilitated, TC cell xenograft growth
  in mice by affecting tumour cell proliferation.
  Conclusions: PD-1 circuit blockade in TC, besides restoring anti-cancer immunity, could also directly impair TC cell
  growth by inhibiting the SHP2/Ras/MAPK signalling pathway.
  Keywords: Thyroid Cancer, Programmed cell death-1, SHP2 phosphatase, Ras, MAPK signalling

                                                                                       Background
                                                                                       Immunotherapy represents the major breakthrough of
                                                                                       the last years in the therapy of several cancer types [1].
* Correspondence: rosmelil@unina.it                                                    The programmed cell death-ligand 1 and 2 (PD-L1, PD-
1
 Institute of Experimental Endocrinology and Oncology (IEOS), CNR, Naples,
Italy                                                                                  L2) are immune checkpoints (IC) important for deliver-
3
 Department of Molecular Medicine and Medical Biotechnology, University                ing inhibitory signals to immune cells expressing their
of Naples Federico II, Via S. Pansini 5, 80131 Naples, Italy                           receptor programmed cell death-1 (PD-1) [1, 2]. This
Full list of author information is available at the end of the article

                                        © The Author(s). 2021 Open Access This article is licensed under a Creative Commons Attribution 4.0 International License,
                                        which permits use, sharing, adaptation, distribution and reproduction in any medium or format, as long as you give
                                        appropriate credit to the original author(s) and the source, provide a link to the Creative Commons licence, and indicate if
                                        changes were made. The images or other third party material in this article are included in the article's Creative Commons
                                        licence, unless indicated otherwise in a credit line to the material. If material is not included in the article's Creative Commons
                                        licence and your intended use is not permitted by statutory regulation or exceeds the permitted use, you will need to obtain
                                        permission directly from the copyright holder. To view a copy of this licence, visit http://creativecommons.org/licenses/by/4.0/.
                                        The Creative Commons Public Domain Dedication waiver (http://creativecommons.org/publicdomain/zero/1.0/) applies to the
                                        data made available in this article, unless otherwise stated in a credit line to the data.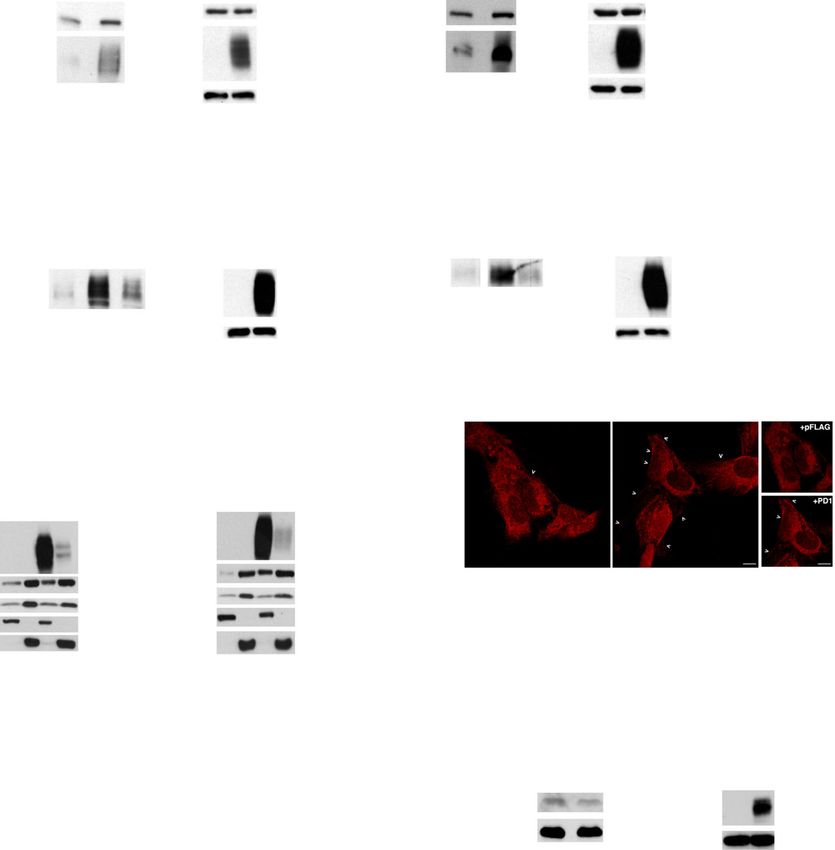
Liotti et al. Journal of Experimental & Clinical Cancer Research   (2021) 40:22                                         Page 2 of 16

circuit is critical in regulating immune tolerance in vari-               PD-1 blockade may represent a rational therapeutic
ous physiologic and pathologic contexts [1]. Cancer cells                 choice in aggressive forms of TC for both immune re-
suppress anti-cancer immune response exploiting the                       sponse reconstitution and direct anti-tumour effects.
PD-1 circuit [3]. Typically, PD-Ls are expressed by can-
cer cells, while PD-1 is expressed by immune cells with                   Materials and methods
anti-cancer potential (i.e., T cells, macrophages or nat-                 Reagents
ural killer cells) [3]. The inhibition of this circuit                    pCMV3 and pCMV3 PD-1 plasmids were from Sinobio-
through immune checkpoint inhibitors (ICI) - neutraliz-                   logical (Wayne, PA, USA), pCEFL and pCEFL AU5-
ing antibodies against PD-1, PD-L1 or PD-L2 - restores                    tagged Ras (V12) plasmids were a kind gift of J.S. Gut-
the anti-cancer immune response and displays thera-                       kind [19]. PD-1 was cloned in pFLAG 5A (Invitrogen,
peutic activity in various cancer types [4].                              Carlsbad, CA, USA). Soluble PD-L1 (sPD-L1) was from
  Recently, various tumour types have been found to ex-                   R&D systems (Minneapolis, MN, USA), Nivolumab was
press also intrinsic PD-1 (i.e., melanoma, hepatocarci-                   kindly provided by S. Scala. Anti-Ras antibody for im-
noma, lung carcinoma and T-cell lymphomas) [5–8].                         munoprecipitation (clone MA1012) was from Invitrogen.
PD-1 intrinsic signalling promoted tumour growth in                       Anti-phospho Y32, anti-phospho Y64 Ras antibodies and
melanoma and hepatocarcinoma through a mammalian                          Y32 and Y64 peptides, used to saturate aspecific binding
target of rapamycin (mTOR)/ribosomal protein S6 Kin-                      of each antibody, were provided by M. Ohh. SHP099,
ase (S6K1) pathway [5, 6]. By contrast, in non-small cell                 Vemurafenib, and Selumetinib were from Selleckchem
lung cancer (NSCLC) and in T-cell lymphomas, PD-1                         (Houston, TX, USA). IgG4 control antibodies were from
behaved as a tumour suppressor [7, 8]. These data indi-                   Invitrogen.
cate that PD-1 could exert context-related tumour-
intrinsic functions other than the suppression of im-
mune response, and suggest the need of wider studies                      Cell culture and transfection
on ICI effects on the entire tumour context.                              Human thyroid cancer cell lines BcPAP, TPC-1, 8505c,
  Thyroid carcinoma (TC) is the most frequent endo-                       CAL62, SW1736, FRO, BHT101, HTH7 and OCUT1
crine malignancy. Follicular cell-derived TC includes dif-                were obtained and maintained as previously described
ferent histotypes ranging from well differentiated                        [20]. The normal thyroid cells H-6040, isolated from
(WDTC) to poorly differentiated (PDTC) and undiffer-                      normal human thyroid tissue and cultured in Human
entiated/anaplastic (ATC) carcinomas. WDTCs include                       Epithelial Cell Medium with the addition of Insulin-
papillary histotype (PTC), representing the majority of                   Transferrin-Selenium,     EGF,     Hydrocortisone,     L-
these tumours, and follicular histotype (FTC). WDTCs                      Glutamine, antibiotic-antimycotic solution, Epithelial
show an indolent behaviour and are mainly cured by                        Cell supplement, and FBS were purchased from Cell Bio-
surgery and 131I radioiodine (RAI) therapy; only a small                  logics (Chicago, IL, USA). H-6040 cells were used at pas-
percentage of them exhibits recurrence, metastasis and                    sages between 3 and 6.
resistance to RAI over time. By contrast, aggressive                        Transient transfections of TC cells were performed
forms of TC (PDTC and ATC) represent a clinic chal-                       using polyethylenimine according to manufacturer’s in-
lenge displaying a remarkable chemo- and radio-                           structions (Merck, Darmstadt, Germany). Cells were har-
resistant phenotype from the beginning [9, 10]. Interest-                 vested 48 h after transfection. Electroporation was used
ingly, aggressive forms of TC exhibit increased immune                    (Neon® Transfection System for Electroporation, Life
checkpoint expression and inefficient immune infiltrate                   Technologies, Carlsbad, CA, USA) to obtain stably trans-
[9, 11–14], features that are being evaluated for the                     fected cells [21].
treatment of the disease [9, 14, 15].                                       For RNA interference, we used SMART pools of
  Here, we analysed the PD-1/PD-Ls circuit in TC show-                    siRNA from Dharmacon (Lafayette, CO, USA) targeting
ing that: i) TC cell lines and TC human samples express,                  PD-1 or SHP2. Transfection was carried out by using
besides PD-Ls, as already demonstrated [16–18], also                      100 nM of SMARTpool and 6 μl of DharmaFECT (Dhar-
PD-1 in epithelial cells, whose levels correlated with                    macon) for 48 h [22].
tumour aggressiveness; ii) intrinsic PD-1 sustains prolif-
eration and migration of TC cells through a SHP2/Ras/                     Cytofluorimetric analysis
MAPK signalling cascade; iii) PD-1 overexpression pro-                    Cells were incubated (30 min at 4 °C) with specific or
motes, while PD-1 blockade inhibits, ATC xenograft                        isotype control antibodies. Cells were analysed with a
growth by affecting cancer cell proliferation.                            FACS Calibur cytofluorimeter using CellQuest software
  Thus, TCs express an intrinsic pro-tumorigenic PD-1                     (BD Biosciences, Mississauga, ON, Canada). 104 events
circuit. In TC context, the oncogenic role of PD-1 is                     for each sample were acquired [22]. Anti-PD-1 and anti-
dependent on the activation of the Ras/MAPK cascade.                      PD-L1 antibodies were from ebioscience (Thermo
Liotti et al. Journal of Experimental & Clinical Cancer Research   (2021) 40:22                                          Page 3 of 16

Fisher, Waltham, MA, USA), anti-PD-L2 from Miltenyi                       analysis were obtained from Cell Signaling Technology
Biotec (Bergisch Gladbach, Germany).                                      (Danvers, MA, USA). Monoclonal anti-tubulin antibody
                                                                          was from Sigma Aldrich. Secondary anti-mouse and
Immunohistochemistry                                                      anti-rabbit antibodies were coupled to horseradish per-
Thyroid carcinomas were selected from the Pathology                       oxidase (Biorad, Hercules, CA, USA).
Unit of the University of Perugia upon informed con-                         Cell lysates were subjected to immunoprecipitation
sent; the protocol for the study was approved by the in-                  with different antibodies or subjected to pull-down bind-
stitutional committee of University of Perugia. Thyroid                   ing assays with purified recombinant proteins immobi-
tissues were formalin fixed and paraffin embedded                         lized on agarose beads. The glutathione-S-transferases
(FFPE). Sections of 4 μm were obtained. BOND-III fully                    (GST) fusion proteins were expressed in Escherichia coli
automated immunohistochemistry stainer (Leica Biosys-                     and purified with glutathione-conjugated agarose beads
tems, Wetzlar, Germany) carried out the immunostain-                      (Merck) by standard procedures. The protein complexes
ing, using heat-induced antigen retrieval at pH 9.0 for                   were eluted and resolved by sodium dodecyl sulphate-
20 min, followed by primary antibody (PD-1, clone                         polyacrylamide gel electrophoresis (SDS-PAGE). Im-
EH33; dilution 1:200) (Cell Signaling, Beverly, MA, USA)                  munoblotting with specific antibodies and enhanced
incubation for 15 min. Finally, the ready to use Bond™                    chemiluminescence (ECL; Thermo Fisher) were
Polymer Refine Detection System allowed the detection                     employed for immune-detection of proteins in com-
of antigen-antibody reaction [11]. Immunohistochemical                    plexes [27].
(IHC) score was calculated by combining the staining in-                     Cell fractionation experiments were performed using
tensity with the percentage of immuno-reactive epithelial                 the Subcellular Protein Fractionation Kit for Cultured
cells. Staining intensity was rated on a scale of 0–3 (0,                 Cells according to manufacturer’s instructions (Thermo
negative; 1, weak; 2, moderate; and 3, strong). Each                      Fisher). Membrane fraction’s protein content was nor-
tumor was then scored for the percentage of immuno-                       malized by using anti-transferrin receptor antibody
reactive cells. The IHC score was then assigned to each                   (Invitrogen).
tumor by multiplying the percentage of positive epithe-
lial cells for the staining intensity. The IHC score ranged               Immunofluorescence
from 0 to 300. We used a cut-off of 5% to determine the                   Cells, grown on coverslips, were washed with phosphate-
positivity of immunohistochemistry, consistently with                     buffered saline (PBS), fixed with 4% paraformaldehyde
the cut-off chosen to evaluate PD-1 in other cancer sys-                  (PFA) and quenched with 50 mM NH4Cl. Then, cells
tems [6, 23, 24].                                                         were permeabilized with 0.2% Triton X-100 for 5 min
                                                                          and blocked for 30 min in PBS containing 5% FBS and
S-phase entry                                                             0.5% bovine serum albumin (BSA). Primary antibodies
S-phase entry was evaluated by Bromodeoxyuridine                          were detected with Alexa Fluor546-conjugated second-
(BrdU) incorporation. Cells were serum-deprived and                       ary antibodies (Abcam, Cambrige, UK). Images were ac-
treated with stimuli for 24 h. BrdU was added at a con-                   quired using a laser scanning confocal microscope (LSM
centration of 10 μM for the last 1 h. BrdU-positive cells                 510; Carl Zeiss MicroImaging, Inc., Oberkochen, Germa-
were revealed with Texas Red conjugated secondary Abs                     nia.) equipped with a planapo 63X oil-immersion (NA
(Jackson Laboratories, West Grove, PA, USA). Fluores-                     1.4) objective lens by using the appropriate laser lines
cence was detected by FACS analysis [25].                                 and setting the confocal pinhole to one Airy unit. Z-
                                                                          slices from the top to the bottom of the cell by using the
Migration assays                                                          same setting (laser power, detector gain) were collected
Chemotaxis was evaluated using a Boyden chamber. We                       as previously described [28].
used a 48-well microchemotaxis chamber (NeuroProbe,
Gaithersburg, MD, USA) and 8-μm-pore polycarbonate                        SHP2 activity assay
membranes (Nucleopore, Pleasanton, CA, USA) coated                        SHP2 phosphatase activity was determined using the hu-
with 10 μg/ml fibronectin (Merck) as described else-                      man/mouse/rat active DuoSet IC kit (R&D Systems).
where [22].                                                               Briefly, cellular SHP2 bound to anti-SHP2 antibody con-
                                                                          jugated to agarose beads was exposed to synthetic phos-
Protein studies                                                           phopeptide substrate, which is only dephosphorylated by
Protein extraction and immunoblotting experiments                         active SHP2. The amount of free phosphate generated in
were performed according to standard procedures [26].                     the supernatant was determined, as absorbance at 620
Antibodies to PD-1, phospho-PD-1, phospho-BRAF,                           nm, by a sensitive dye-binding assay using malachite
phospho-MEK1/2, phospho-MAPK (p44/p42), Ras,                              green and molybdic acid and represents a direct meas-
phospho-SHP2, SHP2, and GRB2 for Western blot                             urement of SHP2 activity in the cellular system [29].
Liotti et al. Journal of Experimental & Clinical Cancer Research (2021) 40:22 Page 4 of 16
Tumorigenicity in immunocompromised mice tumour stage and lymph-nodal metastasis significantly
Each group of 8 mice (6-week-old CD1 nu/nu females) correlated with PD-1 staining (Table 1) in our casistic.
was inoculated subcutaneously with 8505c parental cells, Several reports already described the expression of
8505c transfected with pCMV3 or pCMV3 PD-1 cells PD-L1 in TC cells of human samples and demonstrated
(1x10⁷cells/mouse, two clones) [25]. Nivolumab (anti- that its expression is associated with aggressiveness, sug-
PD-1) or control IgG4 were intraperitoneally (i.p.) ad- gesting that PD-L1 could represent a useful prognostic
ministered at 30 mg/kg twice per week. The experimen- marker for TC patients [16–18]. We also confirmed in
tal protocol for animal studies was approved by the our casistic the expression of the PD-L1 in thyroid can-
Ministero Italiano della Salute (No. 317/2019-PR). For cer epithelial cells (Fig. 1b).
xenograft histological analysis, anti-Ki-67 was from Bio- Altogether, our data on TC samples, on TC cell lines
care Medical (Pacheco, CA, USA), anti-CD31, anti- and the data available from the literature indicate that
cleaved caspase 3 were from R&D Systems. TC cells can express PD-1 together with its ligands. Our
results also indicate that PD-1 expression correlates with
tumour malignancy.
Statistical analysis
The results are expressed as the mean ± SD of at least 3
experiments. Values from groups were compared using
PD-1 promotes thyroid carcinoma cell proliferation and
the paired Student t test or Duncan test. The association
motility
between PD-1 expression and clinic-pathologic parame-
We selected 8505c and TPC-1 cells - derived from a hu-
ters in immunohistochemistry experiments was con-
man ATC and PTC, respectively - to analyse the biologic
ducted using χ2. P value < 0.05 was considered
effects of PD-1 enforced expression or of PD-1 stimula-
statistically significant.
tion by soluble PD-L1 (sPD-L1–1 μg/ml). Levels of PD-1
expression upon transient transfection are shown in
Results Suppl. Fig. 2a. The endogenous PD-1 protein expression
PD-1 receptor and its ligands are expressed in thyroid levels, already shown in TC wild-type cells (Suppl. Fig.
carcinoma cells 1A), are not evident in the empty-vector transfected cells
We evaluated the expression levels of PD-1, PD-L1 and due to the short time of exposure (Suppl. Fig. 2A).
PD-L2 in a panel of human TC cell lines derived from We demonstrated that transient PD-1 overexpression
PTC (BcPAP, TPC-1) or ATC (8505c, CAL62, SW1736, (pFLAG PD-1 compared to pFLAG) or PD-1 activation
FRO, BHT101, HTH7, OCUT1) compared to a primary (sPD-L1 vs untreated - NT) significantly increased DNA
human thyroid cell culture (H-6040). Cytofluorimetric synthesis, as assessed by BrdU incorporation (Fig. 2a) in
analysis demonstrated that all the cell lines expressed both TC cell lines. Accordingly, cell cycle analysis
PD-1 on the plasma membrane, though to a lesser ex- showed an increased percentage of cells in S and G2/M
tent than PD-Ls, and that PD-1 protein levels were phases in PD-1-transfected compared to empty vector-
higher in cancer compared to normal thyroid cells transfected TC cells (Suppl. Fig. 2B). No effects of PD-1
(Fig. 1a). Similar data were also obtained through west- overexpression/activation were observed on cell viability
ern blot analysis as shown in Supplementary Figure 1A. (Suppl. Fig. 2C).
PD-1, PD-L1 and PD-L2 mRNA levels were comparable In order to confirm these observations, we evaluated
between normal and cancerous thyroid cells, suggesting the effects of PD-1 inhibition on the same cellular func-
that post-translational mechanisms could be responsible tions. To this aim, PD-1 expression was inhibited by
for the protein increase observed in cancer cells (Suppl. siRNA or Nivolumab (anti-PD-1 moAb) in TPC-1 and
Fig. 1b). 8505c cells. Both siRNAs targeting PD-1 (siPD-1 vs
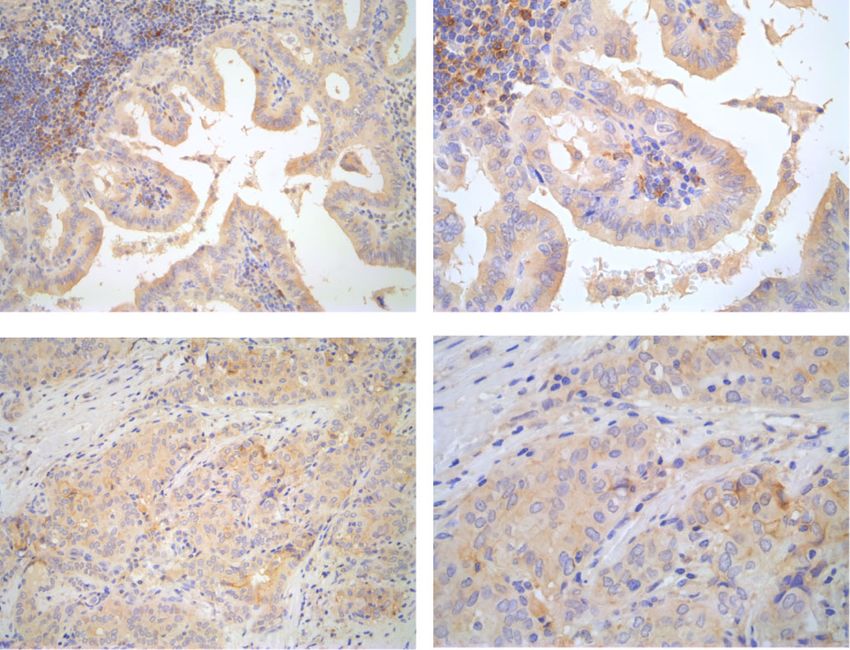
Immunohistochemical (IHC) staining of whole sec- siCTR - 100 nM; Suppl. Fig. 2D) and Nivolumab (Nivo -
tions from 34 PTC surgical samples with anti-PD-1 anti- 10 μg/ml) were able to significantly inhibit BrdU incorp-
bodies showed that PD-1 is expressed in TC cells oration (Fig. 2b) and cell cycle progression (Suppl. Fig.
(Fig. 1b), but not in normal thyroid epithelial cells (not 2E) of TC cells in comparison to the relative controls,
shown). Figure 1b shows a representative PTC case with without affecting cell viability (Suppl. Fig. 2F).
PD-1 immunoreactivity, cytosolic and/or localized at the To assess the role of endogenous PD-1 ligands in TC
plasma membrane, in thyroid cancer epithelial cells (20x cell proliferation, we treated 8505c cells with blocking
and 40x) (Fig. 1b). Infiltrating lymphocytes showed a anti-PD-L1 or anti-PD-L2 moAb (10 μg/ml) or transi-
stronger PD-1 staining compared to cancer cells. PD-1 ently transfected them with PD-L1 or PD-L2 expressing
expression was detectable in epithelial cancerous cells of vectors. PD-L1 or PD-L2 overexpression increased, while
47% of tumour samples (Table 1). By analysing clinic- anti-PD-L1 or anti-PD-L2 antibodies inhibited, BrdU in-
pathologic features of the PTC samples, we found that corporation in 8505c cells (Suppl. Fig. 2G). No effects ofLiotti et al. Journal of Experimental & Clinical Cancer Research (2021) 40:22 Page 5 of 16 Fig. 1 Immune checkpoint expression in thyroid cancer (TC) cells and human TC tissue samples. a. Mean Fluorescence Intensity for PD-1, PD-L1 and PD-L2 measured by flow cytometric analysis on H-6040 normal thyroid epithelial cells, PTC-derived cell lines (BcPAP and TPC-1), and ATC- derived cell lines (8505c, CAL62, SW1736, FRO, BHT101, HTH7, OCUT1). Data are presented as mean ± SD. * P < 0.05 compared to the H-6040 cells. b. Immunohistochemical staining of representative PTC samples with anti-PD-1 or anti-PD-L1 antibodies (20x and 40x). In the upper panels, PD-1 immunoreactivity in both thyroid epithelial cells and in infiltrating lymphocytes can be detected. Lower panels show PD-L1 immunoreactivity in a representative PTC sample
Liotti et al. Journal of Experimental & Clinical Cancer Research       (2021) 40:22                                          Page 6 of 16

Table 1 Relation between PD-1 epithelial TC cell expression                   PD-1 activates the Ras/MAPK signalling cascade in thyroid
and clinic-pathological features. * P < 0.05 among groups                     carcinoma cells
                       Epithelial cell PD-1 staining               P          We then asked which signalling pathway was stimulated
                       Negative/low             Positive                      upon PD-1 overexpression/activation. To this aim, we
BRAF (n = 34)                                                                 used specific phospho-antibodies against various signal-
  Not mutated          2                        2                  0.9
                                                                              ling proteins. We found that BRAF, MEK and MAPK
                                                                              (p44/p42) are activated, as demonstrated by the in-
  Mutated              16                       14
                                                                              creased levels of their phosphorylated forms, upon PD-1
Thyroiditis (n = 33)                                                          transient transfection (Fig. 3a), PD-1 stable transfection
  No                   12                       11                 0.9        (Suppl. Fig. 3B), and sPD-L1 treatment (Fig. 3b) in both
  Yes                  5                        5                             8505c and TPC-1 cells. No significant activation of other
TNM (n = 34)                                                                  signalling proteins was detected (Suppl. Fig. 3C). To
  T1                   11                       9
                                                                              confirm these observations, BRAF, MEK1/2 and MAPK
                                                                              activation levels were evaluated upon PD-1 blockade by
  T2                   4                        3                  0.77
                                                                              siPD-1 or Nivolumab treatment. Consistently, both
  T3                   3                        4                             siPD-1 (100 nM) and Nivolumab (10 μg/ml - 15 and 30
  N0                   17                       6                             min) reduced the levels of phosphorylated BRAF,
  N1                   1                        10                 0.04*      MEK1/2 and MAPK compared to the relative controls
  M0                   11                       15                            (Fig. 3c) in TC cells.
  M1                   7                        1                  0.9
                                                                                 Since the BRAF/MEK/MAPK signalling is potentiated
                                                                              by PD-1 in TC cells, and Ras GTPase is the main up-
Progression free survival (n = 28)
                                                                              stream activator of this cascade [30], we asked whether
  No                   3                        4                             PD-1 could activate Ras. To this end, we used a pull-
  Yes                  12                       9                  0.51       down assay with the GST-RAF1-Ras binding domain
Stage (n = 29)                                                                (RBD), which specifically binds the GTP-loaded active
  1                    12                       6                             form of Ras. 8505c and TPC-1 cells were transiently
  2                    0                        0                  0.04*
                                                                              transfected with empty vector (pFLAG) or PD-1 (pFLAG
                                                                              PD-1) in combination with pCEFL H-Ras AU5 or the
  3                    1                        5
                                                                              relative empty vector (pCEFL). PD-1 enforced expression
  4                    2                        3                             increased Ras activation, as assessed by Ras pull-down,
Infiltrative phenotype (n = 34)                                               in comparison to control (Fig. 3d), suggesting that PD-1
  No                   15                       13                            potentiates Ras activation in TC cells.
  Yes                  3                        3                  0.87
                                                                              PD-1 recruits and activates the SHP2 phosphatase in
                                                                              thyroid carcinoma cells
                                                                              In immune cells, PD-1 signalling requires the tyrosine
PD-L1 or PD-L2 were observed on TC cell viability (not                        phosphatase SHP2 (PTPN11) [29]. Upon phosphoryl-
shown).                                                                       ation of tyrosine residues in its cytosolic domain, PD-1
  Since PD-1 expression levels in human TC samples                            binds to the SH2 domains of SHP2 that, in turn, dephos-
correlated with lymph-nodal metastasis, we asked                              phorylates signalling components of the immune recep-
whether PD-1 could also stimulate the motility of TC                          tors, thus down-regulating the immune responses [31].
cells. To this aim, we performed migration assays on                          In cancer cells, SHP2 acts as a signalling molecule
8505c cells stably overexpressing or not PD-1                                 downstream receptor tyrosine kinases (RTKs), displaying
[pCMV3 PD-1 cl13 and cl16 compared to pCMV3                                   oncogenic activity [32]. In particular, SHP2 can contrib-
empty vector-transfected cells (Suppl. Fig. 3A)] or on                        ute to Ras activation either by recruiting the GRB2/SOS
parental 8505c cells treated or not with sPD-L1 (1 μg/                        complex to the plasma membrane [33] or through its
ml) in the presence or absence of Nivolumab (Nivo -                           phosphatase activity on Ras inhibitory tyrosine residues
10 μg/ml) (Fig. 2c). PD-1 overexpressing TC cells                             [33, 34].
showed an increased constitutive migratory potential                            We first asked whether PD-1 could physically interact
compared to control cells. Consistently, sPD-L1 in-                           with SHP2 in TC cells. Reciprocal co-immunoprecipitation
duced, and Nivolumab inhibited, both basal and sPD-                           experiments showed that endogenous and exogenously
L1-induced migration (Fig. 2c).                                               expressed PD-1 bind SHP2 in 8505c and TPC-1 cells
  These data indicate that PD-1 intrinsic circuit sustains                    (Fig. 4a). Moreover, pull-down assays with N- or C-
TC cell proliferation and migration.                                          terminal SH2 domain of SHP2 demonstrated that SHP2
Liotti et al. Journal of Experimental & Clinical Cancer Research (2021) 40:22 Page 7 of 16 Fig. 2 Functional activity of intrinsic PD-1 in TC cells. a. DNA synthesis of 8505c and TPC-1 cells transiently transfected with pFLAG PD-1 or the relative empty vector (pFLAG), or treated or not with soluble PD-L1 (sPD-L1–1 μg/ml) assessed by BrdU incorporation. Data are presented as mean ± SD of 5 independent experiments. b. DNA synthesis of 8505c and TPC-1 cells treated with siRNA targeting PD-1 (siPD-1 – 100 nM) or the relative control (siCTR – 100 nM) for 48 h or treated with Nivolumab (Nivo - 10 μg/ml) or control IgG4 (10 μg/ml) for 24 h assessed by BrdU incorporation. Data are presented as mean ± SD of 5 independent experiments. c. Percent of migrated cells over control (empty vector transfected – pCMV3) of stably transfected 8505c PD-1 cells versus 10% FBS, or of 8505c cells treated with Nivolumab (Nivo - 10 μg/ml) or control IgG4 (10 μg/ml) toward sPD-L1 (1 μg/ml) or medium alone (NT). Data are presented as mean ± SD of 5 independent experiments. * P < 0.05 compared to the relative untreated cells. § P < 0.05 compared to sPD-L1 alone can bind PD-1 mainly through SHP2 C-terminal SH2 do- 1 overexpressing TC cells showed a significant increase of main (Fig. 4b). In support of these observations, we SHP2 staining at the plasma membrane in cells overex- found that both endogenous and exogenous PD-1 are pressing PD-1 compared to controls (Fig. 4d and Suppl. tyrosine phosphorylated in TC cells (Suppl. Fig. 4A), Fig. 4B). Although SHP2 displays a strong intracellular sig- condition necessary to allow the SH2 domains of nal, an increase of the fluorescent signal at cell boundary SHP2 to bind PD-1 [33]. and/or in surface structures (e.g., membrane protrusions, Cell fractionation of 8505c cells transiently or stably membrane ruffles) was observed in PD-1 overexpressing transfected with PD-1 was used to demonstrate that PD-1 cells as indicated by the arrows (Fig. 4d and Suppl. Fig. binding to SHP2 enforced the membrane localization of 4B). Furthermore, in 8505c cells transfected with PD-1- SHP2. Subcellular fractions of membranes (M) or cytosol GFP, we demonstrated by IF that SHP2 and PD-1-GFP (C) were obtained from PD-1 overexpressing and from co-localize at the plasma membrane (Suppl. Fig. 4C). control cells (pFLAG-PD-1 vs pFLAG or pCMV3 PD-1 cl 16 vs pCMV3). Enrichment of SHP2 levels in the mem- SHP2 dephosphorylates and activates Ras in TC cells brane fractions was observed in PD-1 overexpressing cells We then searched for the molecular mechanism of Ras compared to empty-vector transfected cells. Normaliza- activation mediated by the PD-1/SHP2 complex. We tions of each extract were obtained by using antibodies to first asked whether PD-1 could enhance GRB2 recruit- transferrin receptor for membrane fraction and anti- ment by SHP2. To this aim, we used pull-down assays tubulin for cytosolic extract (Fig. 4c). In agreement with with GST-SH2-GRB2 fusion proteins and co- these observations, immunofluorescence (IF) assay of PD- immunoprecipitation assays and we showed no
Liotti et al. Journal of Experimental & Clinical Cancer Research   (2021) 40:22                                                     Page 8 of 16

 Fig. 3 Signalling pathways downstream PD-1 activation/overexpression. a. Activation of BRAF, MEK1/2 and MAPK (p44/p42) in 8505c and TPC-1
 cells, transfected with pFLAG PD-1 or the relative empty vector (pFLAG), assessed by western blot for their phosphorylated forms. A
 representative experiment is shown. b. Activation of BRAF, MEK1/2 and MAPK in 8505c and TPC-1 cells, treated or not with sPD-L1 (1 μg/ml - 30
 min), assessed by western blot for their phosphorylated forms. A representative experiment is shown. c. Activation of BRAF, MEK1/2 and MAPK in
 8505c and TPC-1 cells, treated with siPD1 or siCTR (100 nM - 48 h) or with Nivolumab or IgG4 (10 μg/ml – 15 and 30 min), assessed by western
 blot for their phosphorylated forms. A representative experiment is shown. d. Pull-down assay with the GST-RAF1-Ras Binding Domain (RBD) of
 8505c and TPC-1 cells transiently transfected with pFLAG + pCEFL, pFLAG PD-1 + pCEFL, pFLAG + pCEFL H-Ras AU5, or pFLAG PD-1 + pCEFL H-
 Ras AU5. A representative pull-down is shown, together with the mean densitometric analysis ± SD of 5 independent assays. * P < 0.05 compared
 to the relative control

increased GRB2 binding to SHP2 in PD-1 transfected                        observed that SHP2 phosphatase activity was signifi-
TC cells compared to controls (Suppl. Fig. 4D). In ac-                    cantly increased in PD-1- versus empty-vector-
cordance with these observations, PD-1 enforced expres-                   transfected TC cells (Fig. 4e). Similar results were ob-
sion did not significantly increase SHP2 tyrosine                         tained in PD-1 stably transfected cells (not shown).
phosphorylation levels (Suppl. Fig. 4A), on which GRB2                    Consistently with the increased phosphatase activity
binding to SHP2 is dependent, nor changed substantially                   of SHP2, Ras total tyrosine phosphorylation levels, in
GRB2 compartmentalization as demonstrated in cell                         the presence of PD-1, were significantly reduced in
fractionation experiments (Fig. 4c).                                      TC cells transfected with pCEFL H-Ras AU5 (Suppl.
  Since the GRB2/SOS complex is not involved in                           Fig. 4E). To assess whether Ras dephosphorylation oc-
PD-1-mediated Ras activation, we asked whether                            curs in its inhibitory residues 32 and/or 64 [29], we
SHP2 could activate Ras through the dephosphoryla-                        used (pan) Ras immunoprecipitation followed by im-
tion of its inhibitory tyrosine residues [29, 35]. We                     munoblotting with anti-phospho Y32 (Ras) or Y64
evaluated the phosphatase activity of SHP2 and, in                        (Ras) antibodies. These experiments demonstrated
parallel, the levels of Ras tyrosine phosphorylation in                   that PD-1 enforced expression in 8505c cells reduced
cells overexpressing or not PD-1. We used a specific                      the Ras phosphorylation levels in the inhibitory tyro-
SHP2 phosphorylated substrate in the presence of the                      sine residues 32 in pCEFL Ras AU5-transfected cells
Malachite Green tracer, a colorimetric method for the                     compared to controls (Fig. 4f). Similar results were
detection of free inorganic phosphate [29]. We                            obtained in TPC-1 cells (not shown). No differences
Liotti et al. Journal of Experimental & Clinical Cancer Research      (2021) 40:22                                                         Page 9 of 16

 Fig. 4 Effects of intrinsic PD-1 on SHP2 localization and functions. a. Total cell protein extracts from 8505c and TPC-1 cells transiently transfected
 with pFLAG PD-1 or the empty vector (pFLAG) were subjected to immunoprecipitation followed by western blotting with the indicated
 antibodies. A representative experiment is shown. b. Total protein extracts from 8505c and TPC-1 cells transiently transfected with pFLAG-PD-1
 were subjected to an in vitro pull-down assay using the indicated recombinant proteins. Bound proteins were immunoblotted with antibody
 against PD-1. A representative experiment is shown. c. 8505c cells transiently transfected with PD-1 (pFLAG PD-1) or stably overexpressing PD-1
 (pCMV3 PD-1 cl16) and the relative control cells were harvested and subjected to cell protein fractionation. Membrane (M) and cytoplasmic (C)
 protein fractions were immunoblotted with the indicated antibodies. Transferrin receptor or tubulin levels were used as normalization of
 membrane and cytosolic fractions, respectively. A representative experiment is shown. d. Immunofluorescence microscopy of TPC-1 cells,
 transiently transfected with pFLAG PD-1 or the empty vector, stained with an antibody specific for SHP2. A representative experiment is shown.
 Arrows indicate the surface signal of SHP2. Bars, 5 μm. e. SHP2 phosphatase activity assay on TPC-1 and 8505c cells transiently transfected with
 PD-1 (pFLAG PD-1) and the relative control (pFLAG), assessed by using a specific SHP2 phosphorylated substrate in the presence of the Malachite
 Green tracer, a colorimetric method (absorbance at 620 nm) for the detection of free inorganic phosphate. The SHP2 phosphatase activity was
 normalized for SHP2 content as assessed by western blot. Data are presented as mean ± SD of 3 independent experiments. f. Total cell protein
 extracts from 8505c cells transiently transfected with pCEFL H-Ras AU5 + pFLAG PD-1 or empty vector (pFLAG) were subjected to
 immunoprecipitation followed by western blotting with the indicated antibodies. A representative experiment is shown, together with the mean
 densitometric analysis ± SD of 5 independent assays. * P < 0.05 compared to the relative control
Liotti et al. Journal of Experimental & Clinical Cancer Research   (2021) 40:22                                          Page 10 of 16

in phosphorylation levels of inhibitory residues 64                       (CD31) by immunohistochemistry. 8505c pCMV3 PD-1
were observed (not shown).                                                and 8505c pCMV3 xenografts exhibited statistically sig-
  Taken together, these data indicate that, in TC cells,                  nificant differences in cell proliferation rate, but not in
PD-1 binds SHP2, which in turn dephosphorylates Ras                       apoptotic rate or vessel density (Fig. 6b and Suppl. Fig.
in its inhibitory tyrosine, thus leading to the activation                5A).
of the MAPK signalling cascade.                                              To verify whether the inhibition of PD-1 by Nivolu-
                                                                          mab could affect xenograft growth of parental 8505c
PD-1-induced biologic activities in thyroid cancer cells                  cells, mice were xenotransplanted, randomized in two
require the SHP2/BRAF/MEK signalling proteins                             homogeneous groups, and administered intraperitoneally
To investigate the role of SHP2 in PD-1 functional activ-                 (i.p.) with Nivolumab (Nivo) or control IgG4 (30 mg/kg)
ity, we treated TC cells, overexpressing or not PD-1,                     twice a week. 5 weeks after xenotransplantation,
with siRNA targeting SHP2 (siSHP2–100 nM) or with a                       Nivolumab-treated tumours showed a significant de-
SHP2 allosteric inhibitor that blocks its phosphatase ac-                 crease in growth rate in comparison with the IgG4-
tivity (SHP099–350 nM) [36]. As shown in Fig. 5a,                         treated group (Fig. 6c). Consistently, Nivolumab signifi-
siSHP2 was able to significantly reduce SHP2 protein                      cantly reduced TC xenografts’ proliferation without af-
levels compared to scrambled siRNAs (siCTR). By BrdU                      fecting apoptotic rate or vessel density (Fig. 6d and
incorporation assays, we demonstrated that siSHP2 sig-                    Suppl. Fig. 5B).
nificantly decreased DNA synthesis (Fig. 5b) in PD-1-,                       Despite these experiments were carried out in im-
and to a lesser extent in empty vector-transfected, 8505c                 munocompromised mice, we could not exclude that
cells. Consistently, SHP099 inhibitor significantly re-                   Nivolumab anti-tumour activity could be ascribed to its
duced PD-1-induced DNA synthesis in 8505c cells                           ability to affect innate immunity that is present and
(Fig. 5c).                                                                functional in athymic mice. Thus, we analysed the dens-
   To investigate the role of the downstream signalling                   ity and activation of immune cells infiltrating 8505c xe-
cascade in PD-1 dependent biologic TC responses, we                       nografts treated with Nivolumab or with IgG4 by
conducted BrdU incorporation assays in TC cells over-                     cytofluorimetric analysis. We found that Nivolumab
expressing or not PD-1, in the presence or in the ab-                     treatment did not change the percentage of CD45+ leu-
sence of Vemurafenib (Vemu – 10 μM) [37], a BRAF                          cocytes infiltrating xenografts in comparison to IgG4
inhibitor, or Selumetinib (Selu – 10 μM) [38], a MEK in-                  controls, at least at 5 weeks of treatment. Moreover, the
hibitor. As shown in Fig. 5d, both drugs were able to sig-                density and the expression of polarization/activation
nificantly revert PD-1-induced DNA synthesis in 8505c                     markers of tumour-associated macrophages (TAM), of
cells.                                                                    Ly6C+ and Ly6G+ immature myeloid cells, of mature
   Similar experiments were performed to assess the role                  and immature dendritic cells and of regulatory or acti-
of the signalling cascade in PD-1-mediated TC cell mi-                    vated NK, and NKT cells, were comparable between
gration. Figure 5e shows that SHP099 and Vemurafenib,                     Nivolumab- and IgG4-treated 8505c xenografts (Suppl.
and to a lesser extent Selumetinib, were able to inhibit                  Table 1).
the migration of 8505c cells induced by sPD-L1. Similar                      These data indicate that, in our model system, PD-1
results were obtained in TC cells transfected with PD-1                   blockade by Nivolumab inhibits TC cell xenograft
(not shown).                                                              growth by affecting tumour cell rather than immune cell
   These data demonstrate that PD-1-induced cell prolif-                  compartment.
eration and motility of TC cells are dependent on the
SHP2/BRAF/MEK pathway.                                                    Discussion
                                                                          Several reports point to a promising role of immuno-
Intrinsic PD-1 signalling enhances xenograft growth of TC                 therapy in the treatment of advanced forms of TCs
cells in immunocompromised mice                                           [15, 39]. TCGA analysis of TC provided a classifica-
To verify whether PD-1 intrinsic signalling and biologic                  tion of PTC, in spite of their low mutational burden,
activity could affect tumorigenicity of TC cells, we xeno-                as “inflamed” tumours and ATC as hot tumours [40].
transplanted 8505c pCMV3 PD-1 (two clones) and con-                       Interestingly, a profiling of TC confirmed that ATC
trol 8505c pCMV3 (a mass population) cells in athymic                     and PTC are strongly infiltrated by macrophages and
mice. 8505c pCMV3 PD-1 xenografts displayed in-                           CD8+ T cells, but that these cells displayed a func-
creased tumour growth rate that was statistically signifi-                tionally exhausted appearance [11]. In TC, high PD-
cant at 4 weeks after injection, in comparison to empty                   L1 levels significantly correlated with immune infil-
vector transfected cells (Fig. 6a). End-stage tumours                     trate, increased tumour size and multifocality [17, 18].
were excised and analysed for cell proliferation (Ki-67),                 Furthermore, the presence of PD-1+ T lymphocyte in-
apoptotic rate (cleaved-caspase 3) and vessel density                     filtrating TC is associated with lymph-nodal
Liotti et al. Journal of Experimental & Clinical Cancer Research (2021) 40:22 Page 11 of 16 Fig. 5 (See legend on next page.)
Liotti et al. Journal of Experimental & Clinical Cancer Research    (2021) 40:22                                                        Page 12 of 16

 (See figure on previous page.)
 Fig. 5 Dependence of PD-1 biologic activities on SHP2/BRAF/MEK cascade. a. Effects of siRNA targeting SHP2 (siSHP2–100 nM) or the relative
 control on SHP2 protein expression levels assessed by western blot in 8505c cells stably transfected with PD-1 or the empty vector (one
 representative clone is shown). b. DNA synthesis of stably transfected 8505c pCMV3 PD-1 cells (mean of 3 clones) compared to empty vector
 transfected cells treated with siSHP2 or siCTR assessed by BrdU incorporation. Data are presented as mean ± SD of 5 independent experiments. c.
 DNA synthesis of 8505c cells stably transfected with PD-1 (pCMV3 PD-1 compared to pCMV3) and treated for 18 h with SHP099 (350 nM) assessed
 by BrdU incorporation. The mean of 3 clones is shown for each condition. Data are presented as mean ± SD of 5 independent experiments. d.
 DNA synthesis of stably transfected 8505c pCMV3 PD-1 cells (3 clones) compared to empty vector transfected cells treated for 18 h with
 Vemurafenib (Vemu - 10 μM) or Selumetinib (Selu - 10 μM) assessed by BrdU incorporation. Data are presented as mean ± SD of 5 independent
 experiments. e. Percent of migrated 8505c cells over control toward sPD-L1 (1 μg/ml) or medium alone (10% FBS) following treatment with
 SHP099 (350 nM), Vemurafenib (Vemu - 10 μM) or Selumetinib (Selu - 10 μM). Data are presented as mean ± SD of 5 independent experiments. *
 P < 0.05 compared to the relative control. § P < 0.05 compared to NT or siCTR

metastasis and recurrence [13]. Altogether, these data                       correlated with tumour stage and lymph-nodal metasta-
suggest that immune checkpoint inhibitors (ICI)                              sis in TC. Accordingly, we demonstrated that PD-1 ac-
might represent a promising tool for the treatment of                        tivity could induce proliferation and motility of TC cells
these carcinomas.                                                            in culture. This suggests that the PD-1 intrinsic pathway
  Our report, for the first time, investigated the expres-                   might have a role in TC cell aggressiveness and invasive
sion of the PD-1 receptor in epithelial thyroid cancer                       ability.
cells, demonstrating that a significant percentage of hu-                       The expression of PD-1 on cancer cells, rather than on
man TC samples displayed PD-1 expression on these                            immune cells, has been observed recently in melanoma
cells, although at lower levels compared to the expres-                      and hepatocellular carcinoma (HCC) [5, 6, 42] where
sion found on immune cells infiltrating the tumour.                          PD-1 exerts a tumor promoting function. On the other
Consistently with the evidence obtained for PD-L1 [17,                       hand, the intrinsic PD-1 expression in non-small cell
41], our data indicate that PD-1 expression levels                           lung cancer (NSCLC) has been described to exert a

 Fig. 6 Role of intrinsic PD-1 in tumorigenicity of TC cells. a. Tumour growth of pCMV3- (a mass population) or PD-1-transfected (mean of 2
 clones) 8505c cells. b. Proliferation index (Ki-67), apoptotic rate (cleaved caspase 3), and vessel density (CD31) assessed by immunohistochemistry
 of 8505c pCMV3 or pCMV3 PD-1 cell xenografts harvested 28 days post-inoculation. The relative quantifications (5 fields/sample) are shown. c.
 Tumour growth of 8505c xenografts in mice treated intraperitoneally (i.p.) at 30 mg/kg twice per week with Nivolumab (Nivo) or control IgG4. d.
 Proliferation index (Ki-67), apoptotic rate (cleaved caspase 3), and vessel density (CD31) assessed by immunohistochemistry of 8505c cell
 xenografts, treated with Nivoumab or IgG4, harvested 35 days post-inoculation. The relative quantifications (5 fields/sample) are shown.* P < 0.05
 compared to the relative control
Liotti et al. Journal of Experimental & Clinical Cancer Research   (2021) 40:22                                                           Page 13 of 16

tumor suppressor role and to represent a potential                        expression was detected compared to normal thyroids,
mechanism by which PD-1 blockade may promote can-                         and this correlated with poor tumour differentiation,
cer growth [7, 42].                                                       TNM stage and lymph-nodal metastasis [51]. These evi-
  In melanoma and HCC, intrinsic PD-1 activity sustains                   dences suggest that SHP2 may represent a potential tar-
tumour growth through an mTOR/S6K1 signalling [5, 6,                      get for TC therapy both alone and in combination with
42]. In TC cells, similarly to melanoma and HCC, PD-1                     PD-1 and/or Ras/MAPK targeting.
intrinsic signalling sustains cancer cell proliferation, but                The evaluation of PD-1 expression in cancer cell might
at variance from these neoplasias, this biologic activity is              be important to identify tumours and/or patients that
mediated by the activation of the Ras/MAPK pathway.                       will be likely to respond to ICI administration by taking
Interestingly, mutations causing the activation of the                    advantage of both drug effects on immune compartment
Ras/MAPK signalling pathway are found in > 70% of                         and on cancer cell proliferation. In few case reports or
PTC (e.g., RET/PTC rearrangements and point muta-                         in “basket clinical trials” in which ICI [i.e., Pembrolizu-
tions of the BRAF and Ras genes) and regulate transcrip-                  mab (anti-PD-1), Nivolumab (anti-PD-1), or Atezolizu-
tion of key genes involved in TC cell proliferation [43].                 mab (anti-PD-L1)] were used alone or in combination
PD-1 expression could provide a selective advantage to                    with Multikinase Inhibitors (MKI) for the treatment of
some TC by enhancing the activation of MAPK pathway,                      advanced and/or metastatic TC, encouraging preliminary
thus promoting proliferation and migratory behaviour of                   clinic evidence of efficacy has been reported [9, 52, 53].
cancer cells. Interestingly, besides PD-1, also the
immune-checkpoint Cytotoxic T lymphocyte-associated                       Conclusions
antigen 4 (CTLA-4), classically expressed on leukocytes,                  Our observations demonstrate that PD-1 is expressed on
has been found to be expressed and functional on cancer                   TC cells and exerts an intrinsic pro-tumorigenic func-
cells [44, 45].                                                           tion. Thus TC, and possibly other cancer types, could
  Our data also highlighted the key role of the SHP2                      benefit of the dual effects of ICI: the reactivation of im-
tyrosine-phosphatase in PD-1-mediated activities in TC                    mune anti-tumour response and the direct anti-
cells. Interestingly, SHP2 is recruited by PD-1 in T lym-                 proliferative effects on cancer cells. Defining the func-
phocytes, and inhibits immune receptor signalling by de-                  tional and biochemical activity of immune checkpoints
phosphorylating several downstream substrates [31, 46].                   both in cancerous cells and in tumour microenviron-
In cancer cells, SHP2 has been described to exhibit                       ment of TC will expand our knowledge allowing to de-
oncogenic properties [32, 33]. SHP2 functions as an                       velop rational therapeutic strategies for aggressive TC
adapter that binds activated receptor tyrosine kinases                    exploiting ICI in combination with SHP2 or RTK/Ras/
(RTKs) and recruits the GRB2/SOS complex on the                           MAPK inhibitors.
plasma membrane, enhancing SOS-mediated GTP load-
ing on Ras and activating the Ras/MAPK cascade [32,                       Supplementary Information
33]. SHP2 can also directly enhance Ras activity by de-                   The online version contains supplementary material available at https://doi.
phosphorylating specific inhibitory tyrosine residues on                  org/10.1186/s13046-020-01818-1.

Ras [29, 35, 47]. In our model system, we found that
                                                                            Additional file 1: Supplementary Table 1. Mouse immune cell
PD-1 exploits this last mechanism. However, we cannot                       density (expressed as percentage of CD45+ leukocytes) in 8505c
exclude that other PD-1 functions may contribute to                         xenografts.
Ras/MAPK activation. Whatever the case, we demon-                           Additional file 2: Supplementary Figure 1. Immune checkpoint
strated that, in TC cells, SHP2 is a critical factor in PD-1                expression in thyroid cancer (TC) cells. Protein expression levels assessed
                                                                            by western blot (A) and mRNA expression indicated as ΔCt for PD-1, PD-
downstream signalling, as SHP2 inhibition hampered                          L1 and PD-L2 (B) in H-6040 normal thyroid epithelial cells, PTC-derived
PD-1-mediated biological activities.                                        cell lines (BcPAP and TPC-1), and ATC-derived cell lines (8505c, CAL62,
  The majority of TC are driven by mutations that acti-                     SW1736, FRO, BHT101, HTH7, OCUT1). A representative western blot ex-
                                                                            periment is shown. PCR data are presented as mean ± SD of 5 independ-
vate the Ras/MAPK pathway. Inhibitors targeting differ-                     ent experiments.
ent proteins in this signalling cascade have been                           Additional file 3: Supplementary Figure 2. Functional activity of
developed, but their efficacy has been limited by adaptive                  intrinsic PD-1 circuit in TC cells. A. Expression levels of PD-1 in 8505c and
feedback reactivation of the pathway [48]. Interestingly,                   TPC1 cells or in 8505c and TPC-1 transiently transfected with pFLAG or
                                                                            pFLAG PD-1, assessed by western blot. A representative experiment is
SHP2 has been identified as one of the main mediators                       shown. B. Cell cycle distribution of 8505c and TPC-1 cells transiently
of adaptive resistance to inhibitors of the Ras/MAPK                        transfected with pFLAG or pFLAG PD-1, measured by Propidium Iodide
pathway in many tumors, including TC. In 8505c cells,                       (PI) staining by means of Flow Cytometry. The percent of the cells distrib-
                                                                            uted in G0/G1, S, G2/M was indicated in each panel. Representative ex-
carrying a BRAF(V600E) mutation, targeting both BRAF                        periments are shown. C. Percent of apoptotic cells assessed by TUNEL
and SHP2 with Vemurafenib and SHP099 led to a rever-                        reaction in 8505c and TPC-1 cells transiently transfected with pFLAG or
sion of adaptive resistance to either inhibitor alone [49,                  pFLAG PD-1 and treated or not with soluble PD-L1 (sPD-L1 - 1 μg/ml).
                                                                            Data are presented as mean ± SD of 5 independent experiments. D.
50]. Furthermore, in TC samples, increased SHP2
Liotti et al. Journal of Experimental & Clinical Cancer Research (2021) 40:22 Page 14 of 16 Cytofluorimetric evaluation of PD-1 expression in 8505c cells treated with activated protein kinase kinase 1; GRB2: Growth factor receptor bound siPD-1 (solid lines) or scrambled siCTR (dotted line) (100 nM). A represen- protein 2; GST: Glutathione S-transferase; SDS-PAGE: Sulphate-polyacrylamide tative experiment is shown. E. Cell cycle distribution of 8505c and TPC-1 gel electrophoresis; ECL: Enhanced chemiluminescence; PBS: Phosphate cells treated with Nivolumab (Nivo - 10 μg/ml) or control IgG4 (10 μg/ml), buffered saline; PFA: Paraformaldehyde; BSA: Bovine serum albumin; measured by Propidium Iodide (PI) staining by means of Flow Cytometry. IgG4: Immunoglobulin G4; Ki-67: Marker of proliferation Ki-67; CD31: Cluster of The percent of the cells distributed in G0/G1, S, G2/M was indicated in differentiation 31; SEM: Standard error of the mean; each panel. Representative experiments are shown. F. Percent of apop- IHC: Immunohistochemistry; sPD-L1: Soluble PD-L1; siRNA: Small interfering totic cells assessed by TUNEL reaction in 8505c and TPC-1 cells treated RNA; BrdU: Bromodeoxyuridine; Src: Proto-oncogene tyrosine-protein kinase with siPD-1 (100 nM) or Nivolumab (Nivo - 10 μg/ml) or the relative con- Src; S6: Ribosomal protein S6; AKT: Protein kinase B; 4EBP1: Eukaryotic trols. Data are presented as mean ± SD of 5 independent experiments. translation initiation factor 4E-binding protein 1; RBD: Ras binding domain; G. DNA synthesis of 8505c cells transiently transfected with pCMV3, PTPN11: Tyrosine-protein phosphatase non-receptor type 11; SOS: Son of pCMV3 PD-L1 or pCMV3 PD-L2 or treated with anti-PD-L1, anti-PD-L2 sevenless; GTP: Guanosine triphosphate; TAM: Tumour associated blocking antibodies or IgG1 isotype control (10 μg/ml) assessed by BrdU macrophages; Ly6C+: Lymphocyte antigen 6C; Ly6G+: Lymphocyte antigen incorporation. Data are presented as mean ± SD of 5 independent exper- 6G; NK: Natural killer; NKT: Natural killer T; HCC: Hepatocellular carcinoma; iments. * P
Liotti et al. Journal of Experimental & Clinical Cancer Research                  (2021) 40:22                                                                   Page 15 of 16

and Dental Sciences, Tokyo Medical and Dental University, Tokyo, Japan.                          exploiting inflammation resolution pathways. Oncoimmunology. 2017;6:
10
  Department of Laboratory Medicine and Pathobiology, University of                              e1293213.
Toronto, Toronto, Canada. 11Department of Biochemistry Faculty of Medicine,               22.    Prevete N, Liotti F, Visciano C, Marone G, Melillo RM, de Paulis A. The formyl
University of Toronto, Toronto, Canada.                                                          peptide receptor 1 exerts a tumor suppressor function in human gastric
                                                                                                 cancer by inhibiting angiogenesis. Oncogene. 2015;34:3826–38.
Received: 23 October 2020 Accepted: 15 December 2020                                      23.    Paulsen EE, Kilvaer TK, Khanehkenari MR, Al-Saad S, Hald SM, Andersen S,
                                                                                                 et al. Assessing PDL-1 and PD-1 in non-small cell lung Cancer: a novel
                                                                                                 Immunoscore approach. Clin Lung Cancer. 2017;18:220–33 e8.
                                                                                          24.    Kouketsu A, Sato I, Oikawa M, Shimizu Y, Saito H, Takahashi T, et al.
References                                                                                       Expression of immunoregulatory molecules PD-L1 and PD-1 in oral cancer
1. Yang Y. Cancer immunotherapy: harnessing the immune system to battle                          and precancerous lesions: a cohort study of Japanese patients. J Cranio
    cancer. J Clin Invest. 2015;125:3335–7.                                                      Maxillo Facial Surg. 2019;47:33–40.
2. Kruger S, Ilmer M, Kobold S, Cadilha BL, Endres S, Ormanns S, et al.
                                                                                          25.    Liotti F, De Pizzol M, Allegretti M, Prevete N, Melillo RM. Multiple anti-tumor
    Advances in cancer immunotherapy 2019 - latest trends. J Exp Clin Cancer
                                                                                                 effects of Reparixin on thyroid cancer. Oncotarget. 2017;8:35946–61.
    Res. 2019;38:268.
                                                                                          26.    Collina F, La Sala L, Liotti F, Prevete N, La Mantia E, Chiofalo MG, et al. AXL is
3. Rabinovich GA, Gabrilovich D, Sotomayor EM. Immunosuppressive strategies
                                                                                                 a novel predictive factor and therapeutic target for radioactive iodine
    that are mediated by tumor cells. Annu Rev Immunol. 2007;25:267–96.
                                                                                                 refractory thyroid Cancer. Cancers. 2019;11:785-805.
4. McNutt M. Cancer immunotherapy. Science. 2013;342:1417.
                                                                                          27.    Avilla E, Guarino V, Visciano C, Liotti F, Svelto M, Krishnamoorthy G, et al.
5. Kleffel S, Posch C, Barthel SR, Mueller H, Schlapbach C, Guenova E, et al.
                                                                                                 Activation of TYRO3/AXL tyrosine kinase receptors in thyroid cancer. Cancer
    Melanoma cell-intrinsic PD-1 receptor functions promote tumor growth.
                                                                                                 Res. 2011;71:1792–804.
    Cell. 2015;162:1242–56.
                                                                                          28.    Paladino S, Lebreton S, Tivodar S, Campana V, Tempre R, Zurzolo C.
6. Li H, Li X, Liu S, Guo L, Zhang B, Zhang J, et al. Programmed cell death-1
                                                                                                 Different GPI-attachment signals affect the oligomerisation of GPI-anchored
    (PD-1) checkpoint blockade in combination with a mammalian target of
                                                                                                 proteins and their apical sorting. J Cell Sci. 2008;121:4001–7.
    rapamycin inhibitor restrains hepatocellular carcinoma growth induced by
                                                                                          29.    Bunda S, Burrell K, Heir P, Zeng L, Alamsahebpour A, Kano Y, et al. Inhibition
    hepatoma cell-intrinsic PD-1. Hepatology. 2017;66:1920–33.
                                                                                                 of SHP2-mediated dephosphorylation of Ras suppresses oncogenesis. Nat
7. Du S, McCall N, Park K, Guan Q, Fontina P, Ertel A, et al. Blockade of tumor-
                                                                                                 Commun. 2015;6:8859.
    expressed PD-1 promotes lung cancer growth. Oncoimmunology. 2018;7:
                                                                                          30.    Knauf JA, Fagin JA. Role of MAPK pathway oncoproteins in thyroid cancer
    e1408747.
                                                                                                 pathogenesis and as drug targets. Curr Opin Cell Biol. 2009;21:296–303.
8. Zhao Y, Harrison DL, Song Y, Ji J, Huang J, Hui E. Antigen-presenting cell-
    intrinsic PD-1 neutralizes PD-L1 in cis to attenuate PD-1 signaling in T cells.       31.    Rota G, Niogret C, Dang AT, Barros CR, Fonta NP, Alfei F, et al. Shp-2 is
    Cell Rep. 2018;24:379–90 e6.                                                                 dispensable for establishing T cell exhaustion and for PD-1 signaling in vivo.
9. Liotti F, Prevete N, Vecchio G, Melillo RM. Recent advances in understanding                  Cell Rep. 2018;23:39–49.
    immune phenotypes of thyroid carcinomas: prognostication and emerging                 32.    Zhang J, Zhang F, Niu R. Functions of Shp2 in cancer. J Cell Mol Med. 2015;
    therapies. F1000 Faculty Rev. 2019;8:227.                                                    19:2075–83.
10. Naoum GE, Morkos M, Kim B, Arafat W. Novel targeted therapies and                     33.    Ran H, Tsutsumi R, Araki T, Neel BG. Sticking it to Cancer with molecular
    immunotherapy for advanced thyroid cancers. Mol Cancer. 2018;17:51.                          glue for SHP2. Cancer Cell. 2016;30:194–6.
11. Giannini R, Moretti S, Ugolini C, Macerola E, Menicali E, Nucci N, et al.             34.    Matozaki T, Murata Y, Saito Y, Okazawa H, Ohnishi H. Protein tyrosine
    Immune profiling of thyroid carcinomas suggests the existence of two                         phosphatase SHP-2: a proto-oncogene product that promotes Ras
    major phenotypes: an ATC-like and a PDTC-like. J Clin Endocrinol Metab.                      activation. Cancer Sci. 2009;100:1786–93.
    2019;104:3557–75.                                                                     35.    Kano Y, Cook JD, Lee JE, Ohh M. New structural and functional insight into
12. Bastman JJ, Serracino HS, Zhu Y, Koenig MR, Mateescu V, Sams SB, et al.                      the regulation of Ras. Semin Cell Dev Biol. 2016;58:70–8.
    Tumor-infiltrating T cells and the PD-1 checkpoint pathway in advanced                36.    Chen YN, LaMarche MJ, Chan HM, Fekkes P, Garcia-Fortanet J, Acker MG,
    differentiated and anaplastic thyroid Cancer. J Clin Endocrinol Metab. 2016;                 et al. Allosteric inhibition of SHP2 phosphatase inhibits cancers driven by
    101:2863–73.                                                                                 receptor tyrosine kinases. Nature. 2016;535:148–52.
13. French JD, Kotnis GR, Said S, Raeburn CD, McIntyre RC Jr, Klopper JP, et al.          37.    Xing J, Liu R, Xing M, Trink B. The BRAFT1799A mutation confers sensitivity
    Programmed death-1+ T cells and regulatory T cells are enriched in tumor-                    of thyroid cancer cells to the BRAFV600E inhibitor PLX4032 (RG7204).
    involved lymph nodes and associated with aggressive features in papillary                    Biochem Biophys Res Commun. 2011;404:958–62.
    thyroid cancer. J Clin Endocrinol Metab. 2012;97:E934–43.                             38.    Ball DW, Jin N, Rosen DM, Dackiw A, Sidransky D, Xing M, et al. Selective
14. Malfitano AM, Somma SD, Prevete N, Portella G. Virotherapy as a potential                    growth inhibition in BRAF mutant thyroid cancer by the mitogen-activated
    therapeutic approach for the treatment of aggressive thyroid Cancer.                         protein kinase kinase 1/2 inhibitor AZD6244. J Clin Endocrinol Metab. 2007;
    Cancers. 2019;11:1532-53.                                                                    92:4712–8.
15. Saini S, Tulla K, Maker AV, Burman KD, Prabhakar BS. Therapeutic advances             39.    Boutros C, Tarhini A, Routier E, Lambotte O, Ladurie FL, Carbonnel F, et al.
    in anaplastic thyroid cancer: a current perspective. Mol Cancer. 2018;17:154.                Safety profiles of anti-CTLA-4 and anti-PD-1 antibodies alone and in
16. Ulisse S, Tuccilli C, Sorrenti S, Antonelli A, Fallahi P, D'Armiento E, et al. PD-1          combination. Nat Rev Clin Oncol. 2016;13:473–86.
    ligand expression in epithelial thyroid cancers: potential clinical implications.     40.    Thorsson V, Gibbs DL, Brown SD, Wolf D, Bortone DS, Ou Yang TH, et al.
    Int J Mol Sci. 2019;20:1405-20.                                                              The immune landscape of Cancer. Immunity. 2018;48:812–30 e14.
17. Cunha LL, Morari EC, Guihen AC, Razolli D, Gerhard R, Nonogaki S, et al.              41.    Cunha LL, Marcello MA, Vassallo J, Ward LS. Differentiated thyroid
    Infiltration of a mixture of immune cells may be related to good prognosis                   carcinomas and their B7H1 shield. Future Oncol. 2013;9:1417–9.
    in patients with differentiated thyroid carcinoma. Clin Endocrinol. 2012;77:          42.    Yao H, Wang H, Li C, Fang JY, Xu J. Cancer cell-intrinsic PD-1 and
    918–25.                                                                                      implications in combinatorial immunotherapy. Front Immunol. 2018;9:1774.
18. Cunha LL, Marcello MA, Morari EC, Nonogaki S, Conte FF, Gerhard R, et al.             43.    Nikiforov YE. Thyroid carcinoma: molecular pathways and therapeutic
    Differentiated thyroid carcinomas may elude the immune system by B7H1                        targets. Mod Pathol. 2008;21(Suppl 2):S37–43.
    upregulation. Endocr Relat Cancer. 2013;20:103–10.                                    44.    Passariello M, Camorani S, Vetrei C, Ricci S, Cerchia L, De Lorenzo C.
19. De Falco V, Castellone MD, De Vita G, Cirafici AM, Hershman JM, Guerrero C,                  Ipilimumab and its derived EGFR Aptamer-based conjugate induce efficient
    et al. RET/papillary thyroid carcinoma oncogenic signaling through the                       NK cell activation against Cancer cells. Cancers. 2020;12:331-49.
    Rap1 small GTPase. Cancer Res. 2007;67:381–90.                                        45.    Contardi E, Palmisano GL, Tazzari PL, Martelli AM, Fala F, Fabbi M, et al.
20. Liotti F, Collina F, Pone E, La Sala L, Franco R, Prevete N, et al. Interleukin-8,           CTLA-4 is constitutively expressed on tumor cells and can trigger apoptosis
    but not the related chemokine CXCL1, sustains an Autocrine circuit                           upon ligand interaction. Int J Cancer. 2005;117:538–50.
    necessary for the properties and functions of thyroid Cancer stem cells.              46.    Rotte A. Combination of CTLA-4 and PD-1 blockers for treatment of cancer.
    Stem Cells. 2017;35:135–46.                                                                  J Exp Clin Cancer Res. 2019;38:255.
21. Prevete N, Liotti F, Illiano A, Amoresano A, Pucci P, de Paulis A, et al. Formyl      47.    Scott LM, Chen L, Daniel KG, Brooks WH, Guida WC, Lawrence HR, et al.
    peptide receptor 1 suppresses gastric cancer angiogenesis and growth by                      Shp2 protein tyrosine phosphatase inhibitor activity of estramustine
You can also read