CC 01 (chidamide plus celecoxib) modifies the tumor immune microenvironment and reduces tumor progression combined with immune checkpoint inhibitor
←
→
Page content transcription
If your browser does not render page correctly, please read the page content below

www.nature.com/scientificreports

                OPEN             CC‑01 (chidamide plus celecoxib)
                                 modifies the tumor immune
                                 microenvironment and reduces
                                 tumor progression combined
                                 with immune checkpoint inhibitor
                                 Jia‑Shiong Chen1, Cheng‑Han Chou2, Yi‑Hong Wu2, Mu‑Hsuan Yang3, Sz‑Hao Chu3,
                                 Ye‑Su Chao1 & Chia‑Nan Chen1*

                                 Immune checkpoint inhibitors (ICIs) have shown clinical benefit in solid tumors, with modest rates
                                 of clinical response. Hence, improved therapeutic approaches need to be investigated. Herein, we
                                 assessed a combination of chidamide plus celecoxib (called CC-01) combined with programmed cell
                                 death protein 1 (PD-1) blockade in a CT26 model as potent tumor microenvironment (TME) regulator.
                                 The antitumor activity was assessed by measuring tumor size, overall response rate, and survival
                                 rate. Immune profiling of tumor-infiltrating lymphocytes was performed by flow cytometry. Tumor
                                 tissues were assessed by chip assay to predict the possible pathway. Tumor size was significantly
                                 reduced in mice treated with CC-01 combined with or without anti-PD-1 antibody, however the triple
                                 combination therapy consistently demonstrated that it significantly increased both the ORR and
                                 survival rate in term of clinical applications. In the combination group, immune landscape profiling
                                 revealed decreased populations of immunosuppressive regulatory T cells, myeloid-derived suppressor
                                 cells, and tumor-associated macrophages. Analysis of the mouse tumor chip data using Gene Ontology
                                 enrichment analysis of biological processes revealed that the triple combination upregulated genes
                                 associated with responses to interferon-gamma. Our results demonstrated that CC-01 possessed
                                 potent TME regulatory properties, augmenting the antitumor effect when combined with ICIs.
                                 This antitumor effect was achieved by altering the immune landscape in TILs (tumor-infiltrating
                                 lymphocytes) and was associated with immune cell activation in the TME. Furthermore, CC-01
                                 demonstrated potent anticancer immune response activity, mainly reducing the number and function
                                 of several immunosuppressive cells. The combination of CC-01 with an ICI will further enhance the
                                 anticancer effect and boost the immune response rate. Collectively, our results support the clinical
                                 evaluation of CC-01 in combination with ICIs in several advanced cancers.

                                 Abbreviations
                                 COX2	Cyclooxygenase 2
                                 CTL	Cytotoxic T-lymphocyte
                                 DC	Dendritic cells
                                 EM	Effector memory
                                 Gzm	Granzyme
                                 HDAC	Histone deacetylase
                                 HDACi	HDAC inhibitor
                                 IFN-γ	Interferon-gamma
                                 i.p.	Intraperitoneally
                                 MDSC	Myeloid-derived suppressor cells

                                 1
                                  New Drug Research and Development Center, Great Novel Therapeutics Biotech & Medicals Corporation
                                 (GNTbm), Taipei, Taiwan. 2Department of Biology, Great Novel Therapeutics Biotech & Medicals Corporation
                                 (GNTbm), Taipei, Taiwan. 3Department of Chemistry, Great Novel Therapeutics Biotech & Medicals Corporation
                                 (GNTbm), Taipei, Taiwan. *email: alex.chen@gntbm.com.tw

Scientific Reports |   (2022) 12:1100              | https://doi.org/10.1038/s41598-022-05055-8                                          1

                                                                                                                                     Vol.:(0123456789)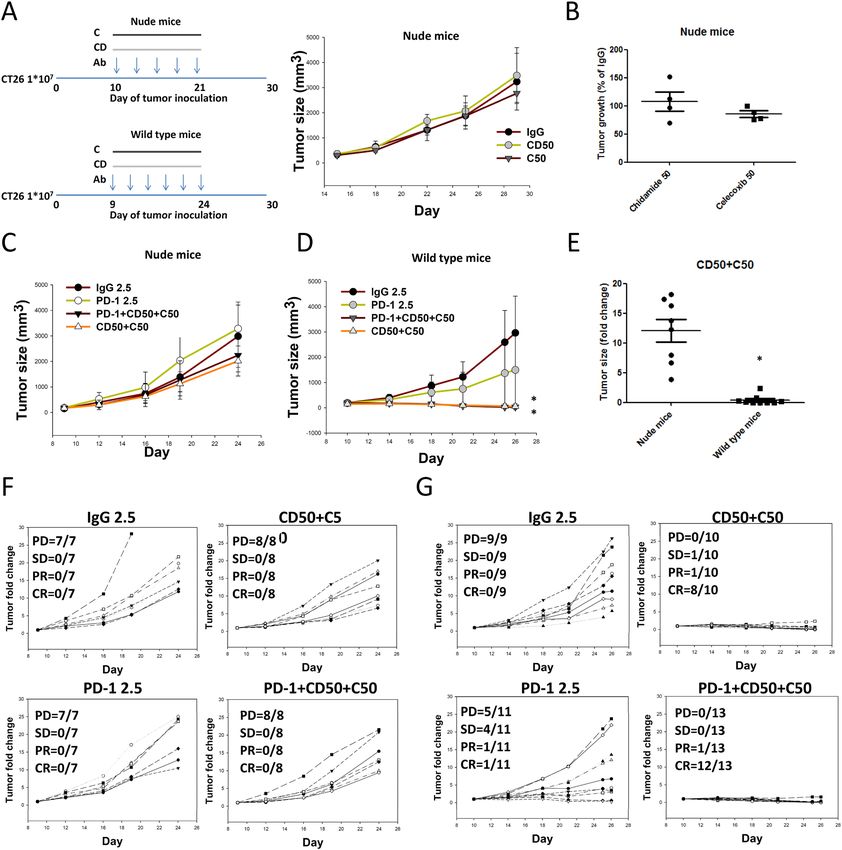
www.nature.com/scientificreports/
MHC-I/MHCII Major histocompatibility class I/class II
MS-275 Entinostat
NK Natural killer
PBMC Peripheral blood mononuclear cells
PD-1 Programmed cell death protein-1
PD-L1 Programmed cell death ligand-1
PGE2 Prostaglandin E2
PTCL Peripheral T-cell lymphoma
RE Response
RT Room temperature
s.c. Subcutaneously
SD Standard deviation
TAMs Tumor-associated macrophages
TIL Tumor-infiltrating lymphocyte
TME Tumor microenvironment
Treg Regulatory T cell
WBCs White blood cells
IL-4a Interleukin 4 receptor alpha
IL-6 Interleukin 6
IL-10 Interleukin 10
CCL8 Chemokine ligand 8
CXCL10 C-X-C motif chemokine ligand 10
CSF-1 Colony-stimulating factor-1
INF-γ Interferon-γ
NOS2 Nitric oxide synthase 2
Tumor immune evasion is a crucial mechanism that triggers tumor progression. It is generally accepted that CD8+
T cells are directly involved in antitumor cytotoxic responses, the role of CD4+ T cells in regulating antitumor
immunity has been associated with their assistance in priming of CD8+ T cells, through activation of antigen-
presenting cells (APC) and an increase in antigen presentation by major histocompatibility complex class I
(MHC-I) molecules, via the secretion of cytokines such as interferon (IFN)-γ1. Targeting immune checkpoints
by blocking monoclonal antibodies, including anti-programmed cell death protein 1 (PD-1) or anti-PD-L1
antibody, have provided clinical benefits for patients with advanced metastatic melanoma, non-small cell lung
cancer (NSCLC), renal cell carcinoma (RCC), and several other c ancers2. However, T cell activation remains
inadequate in killing most tumors, resulting in only a small fraction of patients responding to these t herapies3.
Therefore, it is imperative to investigate effective combination regimens to successfully treat patients using
immune checkpoint inhibitors (ICIs).
It is well established that tumor immune evasion involves regulatory T cells ( FoxP3+Tregs) and myeloid-
derived suppressor cells (MDSCs) to suppress tumor-specific immune responses and establish an immunosup-
pressive tumor microenvironment (TME)4. Tumor-infiltrating FoxP3+ Tregs play a direct role in promoting
immune evasion by upregulating markers associated with activation and enhanced suppressive activity, including
cytotoxic T-lymphocyte-associated protein 4 (CTLA-4), PD-1, and C D255,6. The accumulation of a higher Treg:T
effector cell ratio within tumor tissues is reportedly associated with poor prognosis in several cancers, includ-
ing ovarian7 and lung8 cancers. MDSCs consist of two major subpopulations, monocytic MDSCs (M-MDSCs)
and polymorphonuclear MDSC (PMN-MDSCs)9. In recent years, increasing numbers of preclinical and clini-
cal studies have been performed to target MDSCs with beneficial effects, resulting in tumor growth inhibition
and survival prolongation. The tumor-resident macrophages, as well as MDSCs, can differentiate into tumor-
associated macrophages (TAMs)10,11. These tissue-resident macrophages undergo changes in phenotype and
function during carcinogenesis, and proliferation seems key to maintain TAMs derived from tissue-resident
macrophages12. In the early-stage cancer, the dominant TAM phenotype is reportedly tumor-promoting (M2
macrophages), as opposed to tumoricidal (M1 macrophages)13. Colony-stimulating factor-1 (CSF-1) receptor
(CSF1R)-mediated signaling is crucial for macrophage differentiation, and the intratumoral presence of CSF1R+
macrophages correlates with poor survival in various tumor types14.
Preclinical studies have revealed that histone deacetylase (HDAC) inhibitors modulate the activation state
of the APCs to effectively prime naive Ag-specific C D4+ T cells and restore the responsiveness of tolerant T cells
15
isolated from tumor-bearing m ice . HDAC inhibitors profoundly impact T-cell development, the maintenance
of the naive T-cell compartment, and important T-cell activation pathways, all of which possibly impact anti-
tumor T-cell r esponses16. Benzamide-based class I HDAC inhibitors include well known compounds such as
entinostat (MS-275), mocetinostat (MGCD0103), chidamide (tucidinostat/HBI-8000). Currently, entinostat and
chidamide are under development for clinical trials as both single-agent and combination t herapies17. Reportedly,
chidamide selectively inhibits the activity of HDACs 1, 2, 3, and 10, demonstrating its anticancer functions as
a genuine epigenetic modulator via the following mechanisms: induction of growth arrest and apoptosis in the
blood and lymphoid-derived tumor cells; the reversal of epithelial-mesenchymal transitions and drug resist-
ance in tumor cells; importantly, enhancement of natural killer (NK)-cell and antigen-specific C D8+ cytotoxic
T-lymphocyte (CTL) mediated cellular antitumor immunity18–22. A recent study has evaluated nivolumab in
association with HBI-8000 (chidamide/tucidinostat) for i mmunotherapy23. Prostaglandin E2 (PGE2) is a critical
product of cyclooxygenase 2 (COX-2), which is overexpressed in most human cancers, affects tumor progression
and immunosuppression, and stimulates arginase-1 (ARG-1) and nitric oxide synthase (NOS)-2 secretion from
Scientific Reports | (2022) 12:1100 | https://doi.org/10.1038/s41598-022-05055-8 2
Vol:.(1234567890)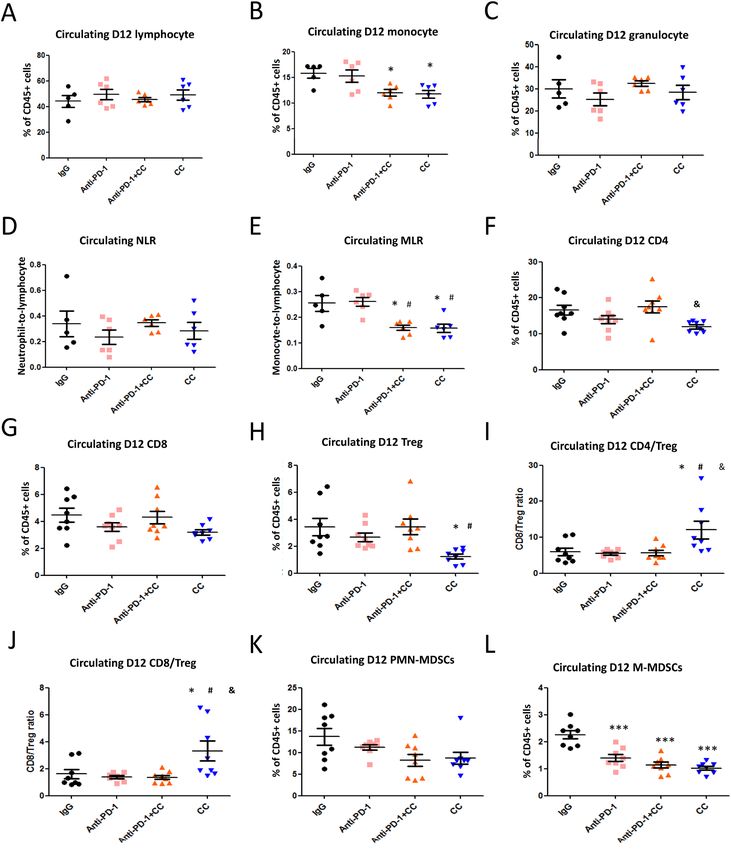
www.nature.com/scientificreports/
MDSCs24. PGE2 can induce tumor growth and suppress immune functions by promoting the development of
D4+ and C
cluster of differentiation C D25+ regulatory T cells (Tregs) in the T
ME25. Therefore, the main objective
of this study was to develop a new combination chidamide + celecoxib regimen (called CC-01) to improve tumor
clearance rates of immune checkpoint inhibitors by controlling the TME, and further improve survival rates.
Methods
Materials. Chidamide-API and chidamide-K30 (pre-formulation) were provided by GNT Biotech & Medi-
cals Co. Ltd (Taipei, Taiwan). Celecoxib-API was purchased from Aarti Drugs Ltd. (India). Celecoxib capsules
(Celebrex®, 200 mg) were purchased from Pfizer (Pfizer Canada Inc.). The following antibodies and reagents
were used for animal experiments: mouse anti-PD-1 (CD279) monoclonal antibody (RMP1-14; Bio X Cell),
mouse anti-PD-L1 (B7-H1) monoclonal antibody mouse (BE0101; Bio X Cell), anti-CTLA-4 (CD152) mono-
clonal antibody (BE0164; Bio X Cell), and rat anti-IgG2a isotype control monoclonal antibody (2A3; Bio X Cell).
illipore®, France).
Distilled water was purified using the Milli-Q distillation system (Merck M
Cell lines and cell viability assay. CT26 cells (CRL-2638; murine colorectal adenocarcinoma) were pur-
chased from ATCC. Two different cell lines, including the human breast cancer cell line, MDA-MB-231 (6 × 10³),
and the human breast epithelial cell line, M10 (6 × 10³), were seeded in 96 well of plates. Cell lines were obtained
from Bioresource Collection and Research Center, BCRC, Taiwan. All cell lines were treated with chidamide
and celecoxib, with doses ranging from 0.8125 to 50 μM, and then incubated at 37 °C under 5% CO2 for 72 h.
After 72 h, the MTT assay (Cayman™) was used to determine cellular viability. The MDA-MB-231 cell line was
maintained in Dulbecco’s Modified Eagle Medium (DMEM)/F12 supplemented with 10% fetal bovine serum
(FBS) and 0.2% antibiotic (MycoZap™, Plus-CL). The M10 cell line was maintained in MEM Alpha (Gibco™)
supplemented with 10% FBS and 0.2% antibiotic (MycoZap™, Plus-CL). The CT26 tumor cell line was cultured
in McCoy’s 5A, supplemented with 10% (vol/vol) FBS at 37 °C and 5% CO2. Gibco RPMI 1640 and DMEM with
l-glutamine were purchased from Invitrogen Life Technologies. HyClone FBS was purchased from Thermo
Fisher Scientific.
Animal models. The animal study was approved and monitored by the Taipei Medical University Institu-
tional Animal Care and Use Committee (TMU IACUC, NO: LAC-2018-0340). All experiments, 6–8-week-old
male wild BALB/C and NU-Foxn1nu nude mice (BioLASCO Taiwan) were bred in Taipei Medical University
Laboratory Animal Center under specifc-pathogen-free conditions with fresh water and rodent diet available at
all times. All mice were kept in microisolator cages under a 12-h day/night cycle and were carried out under pro-
tocols that complied with the Institutional Animal Care and Use Committee Guidelines for Ethical Conduct in
the Care. This study is reported in accordance with ARRIVE guidelines. CT26 (1 × 10⁷) cancer cells were subcu-
taneously inoculated into the right flank of each mouse, and tumors were allowed to grow for 9–11 days (tumor
size approximately 200–300 mm3) before randomization and treatment. CT26-bearing mice were intraperito-
neally administered 2.5 mg/kg of anti-IgG (Lot#65481701), anti-PD-1 (Lot#640517M1 and Lot#717918D1),
anti-PD-L1 (Lot#720619F1), or anti-CTLA-4 (Lot#702418A2B) antibody on days 11, 14, 17, 20, 23, and 26
post-tumor implantation. Anti-CD8 (Lot#BE0061) or anti-CD4 (Lot#BE0003-1) antibody was administered
200 μg/mouse 2 days before drug treatment and thereafter on days 13, 16, and 19 post-tumor implantation.
All antibodies were diluted to appropriate concentrations in 100 μL of sterile phosphate-buffered saline (PBS;
pH 7.4) (Invitrogen Life Technologies). Chidamide-K30 and celecoxib (capsule/Celebrex®, 200 mg) were orally
administrated on day 11 (dependent tumor size) post-tumor implantation. Chidamide-K30 was orally admin-
istered to treat tumor-bearing mice at doses of 12.5, 25, and 50 mg/kg, daily from days 11 to 26. Daily celecoxib
treatment (capsule/Celebrex®, 200 mg) was performed at doses of 12.5, 25, and 50 mg/kg from days 11 to 26. The
anticancer activity was measured from the start of treatment until the tumor volume reached 3000 m m3. Tumor
volume was calculated as length × width2 × 0.5. To evaluate efficacy, the following grading was defined: complete
response (CR), less than 0.5-fold tumor growth; partial response (PR), equal to or greater than 0.5-fold, equal to
or less than twofold tumor growth; stable disease (SD), greater than twofold and less than fivefold tumor growth;
progression disease (PD), equal to or greater than fivefold tumor growth, as compared to baseline. The overall
response rate (ORR) is the percentage of CR + PR.
Survival rate in animal models. Antibody or drug administration was performed from days 11 to 25 or
26. Tumor growth continued in tumor-bearing mice, and tumor volume was measured once every 3 or 4 days
(twice/week). Tumor-bearing mice were regarded as dead when the tumor volume reached 3000 mm3. Use
carbon dioxide to sacrifice mice when reaching 3000 mm3. All treatment groups were recorded and analyzed.
Flow cytometry. The following antibodies and reagents were used for flow cytometry.
CD8a PerCP-Cy5.5 (53-6.7; BioLegend), CD4 PE (GK 1.5; BioLegend), CD4 APC (GK 1.5; BioLegend), CD25
PerCP-Cy5.5 (PC61; BioLegend), Foxp3 PE (MF14; BioLegend), CD3 APC (17A2; BioLegend), CD11b APC
(M1/70; BioLegend), Ly-6C PerCP-Cy5.5 (HK 1.4; BioLegend), Ly-6G PE (1A8; BioLegend), MHC-ll-PE (BM8;
BioLegend), CD45 FITC (30-F11; BioLegend), PD-1 PE (REA 802; Miltenyi Biotec, Germany), TIM-3 APC (REA
602; Miltenyi Biotec, Germany), LAG-3 APC (C9B7W; BioLegend), GzmB PE (REA 226; Miltenyi Biotec, Ger-
many), Ki67 PE (REA 183; Miltenyi Biotec, Germany), INF-γAPC (REA 683; Miltenyi Biotec, Germany). Flow
cytometry was performed using the FACS Caliber flow cytometer (BD Biosciences), and data were analyzed with
FACSDiva™ software (BD Biosciences). To assess the levels of circulating cell populations, mouse blood samples
were collected 12 days after chidamide + celecoxib treatment initiation, with or without anti-PD-1 antibody. In
total, 150 µL of blood was collected in a K2EDTA BD Microtainer (BD Biosciences) from the right or left facial
Scientific Reports | (2022) 12:1100 | https://doi.org/10.1038/s41598-022-05055-8 3
Vol.:(0123456789)
www.nature.com/scientificreports/
vein. Red blood cells (RBCs) from anticoagulated blood samples were immediately lysed using 2 mL of 1× RBC
lysis buffer (Qiagen, Valencia, CA) for 10 min, and samples were washed twice in ice-cold PBS (BD Biosciences).
The samples were stained with the appropriate antibodies. For analysis, we used previously established pheno-
typic criteria of these cells, with CD45+/CD11b+/Ly6G+/Ly6C- cells (PMN-MDSC) and CD45+/CD11b+/Ly6G−/
Ly6C+ (M-MDSC), C D45+/CD4+/CD25+/Foxp+ cells (Treg), and C D45+/CD3+/CD4+ cells (CD4) and C D45+/
CD3+/CD8+ (CD8) T cell, CD45+/CD11b+/Ly6C+/MHCll+ (TAM), CD45+/CD8+/TIM-3+ cells (CD8+TIM-3+),
CD45+/CD8+/LAG-3+ cells ( CD8+LAG-3+), CD45+/CD8+/PD-1+ cells ( CD8+PD-1+), CD45+/CD8+/Ki67+ cells
(CD8+Ki67+), CD45+/CD8+/GzmB+ cells ( CD8+GzmB+), CD45+/CD8+/INF-γ+ cells ( CD8+INF-γ+), and total
mononuclear cells used as a common denominator. The cells were then fixed and permeabilized with BD Cytofix/
Cytoperm (BD Biosciences) and then stained with antibody against IFN-γ, Ki67, Foxp, or GzmB Ab. The cells
were sorted with a BD Accuri C6 and the data were analyzed by using BD Accuri C6 software.
To assess the level of tumor infiltrated lymphocytes, intratumoral CD8+, CD4+, Treg, PMN-MDSC, M-MDSC,
and TAM populations were analyzed. The tumor infiltrated lymphocytes were first purified from mice tumor
samples excised on day 12 after chidamide + celecoxib treatment initiation, with or without anti-PD-1 antibody.
Briefly, primary tumor tissues were harvested, weighed, and minced to fine fragments. To each sample, col-
lagenase IV (Sigma-Aldrich) at 1 mg/mL in HBSS (Invitrogen Life Technologies) was added at a ratio of 1 mL
per 200 mg of tumor tissue. Next, samples were incubated on an end-over-end shaker for 150 min at 37 °C. The
resulting tissue homogenates were filtered using a 0.4-μm filter, washed three times in PBS (BD Biosciences), and
separated by Percoll gradient to isolate mononuclear cells; 1 × 10⁶ cells per sample were used for antibody labeling.
RNA extraction, cDNA microarray experiment, and analysis. RNA extraction and microarray
hybridization experiments as previously description26. Approximately 100 mg of frozen tissue was homoge-
nized with Precellys 2 4® equipment (Carlsbad, California, USA). Next, the supernatant was used to purify total
RNA using the RNeasy Mini kit (Qiagen, Venlo, the Netherlands) according to the manufacturer’s protocol. The
quantity and purity of RNA samples were assessed with NanoDrop™ ND-1000 (Thermo Scientific, Wilming-
ton, Delaware, USA). RNA integrity was controlled with the Agilent Bioanalyzer 2100 (Agilent Technologies,
Palo Alto, California, USA). Only RNA samples with optical density (OD)260/280 > 1.8 and RIN (RNA Integrity
Number) > 6 were further processed. The labeled cRNA from 4 samples was synthesized using the two-color
microarray-based gene expression analysis Low Input Quick Amp-Labeling Kit (Agilent Technologies, Santa
Clara, USA) following the manufacturer’s standard protocol. Briefly, 0.2 μg of total RNA was amplified by a Low
Input Quick Amp Labeling kit (Agilent Technologies, USA) and labeled with Cy3 (CyDye, Agilent Technologies,
USA) during the in vitro transcription process. Then, 0.6 μg of Cy3-labeled cRNA was fragmented to an aver-
age size of approximately 50–100 nucleotides by incubation with the fragmentation buffer at 60 °C for 30 min.
Then, correspondingly fragmented labeled cRNA was pooled and hybridized with Agilent SurePrint Microarray
(Agilent Technologies, USA) at 65 °C for 17 h. After washing and drying by nitrogen gun blowing, microarrays
were scanned with an Agilent microarray scanner (Agilent Technologies, USA) at 535 nm for Cy3. Scanned
images are analyzed by feature extraction 10.7.3.1 software (Agilent Technologies, USA), an image analysis and
normalization software used to quantify signal and background intensities for each feature. Raw signal data were
normalized by quantile normalization for determining differentially expressed genes. For the functional assay,
we presented an enrichment test for differentially expressed genes (for most model organisms); Welgen Biotech
used clusterProfiler for the enrichment test for Gene Ontology (GO) and pathway [Kyoto Encyclopedia of Genes
and Genomes (KEGG)]. GO terms with statistically significant (p < 0.05) and p-value adjusted by FDR for sig-
nificance discovering. For microarray analysis, only the annotated genes were considered. Data were analyzed by
comparing treated samples against the IgG sample.
RNA isolation and real‑time reverse transcription‑polymerase chain reaction (RT‑PCR). Total
RNA was isolated and Q-PCR reaction as previously described27. Total RNA was isolated using TRIZOL reagent
(Invitrogen, Carlsbad, CA, USA) and the first-strand cDNA was synthesized from 2 μg of total RNA using the
cDNA Reverse Transcription Kit with RNase Inhibitor (Invitrogen) according to the manufacturer’s instructions.
Real-time RT-PCR was performed using SYBR Green PCR Master Mix (Applied Biosystems). The reactions
were performed using the 7500 Fast Real-Time PCR system (Applied Biosystems, Carlsbad, CA), and cycling
conditions were as follows: initial denaturation at 95 °C for 2 min, and then 40 cycles of denaturation at 95 °C for
15 s, annealing at 60 °C for 30 s, and extension at 72 °C for 1 min. Melting curve analysis was performed to assess
the amplification of the desired gene product. Data were analyzed with the 2 −ΔΔCt method, using GAPDH as the
internal control. The following primers were designed base on Primer BLAST performs and utilized for PCR:
NOS-2 Forward: CAGGTGCCCTCTAGCACTTC, NOS-2 Reverse: CTGAGGCGACAGAAGGTAGG; inter-
leukin (IL)-4Rα Forward: GTGCTTCTGAGGGAGAGTGG, IL-4Rα Reverse: TCAGAGGGAGGCTAGTGC
AT; IL-6 Forward: CCGGAGAGGAGACTTCACAG, IL-6 Reverse: TCCACGATTTCCCAGAGAAC; IL-10
Forward: TCAGAGCTCCTGGAACTGGT, IL-10 Reverse: CACCTGTGTCAACCCTTCCT; chemokine ligand
8 (CCL8) Forward: TTGTACACTGAGGGGCTTCC, CCL8 Reverse: CAAGAACTCGCTGTCCATCA; C-X-C
motif chemokine ligand 10 (CXCL10) Forward: GGATGGCTGTCCTAGCTCTG, CXCL10 Reverse: ATAACC
CCTTGGGAAGATGG; CSF1 Forward: CCTGCCACCTGTATGACCTT, CSF1 Reverse: TCTTGGGCAGGT
CTGAGAGT; transforming growth factor (TGF)-β Forward: TTTCCCATGGAGAGATGAGG, TGF-β Reverse:
CTGGCCATTTCACCAGTTTT, CSF2 Forward: TCCTAGAATGGGCAGACACC, CSF2 Reverse: CTGAGG
CATCTCCTCACCTC; INF-r Forward: TGGGCTTTGATGATGAATGA, INF-r Reverse: AGCGGGAGGCTA
GTTAGAGG.
Scientific Reports | (2022) 12:1100 | https://doi.org/10.1038/s41598-022-05055-8 4
Vol:.(1234567890)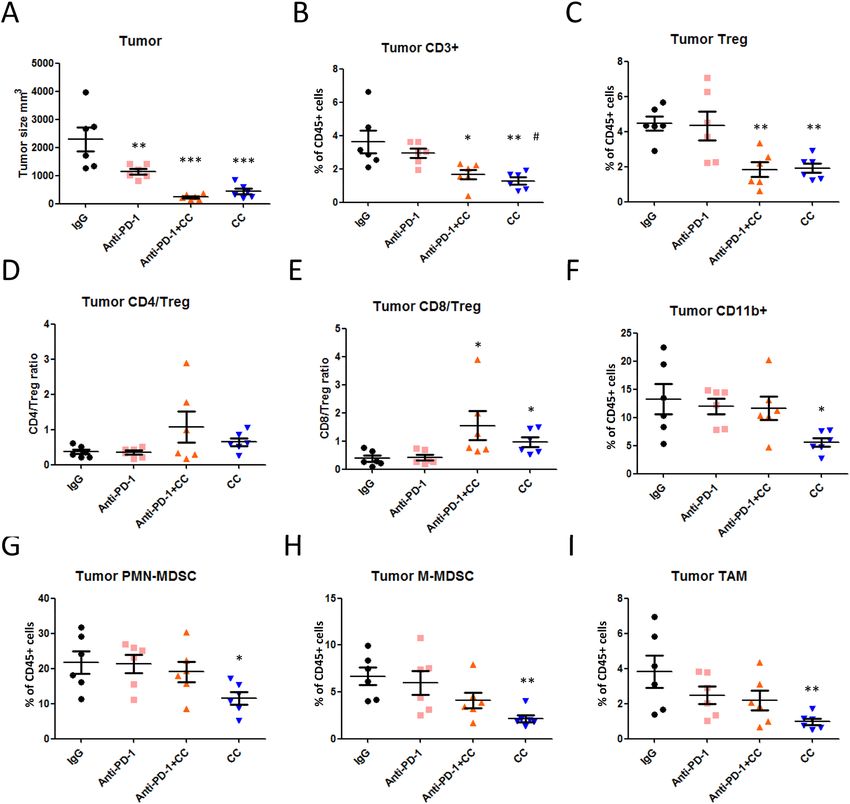
www.nature.com/scientificreports/
Statistics. All statistical analyses were performed using GraphPad Prism 5.0 (GraphPad Software, Inc., La
Jolla, CA, USA). Primary tumor growth curves, flow cytometric analyses, and in vitro assays were first analyzed
with one-way ANOVA, and individual groups were compared using Tukey’s Multiple Comparison Test. Kaplan–
Meier survival curves were analyzed with a log-rank test. Gene expression level in CT26 tumors was analyzed
by unpaired Student’s t-test.
Ethics statement. This study was carried out in accordance with the recommendations of the Medical
Animal Care and Welfare Committee of Taipei Medical University. The protocol was approved by the Medical
Animal Care and Welfare Committee of Taipei Medical University.
Results
Chidamide enhances the antitumor activity of anti‑PD‑1 antibody in CT26‑bearing
mice. Reportedly, immune checkpoint-blocking antibodies have revealed poor anticancer response rate,
which can be enhanced in combination with epigenetic a gents28. To test this hypothesis, we treated animals
bearing CT26 tumors (~ 200 mm3) with class I HDAC inhibitors, entinostat (MS-275) (20 mg/kg) or chidamide
(25 mg/kg), as well as anti-PD-1 antibody (10 mg/kg). Although repeated treatment with the anti-PD-1 antibody
or CD (chidamide) as a single agent retarded tumor growth, tumor eradication was not observed (SFig. 1A,B).
The combination of anti-PD-1 antibody with entinostat (as positive control) resulted in significant suppression
of tumor growth, but no eradication of primary tumors (complete response, CR) in 7 mice, extending survival
to 70% at day 42 after tumor implantation when compared with anti-PD-1 antibody (SFig. 1C,D). Similarly, the
combined anti-PD-1 antibody + chidamide treatment regimen showed synergistic activity, with primary tumor
eradication in 1 out of 5 mice and 40% survival at day 42 after tumor implantation (SFig. 1D). Next, we planned
to further improve the response rate to meet clinical needs.
Treatment of mice with triple combination chidamide + celecoxib + anti‑PD‑1 antibody. PGE2
is known to promote tumor progression in the T ME25. To increase the antitumor response rate, we introduced
celecoxib (a selective COX-2 inhibitor) in this treatment regimen, evaluating this hypothesis with a triple combi-
nation of anti-PD-1 Ab + chidamide + celecoxib in CT26-bearing mice. We treated animals bearing CT26 tumors
(240 ± 25 mm3 on day 11) with anti-PD-1 Ab (10 mg/kg), chidamide (12.5 mg/kg) or entinostat (20 mg/kg), and
celecoxib (25 mg/kg). The tumors responded to the anti-PD-1 Ab + entinostat + celecoxib regimen remarkably
well (Fig. 1A), eradicating primary tumors in 4 out of 7 mice, with 85% survival at day 53 after tumor implan-
tation (Fig. 1B–D). Similarly, in response to combination anti-PD-1 Ab + chidamide (12.5 mg/kg) + celecoxib
(25 mg/kg) treatment, mice with CT26 tumors revealed reduced progression of all primary tumors, eradication
of primary tumors in 3 out of 7 mice, and 71% survival at day 53 after tumor implantation (Fig. 1B–D). Con-
versely, the anticancer activity and primary tumor eradication ability of the regimen lacking chidamide were
inadequate (anti-PD-1 antibody + celecoxib 25 mg/kg). Chidamide demonstrated its most important function in
the combination treatment regimen composed of PD-1 Ab + chidamide + celecoxib (Fig. 1B–D).
Next, we investigated the optimal dosage regimen and confirmed whether the addition of celecoxib to the anti-
PD-1 antibody plus chidamide would provide additional benefits. According to our unpublished data, we have
tried chidamide 50 mg/kg and celecoxib 50 mg/kg. But we don’t know whether the drug concentration is related
to the efficacy under the condition of combined antibody. First, we evaluated the anti-PD-1 antibody dosage at
2.5, 5 and 10 mg/kg to analyze whether a low antibody dosage could demonstrate similar results in the combina-
tion regimen. The results showed no significant differences in these three groups (SFig. 2). Second, we evaluated
mice bearing CT26 tumors treated with anti-PD-1 antibody (2.5 mg/kg), with increasing doses of chidamide
(12.5, 25, and 50 mg/kg) and celecoxib (12.5, 25, and 50 mg/kg). The anti-PD-1 antibody + chidamide (50 mg/
kg) + celecoxib (50 mg/kg) regimen demonstrated the best antitumor response, with primary tumor eradication
in 3 out of 4 mice and 50% survival at day 58 after tumor implantation (SFig. 3). Based on the above findings, we
selected the low dose of the anti-PD-1 antibody for further animal experiments. Conversely, we observed that
the chidamide (50 mg/kg) + celecoxib (50 mg/kg) regimen was an optimal combination for further investigation.
To further confirm the antitumor activities of these regimens chidamide plus celecoxib with or without of
anti-PD-1 Ab, we increased the animal number and repeated these treatment regimens. Our findings showed that
tumors responded to anti-PD-1 Ab (2.5 mg/kg), with primary tumor eradication in 2 out of 8 mice, and 37.5%
survival at day 59 after tumor implantation (Fig. 2A,B,D). In the chidamide (50 mg/kg) + celecoxib (50 mg/kg)
regimen, tumor growth was significantly suppressed, with primary tumor eradication in 4 out of 9 mice, and
55.5% survival at day 59 after tumor implantation (Fig. 2A,B,D). The anti-PD-1 antibody + chidamide (50 mg/
kg) + celecoxib (50 mg/kg) regimen resulted in significant suppression of tumor growth, with primary tumor
eradication in 7 out of 9 mice, and 88.9% survival at day 59 after tumor implantation (Fig. 2A,B,D). Additionally,
the triple combination regimen with anti-PD-1 antibody + chidamide (50 mg/kg) + celecoxib (50 mg/kg) did not
increase toxicity by causing body weight loss (Fig. 2C).
To further assess the role of immune cells in the anti-tumorigenic response, we compared the response to the
triple combination regimen in immunodeficient nude mice. Cg-Foxn1nu/CrlBltw mice lack a thymus and cannot
produce T cells, thus causing immunodeficiency. In the nude mice, monotherapy with chidamide (50 mg/kg) or
celecoxib (50 mg/kg) failed to reduce tumor growth (Fig. 3A–C). However, the combination chidamide (50 mg/
kg) + celecoxib (50 mg/kg) regimen marginally reduced tumor growth in nude mice (tumor size 174 ± 39 m m3
on day 10), but significantly reduced tumor growth in wild mice (tumor size 191 ± 10 mm3 on day 9) (Fig. 3D,E).
The combination chidamide (50 mg/kg) + celecoxib (50 mg/kg) regimen was more effective in the immunocom-
petent BALB/c mice and not in immunodeficient mice (Fig. 3E). Similar results were observed with the triple
combination regimen chidamide + celecoxib + anti-PD-1 Ab, that is, showing slight antitumor activity even in
Scientific Reports | (2022) 12:1100 | https://doi.org/10.1038/s41598-022-05055-8 5
Vol.:(0123456789)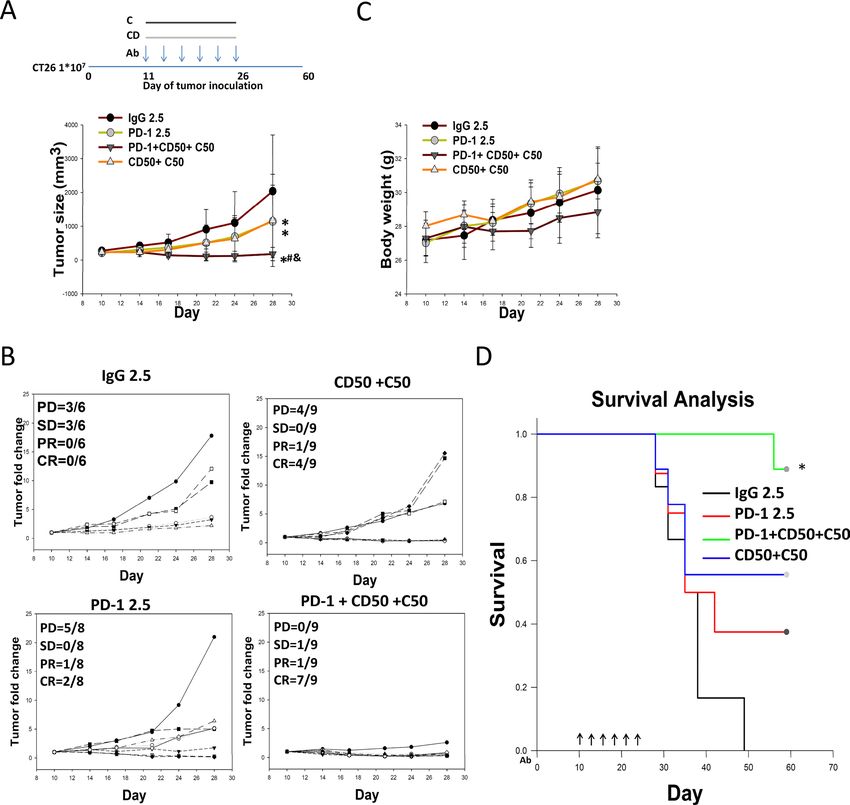
www.nature.com/scientificreports/
Figure 1. Chidamide + celecoxib enhances anti-PD-1-induced immunotherapy in an allograft CT26 mouse
model. (A) CT26 tumor-bearing mice were orally administered a chidamide-k30 solution (CD, 25 mg/kg) once
daily from days 11 to 26 (Day 11 mean TV, 200–250 mm3), entinostat (E, 20 mg/kg) once every 2 days from days
11 to 26, and celecoxib (C, 25 mg/kg) once daily from days 11 to 26. Arrows indicate the time points at which
mice were treated with the anti-PD-1 antibody. The mice were treated with anti-PD-1 antibody (10 mg/kg, i.p.)
once every 3 days on days 11, 14, 17, 20, 23, and 26. Entinostat (MS-275), as a positive control, was administered
with anti-PD-1 following the indicated schedules. (B) Endpoint tumor size is presented as tumor volume (TV)
and fold change. Results are shown as mean ± standard error of the mean (SEM). *p < 0.05 vs. anti-IgG; #p < 0.05
vs. anti-PD-1; &p < 0.05 vs. CD25. (C) Individual tumor growth graphs for CT26 tumor-bearing mice (n = 6–7).
Number of tumor-free mice per total number of mice is shown at the top left corner of each panel. (D) Survival
study of all the treatment groups.
Scientific Reports | (2022) 12:1100 | https://doi.org/10.1038/s41598-022-05055-8 6
Vol:.(1234567890)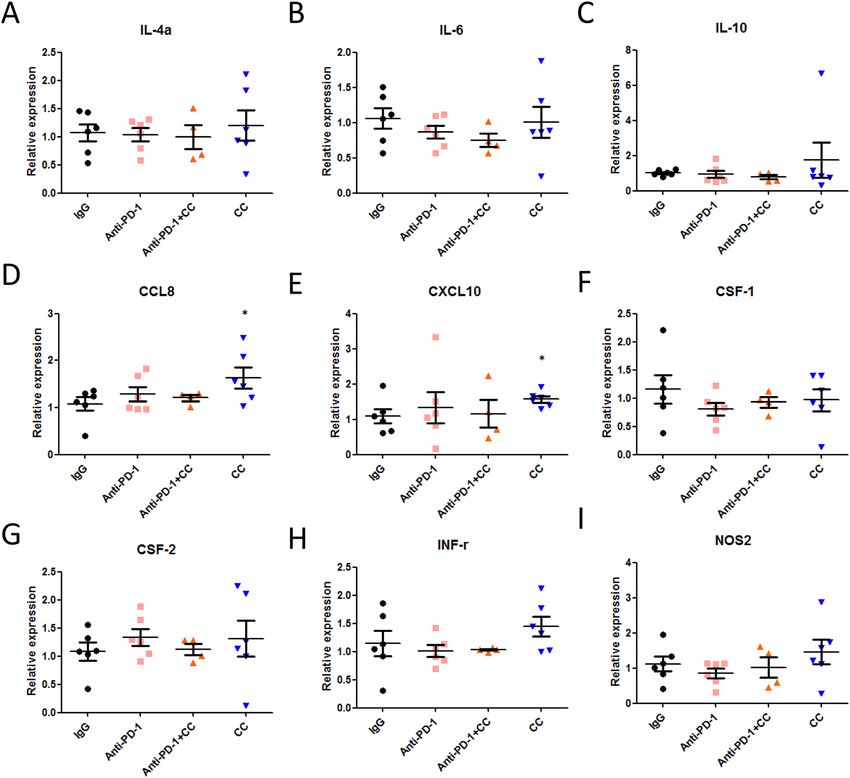
www.nature.com/scientificreports/
Figure 2. Chidamide + celecoxib suppress tumor growth and enhance anti-PD-1-induced immunotherapy
in an allograft CT26 mouse model. (A) CT26 tumor-bearing mice were orally administered a chidamide-k30
solution (CD, 50 mg/kg) once daily from days 10 to 25 (Day 10 mean TV, 240 ± 25 mm3), and celecoxib (C,
50 mg/kg) once daily from days 10 to 25. Arrows indicate the time points at which mice were treated with the
anti-PD-1 antibody. The mice were treated with anti-PD-1 antibody (2.5 mg/kg, i.p.) once every 3 days on days
10, 13, 16, 19, 22, and 25. Endpoint tumor size is presented as fold change. Results are shown as mean ± standard
deviation (SD). *p < 0.05 vs. anti-IgG; #p < 0.05 vs. anti-PD-1; &p < 0.05 vs. CD50 + C50. (B) Individual tumor
growth graphs for CT26 tumor-bearing mice (n = 6–9). Number of tumor-free mice per total number of mice is
shown at the top left corner of each panel. (C) Body weight of mice following each treatment was recorded. (D)
Survival study of all the treatment groups.
the absence of tumor-killing T cells in nude mice (Fig. 3C,D). The efficacy results of individual mice are shown
in Fig. 3F for immunodeficient mice and Fig. 3G for immunocompetent mice. To exclude the cytotoxicity effect
of chidamide and celecoxib, we performed in vitro cell model to clarify this issue. The results showed that sup-
pressed tumor proliferation, necessitating approximately 10 μM in both M10 and CT26 but > 10 μM in M231
(SFig. 4C). These results suggested that combining chidamide and celecoxib may activate immune cells such as
CTL/NK cells in the TME to reduce the tumor burden.
To evaluate whether the antitumor activity of the triple combination regimen was dependent on C D4+ or
CD8+ T cell activation, we compared the antitumor activity of triple combination regimen with and without
the presence of C D4+ or CD8+ T cells in the CT26 mouse model by using an anti-CD4 or anti-CD8 antibody
administered in wild type mice. We used flow cytometry to confirm that C D4+ T cell percentage was decreased
Scientific Reports | (2022) 12:1100 | https://doi.org/10.1038/s41598-022-05055-8 7
Vol.:(0123456789)www.nature.com/scientificreports/
Figure 3. Chidamide + celecoxib demonstrate anticancer activity by immune activation and enhance anti-PD-1-
induced immunotherapy in a wild type and immunodeficient nude mice allograft CT26 mouse model. (A) CT26
tumor-bearing nude mice were orally administered a chidamide-k30 solution (CD, 50 mg/kg) once daily from days
10 to 21 (Day 15 mean TV, 174 ± 39 mm3), and celecoxib (C, 50 mg/kg) once daily from days 15 to 29. Endpoint
tumor size is presented as tumor volume (TV; mm3). Results are shown as mean ± standard deviation (SD). *p < 0.05
vs. anti-IgG; (n = 4). (B) Tumor growth suppression % graphs for CT26 tumor-bearing nude mice. (C) CT26 tumor-
bearing nude mice were orally administered a chidamide-k30 solution (CD, 50 mg/kg) once daily from days 9 to 21
(Day 9 mean TV, 191 ± 10 mm3), and celecoxib (C, 50 mg/kg) once daily from days 9 to 24. The mice were treated
with anti-PD-1 antibody (2.5 mg/kg, i.p.) once every 3 days on days 9, 12, 15, 18, 21, and 24. Endpoint tumor size
is presented as tumor volume (TV; mm3). Results are shown as mean ± standard error of the mean (SEM). *p < 0.05
vs. anti-IgG; (n = 7–8). (D) CT26 tumor-bearing wild type mice were orally administered a chidamide-k30 solution
(CD, 50 mg/kg) once daily from days 8 to 23 (Day 10 mean tumor volume (TV), 150–190 m m3), and celecoxib
(C, 50 mg/kg) once daily from days 8 to 23. The mice were treated with anti-PD-1 antibody (2.5 mg/kg, i.p.) once
every 3 days on days 8, 11, 14, 17, 20, and 23. Endpoint tumor size is presented as TV ( mm3). Results are shown
as mean ± standard error of the mean (SEM). *p < 0.05 vs. anti-IgG; (wild type mice n = 8). (E) Tumor growth
suppression % graphs for CT26 tumor-bearing nude vs. wild type mice (n = 8 and 20). (F) Individual tumor growth
graphs for CT26 tumor-bearing nude mice (n = 7–8). Number of tumor-free mice per total number of mice is shown
at the top left corner of each panel. (G) Individual tumor growth graphs for CT26 tumor-bearing wild type mice
(n = 9–13). Number of tumor-free mice per total number of mice is shown at the top left corner of each panel.
Scientific Reports | (2022) 12:1100 | https://doi.org/10.1038/s41598-022-05055-8 8
Vol:.(1234567890)www.nature.com/scientificreports/
as a result of cell depletion by anti-CD4 antibody administered (SFig. 5A–C). Similar result was also shown in
anti-CD8 antibody depletion condition. In efficacy assay, compared with IgG treatment, treatment with anti-
PD-1, chidamide + celecoxib, or the triple combination, increased ORR despite CD4+ T cell depletion, but not in
CD8+ T cell-depleted conditions (SFig. 5D–G). These results suggested the antitumor activity of each treatment
regimen, anti-PD-1, chidamide + celecoxib, or the triple combination, was dependent on CD8+ T cell activation.
Treatment with a triple combination of class I HDAC inhibitors + COX‑1/COX‑2 inhibitors + ICIs
to classify the anticancer mechanisms. Given that the triple combination of anti-PD-1 Ab + chida-
mide + celecoxib resulted in increased anti-tumorigenic responses and improved survival in CT26-bearing mice,
we next questioned whether a triple combination composed of class I HDAC inhibitors + COX-1/COX-2 inhibi-
tors + ICIs would provide a superior anti-tumorigenic response. To evaluate this hypothesis, CT26-bearing mice
(tumor size 227 ± 14 mm3 on day 10) treated with ICIs (anti-PD-1 or anti-CTLA-4 antibody), class I HDAC
inhibitors (chidamide or mocetinostat), and COX-1/COX-2 inhibitors (celecoxib, aspirin, or ibuprofen) were
evaluated. The results showed that the combination of chidamide + celecoxib significantly reduced tumor vol-
ume, with primary tumor eradication in 5 out of 8 mice, and 75% survival at day 60 after tumor implanta-
tion (Fig. 4A,D–F). The triple combination of chidamide + celecoxib + anti-PD-1 antibody significantly reduced
tumor volume, with primary tumor eradication in 5 out of 8 mice, and 75% survival at day 60 after tumor
implantation (Fig. 4A,D–H). A triple combination of chidamide + celecoxib + anti-CTLA-4 antibody signifi-
cantly reduced tumor volume, with primary tumor eradication in 6 out of 8 mice, and 100% survival at day 60
after tumor implantation (Fig. 4C–E,H). A triple combination of mocetinostat + celecoxib + anti-PD-1 antibody
significantly reduced tumor volume, with primary tumor eradication in 3 out of 8 mice, and 62.5% survival at
day 60 after tumor implantation (Fig. 4B,D–F). Finally, we replaced the type of COX-1/COX-2 inhibitor in the
triple combination. A triple combination of chidamide (50 mg/kg) + aspirin (50 mg/kg) + anti-PD-1 antibody
significantly reduced the tumor volume, with primary tumor eradication in 3 out of 8 mice, and 37.5% survival
at day 60 after tumor implantation (Fig. 4A,D–F). A triple combination of chidamide (50 mg/kg) + ibuprofen
(50 mg/kg) + anti-PD-1 antibody partially reduced the tumor volume, with primary tumor eradication in 1 out
of 8 mice, and 25% survival at day 60 after tumor implantation (Fig. 4A,D–F). These results suggested that treat-
ment with class I HDAC inhibitors + COX-1/COX-2 inhibitors + ICIs may activate CTL/NK cells to kill tumor
cells in the TME and finally to reduce the tumor burden.
Anticancer mechanism of a triple combination regimen containing chidamide + celecoxib
(CC) + anti‑PD‑1 antibody. Next, we determined whether the combination of chidamide + celecoxib or
triple combination of chidamide + celecoxib + anti-PD-1 antibody affected the T-cell population in peripheral
blood and tumors. Blood samples were collected and isolated at day 12 after the above treatment and assessed
by flow cytometry. Our findings showed no significant changes in circulating lymphocytes and granulocytes;
however, monocytes were significantly reduced by approximately 22% after chidamide + celecoxib treatment
and 25% after chidamide + celecoxib + anti-PD-1 antibody (Fig. 5A–C, SFig. 6A). However, anti-PD-1 antibody
treatment did not significantly impact this cell population. Furthermore, neutrophil-to-lymphocyte (NLR) and
monocyte-to-lymphocyte (MLR) ratios can effectively reflect the inflammation and immune status in vivo,
which are reportedly associated with tumor progression and p rognosis29. We analyzed the NLR and MLR ratios
and revealed that the circulating MLR ratio decreased by approximately 26% after treatment with a combina-
tion of chidamide + celecoxib. After treatment with the triple combination of chidamide + celecoxib + anti-PD-1
antibody, the MLR ratio decreased by approximately 26% (Fig. 5D,E). Collectively, these results suggested that
the chidamide + celecoxib regimen potently reduced monocytes in the blood circulation of the CT26-bearing
mice model. Next, we determined whether the combination of chidamide + celecoxib affected the circulating
T-cell population. Our results showed that C D4+ T cells and F
oxP3+ Tregs were significantly reduced after treat-
ment with the chidamide + celecoxib regimen and no significantly change in triple combination (Fig. 5F–H,
SFig. 6B,C). It is well known that the CD4/Treg or CD8/Treg ratio promotes an immune response to tumors. Our
findings revealed that the chidamide + celecoxib treatment regimen significantly increased the circulating C D4+/
FoxP3+ Tregs and C D8+/FoxP3+ Tregs, suggested less immunosuppressive cells present in circulation (Fig. 5I,J).
In addition, reportedly, myeloid-derived immature cells are often elevated in tumor-bearing hosts and have
potent immunosuppressive activities. We observed that CT26 tumor-bearing mice presented reduced numbers
of circulating M-MDSCs but not those of PMN-MDSCs in each treatment (Fig. 5K,L, SFig. 6D). M-MDSCs are
positive correlation with tumor size (SFig. 6E). Based on these results, we concluded that the anti-PD-1 antibody
effects were possibly attributed to the depletion of M-MDSCs. The effects demonstrated by the combination regi-
men of chidamide + celecoxib were possibly a result of M-MDSC and Treg depletion.
Finally, to determine whether the combination of double or triple regiment impacts immune cell infiltration
within the TME, we analyzed the defense presented by CD8+ and C D4+ T cells, immunosuppressive cells such as
+
Tregs, and C D11b myeloid cells in the tumor-bearing mice. Tumors were isolated and quantified at day 12 after
treatment (Fig. 6A). Tumor-infiltrating C D3+ T cells were reduced by approximately 56% and 67% after treat-
ment with chidamide + celecoxib + anti-PD-1 antibody and chidamide + celecoxib, respectively (Fig. 6B; we also
showed CD3+ T cells number in SFig. 7A). Tumor-infiltrating C D4+ T cells were reduced by approximately 62%
and 55% after double or triple regiment treatment, respectively (SFig. 6F; we also showed C D4+ T cells number
in SFig. 7B). Similarly, for tumor-infiltrating F oxP3+ Tregs, the cell number was decreased by approximately
60% and 57% after double or triple regiment treatment, respectively (Fig. 6C; we also showed F oxP3+ Treg cells
number in SFig. 7D). Additionally, none of the treatment regimens altered cell numbers of tumor-infiltrating
CD8+ T cells (SFig. 6G; we also showed CD8+ T cells number in SFig. 7C). However, the CD8/Treg ratio was sig-
nificantly increased after double or triple regiment treatment (Fig. 6E; we also showed FoxP3+ Treg cells number
Scientific Reports | (2022) 12:1100 | https://doi.org/10.1038/s41598-022-05055-8 9
Vol.:(0123456789)www.nature.com/scientificreports/
Figure 4. Class I HDAC inhibitors (HDACi) + COX inhibitors (COXis) enhance anti-PD-1-induced
immunotherapy in an allograft CT26 mouse model. (A–C) CT26 tumor-bearing mice were administered class
I HDACi (chidamide-k30 or mocetinostat) once daily (50 mg/kg) from days 10 to 25 (Day 10 mean tumor
volume (TV), 223 ± 36 mm3), and COXis (celecoxib, aspirin, and ibuprofen) (50 mg/kg) once daily from days
10 to 25. Arrows indicate the time points at which mice were treated with immune checkpoint inhibitors (ICIs;
anti-PD-1 and anti-CTLA4 antibody). The mice were treated with anti-PD-1 antibody (2.5 mg/kg, i.p.) once
every 3 days on days 10, 13, 16, 19, 22, and 25. (D) Endpoint tumor size is presented as fold change. Results are
shown as mean ± standard deviation (SD). *p < 0.05 vs. anti-IgG; #p < 0.05 vs. anti-PD-1. (E) Individual tumor
growth graphs for CT26 tumor-bearing mice (n = 8). Number of tumor-free mice per total number of mice is
shown at the top left corner of each panel. (F–H) Survival study after treatment with class I HDACi + COXi + ICI
combination regimen.
Scientific Reports | (2022) 12:1100 | https://doi.org/10.1038/s41598-022-05055-8 10
Vol:.(1234567890)www.nature.com/scientificreports/
Figure 5. Populations of immune cells, including lymphocytes, Tregs and myeloid-derived MDSCs, in the blood circulation
of CT26-bearing mice. CT26 tumor-bearing mice were orally administered a chidamide-k30 solution and celecoxib (50 mg/
kg) once daily from days 10 to 22 (Day 10 mean tumor volume (TV), 220–240 m m3). The mice were treated with anti-PD-1
antibody (2.5 mg/kg, i.p.) once every 3 days on days 10, 13, 16, 19, and 22. Blood samples were obtained on day 12 after
treatment for analysis of circulating cell populations. (A–C) Flow cytometric analysis of lymphocytes, monocytes, and
granulocytes in peripheral blood. Results are shown as mean ± standard deviation (SD). *p < 0.05 or **p < 0.01 vs. anti-IgG.
(D,E) Ratios of neutrophil-to-lymphocyte and monocyte-to-lymphocyte in peripheral blood by Flow cytometric analysis.
Results are shown as mean ± SD. *p < 0.05 vs. anti-IgG; #p < 0.05 vs. anti-PD-1. (F–H) Flow cytometric analysis of C
D4+, CD8+,
and Treg cell populations in peripheral blood. Results are shown as mean ± SD. p < 0.05 vs. anti-PD-1 + CD + C. (I,J) CD4+/
&
Treg and CD8+/Treg ratios in peripheral blood by Flow cytometric analysis. Results are shown as mean ± SD. *p < 0.05 vs. anti-
IgG, #p < 0.05 vs. anti-PD-1, &p < 0.05 vs. anti-PD-1 + CD + C. (K,L) Flow cytometric analysis of myeloid-derived PMN-MDSC
and M-MDSC cell populations in peripheral blood. Results are shown as mean ± SD. ***p < 0.001 vs. anti-IgG (n = 6–8).
Scientific Reports | (2022) 12:1100 | https://doi.org/10.1038/s41598-022-05055-8 11
Vol.:(0123456789)www.nature.com/scientificreports/
Figure 6. Infiltrating immune cell populations of lymphocytes and myeloid-derived MDSCs in tumors. (A)
CT26 tumor-bearing mice were orally administered a chidamide-k30 solution and celecoxib (50 mg/kg) once
daily from days 10 to 22 (Day 10 mean tumor volume (TV), 220–240 m m3). Endpoint tumor size is presented
as TV ( mm3) performed on day 12 after initial treatment. Results are shown as mean ± standard deviation (SD).
**p < 0.01 or ***p < 0.001 vs. anti-IgG. Tumor-infiltrating lymphocytes were isolated by the Percoll gradient
centrifugation method. (B,C) Percentages of C D3+ T cells and Tregs in tumors by flow cytometric analysis.
Results are shown as mean ± SD. *p < 0.05 or **p < 0.01 vs. anti-IgG; #p < 0.05 vs. anti-PD-1. (D,E) CD4/Treg and
CD8/Treg ratios in tumors by flow cytometric analysis. Results are shown as mean ± SD. *p < 0.05 vs. anti-IgG.
(F) Flow cytometric analysis of myeloid-derived CD11b+ cells in tumors. Results are shown as mean ± SD.
*p < 0.05 vs. anti-IgG. (G,H) Flow cytometric analysis of myeloid-derived PMN-MDSC and M-MDSC cell
populations in tumors. Results are shown as mean ± SD. *p < 0.05 or **p < 0.01 vs. anti-IgG. (I) Flow cytometric
analysis of myeloid-derived L y6C+/MHCll+ tumor-associated macrophages in tumors. Results are shown as
mean ± SD. *p < 0.05 vs. anti-IgG.
in SFig. 7F). Next, we also investigated the CD8+ T cell populations in the tumor microenvironment on D12
in response to each treatment. The cell populations were determined as gated in SFig. 8. Tumors were isolated
and quantified at day 12 after treatment (SFig. 9A). Combination treatment had no significant change in the
D45+ cells, especially C
infiltration of leukocytes and percentage of C D45+CD8+ T cells (SFig. 9B–D). Activated
GzmB+CD8+ T cells, Ki67+CD8+ T cells, and INF-γ+CD8+ T cells were not significantly altered in each treatment
group compared with IgG treatment (SFig. 9E–G). However, exhausted TIM-3+CD8+ T cells were significantly
reduced by approximately 32.2% in the triple combination treatment group and PD-1+CD8+ T cell tend to be
Scientific Reports | (2022) 12:1100 | https://doi.org/10.1038/s41598-022-05055-8 12
Vol:.(1234567890)www.nature.com/scientificreports/
Comprising set Upregulation Downregulation
PD-1/IgG 589 224
PD-1 + CD + C/IgG 385 283
CD + C/IgG 861 389
Table 1. Gene chip analyses of gene expression in CT26 tumor grown in BALB/c mice revealed involvement
of more than 1250 differentially expressed genes.
Description P-adjust t Number of genes
PD-1/IgG
1 Cell chemotaxis 0.000562 18
2 Leukocyte migration involved in the inflammatory response 0.00297 5
3 Leukocyte chemotaxis 0.003186 14
4 Cellular response to interferon-gamm 0.01129 8
5 Response to interferon-gamma 0.01129 9
PD-1 + CD + C/IgG
1 Response to interferon-gamma 5.73E−14 25
2 Cellular response to interferon-gamma 8.78E−14 22
3 Chemotaxis 3.58E−10 52
4 Regulation of inflammatory response 3.75E−10 37
5 Myeloid leukocyte migration 3.79E−09 26
CD + C/IgG
1 Response to interferon-gamma 4.6E−13 20
2 Cellular response to interferon-gamma 4.6E−13 18
3 Regulation of inflammatory response 1.75E−10 29
4 Positive regulation of cytokine production 2.15E−10 33
5 Leukocyte migration 2.81E−10 28
Table 2. Top 5 significantly enriched GO terms. The differentially expressed genes are summarized
in the immune response. Gene Ontology enrichment analysis of biological processes for upregulated
and downregulated genes between IgG vs anti-PD-1, vs anti-PD-1 + chidamide + celecoxib, and vs
chidamide + celecoxib treated tumor samples were performed.
decreased after treatment compared with IgG control group (SFig. 9H–J). These results suggested that exhausted
CD8+ T cells are downregulated by triple combination treatment in the CT26 model.
We next analyzed myeloid-derived cells and revealed that within tumors, CD11b+ cells were signifi-
cantly reduced by 59% after chidamide + celecoxib treatment (Fig. 6F; we also showed C D11b+ cells number
in SFig. 7G). Furthermore, we analyzed myeloid-derived MDSCs and showed PMN-MDSCs and M-MDSCs
were reduced in tumors by 50% and 51%, respectively, after treatment with chidamide + celecoxib (Fig. 6G,H;
we also showed PMN-MDSCs and M-MDSCs cells number in SFig. 7H,I). Finally, we analyzed the myeloid-
derived TAMs, revealing that TAMs were reduced by 73% after treatment with chidamide + celecoxib (Fig. 6I;
we also showed TAMs cells number in SFig. 7J). These data revealed that both chidamide + celecoxib and chi-
damide + celecoxib + anti-PD-1 antibody possibility activated immune cells by reducing immune suppression
via Tregs, MDSCs, and exhausted T cells. A correlation assay revealed that the number of M-MDSCs positively
correlated with the tumor size (SFig. 6E). These results demonstrated that chidamide + celecoxib therapy was a
potent TME regulator.
Effect of chidamide + celecoxib or triple combination of chidamide + celecoxib + anti‑PD‑1 anti-
body on gene expression in the tumor microenvironment. We aimed to determine the importance
of combining regimen to induce an anti-tumorigenic response in the tumor microenvironment. To determine
gene expression profiles of tumors collected from two treated mice of each treatment group, we analyzed whole-
genome expression through a microarray platform containing coding and long intergenic non-coding RNAs.
After filtering emission intensity data in the GeneSpring 12.6 software (Agilent Technologies), each case was
classified according to its treatment, and all filtered genes were used for hierarchical clustering analysis based
on genes with different gene expressions when compared with a control group treated with anti-IgG antibody.
Twofold higher and less than half of that of the anti-IgG Ab group was the inclusion criterial. Total of
589 genes up-regulated and 224 genes down-regulated were changed in the anti-PD-1 antibody, respectively.
Moreover, total of 385 genes up-regulated and of 283 genes down-regulated were changed in the chida-
mide + celecoxib + anti-PD-1 antibody group, respectively (Table 1). Total of 861 genes up-regulated and of 389
Scientific Reports | (2022) 12:1100 | https://doi.org/10.1038/s41598-022-05055-8 13
Vol.:(0123456789)www.nature.com/scientificreports/
Figure 7. Determination of chemokines and NOS2 expression level in CT26 tumors. Total mRNA was
extracted from anti-PD-1, anti-PD-1 + chidamide (CD) + celecoxib (C), CD + C, and IgG-treated tumors (n = 4–6
for each group). mRNA levels of genes were determined by qPCR. Data are presented as mean ± standard
deviation (SD). *p < 0.05 by unpaired Student’s t-test. (A) IL-4a; (B) IL-6; (C) IL-10; (D) CCL8; (E) CXCL10; (F)
CSF-1; (G) CSF-2; (H) INF-γ; (I) NOS2.
genes down-regulated were changed in the chidamide + celecoxib group, respectively. Additionally, we performed
GO analysis, demonstrating that genes associated with “response to interferon-gamma” in the biological pro-
cess category were enriched (Table 2), demonstrating that enrichment of these gene sets is associated with TIL
(tumor-infiltrating lymphocyte) activation in gene expression. Gene expression analysis of CT26 tumors revealed
the induction of a plethora of immune-related pathways by chidamide + celecoxib (SFig. 10A–D). Treatment
with chidamide + celecoxib resulted in the upregulation of proinflammatory IFN-γ response genes (SFig. 10A).
Furthermore, chidamide + celecoxib increased the expression of granzyme genes positively associated with
D8+ T and NK cells (SFig. 10B), as well as promoted M1 macrophage differentiation rather than
responses to C
M2 (SFig. 10C,D). Similar results were observed with the triple combination chidamide + celecoxib + anti-PD-1
treatment group. These results suggested that chidamide + celecoxib, with or without anti-PD1 antibody, induced
“response to interferon-gamma”, resulting in unfavorable tumor growth in the tumor microenvironment.
Furthermore, we determined whether chidamide + celecoxib suppressed tumor-induced myeloid-derived
cell homing or immune cell infiltration to tumors. Primary tumors were collected and isolated on day 12 after
chidamide + celecoxib treatment. We performed Q-PCR analyses to analyze the chemokine and MDSC marker
expression in the CT26 tumor (Fig. 7A–I). The results revealed that chemokines, cytokines, and MDSC markers
from CT26 tumors revealed significantly altered CCL8 and CXCL10 gene expression (Fig. 7D,E). Furthermore,
Scientific Reports | (2022) 12:1100 | https://doi.org/10.1038/s41598-022-05055-8 14
Vol:.(1234567890)www.nature.com/scientificreports/
to identify the role of chemokine and cytokine genes expression related to tumor growth, we analyzed the cor-
relation between tumor size and gene expression level. The Q-PCR results from all the tumors of each treatment
group showed that several chemokines and cytokines were positively correlated with tumor size, including IL-4a,
IL-6, IL-10, CSF-1, CSF-2, INF-r, and NOS-2. Only CCL8 and CXCL10 showed a negative correlation with tumor
size (SFig. 11A–I). These results suggested that chidamide + celecoxib presented antitumor activity by increas-
ing CCL8 and CXCL10 gene expression (SFig. 11D,E) subsequently probably recruiting CTL cells in the TME.
Chidamide + celecoxib combined with anti-PD-1 antibody demonstrated antitumor activity by downregulating
multiple gene expression levels, suppressing immune cells in the tumor microenvironment.
Discussion
In this study, by using a combination treatment strategy it enabled us to understand the effect of chidamide plus
celecoxib as a combination regimen (CC-01), or further with an anti-PD-1 antibody as a triple combination regi-
men, on the immune cells in the TME of CT26-bearing mice, which resulted in enhanced antitumor responses.
CC-01 or the triple combination regimen (CC-01 + anti-PD-1 antibody) demonstrated potent eradication of
primary tumors by mediating the suppression of Tregs, myeloid-derived cells, and TAMs (Figs. 2, 3, 4), decrease
of exhausted C D8+ T cells (SFig. 8), and increased ratios of C
D4+ T/Treg and CD8+T/Treg (Figs. 5, 6). Addition-
ally, we demonstrated that the formulation of a triple combination of class I HDAC inhibitors + COX-1/COX-2
inhibitors + ICIs would provide a higher anti-tumorigenic response (Fig. 4). Finally, the induction of immune
activation by chip assay revealed that CC-01 or the triple combination regimen activated IFN-γ responsive genes,
M1 macrophage and CD8 related genes (SFig. 10, Tables 1, 2). We also identified CC-01-induced CXCL10, whose
gene expression level was negatively correlated with tumor size (Fig. 6, SFig. 11).
Immune checkpoint inhibitors, such as Anti-PD-1 or anti-PD-L1 mAbs, have improved overall survival (OS)
of patients with various types of c ancers30. However, not a few patients fail to achieve clinical benefit. Myeloid-
derived suppressor cells (MDSCs) is a heterogeneous immature population of myeloid cells partly influencing
the efficacy of immunotherapies. These cells not only directly suppress T cell but mediate a potently immunosup-
pressive network within tumor microenvironment to attenuate the anti-tumor response. According to present
studies, PD-1 antibody performed moderate anti-tumor effect possibly by regulating lymphocyte activation and
attenuating circulating M-MDSC. The results of previous study on clinical responders to ipilimumab therapy
showed a significantly lower percentage of M-MDSC in the peripheral blood as compared to non-responders31.
In addition, macromolecular therapeutic antibodies are well known to display slow extravasation and incomplete
penetration into tumors, potentially protecting cancer cells from therapeutic e ffects32. However, our studies above
collectively demonstrated that the poor anti-cancer effect of anit-PD-1antibody may be not only due to its large
size but also the lack of its effect on MDSC and other immunosuppressive cells in tumor.
Celecoxib is an anti-inflammatory drug by inhibiting COX2, with potent antitumor activity in the treatment
and prevention of cancer33. PGE2 can activate several key immune-suppressive cells present in the TME such as
Treg, M-MDSC, and TAM. However, monotherapy fail to achieve preclinical benefit34. Currently our study also
demonstrated inhibition of COX has no synergy with anti-PD-1 blockade in inducing eradication of tumors
(Fig. 1C). In addition, chidamide monotherapy performed poor anti-cancer effect on CT26 tumor-bearing mice,
but class I HDAC inhibitor have potential to attenuate immunosuppressive cells in T ME28. Therefore, we were
interested in evaluating a combination of celecoxib + chidamide. In our current study, we revealed the optimal
dosage of chidamide (50 mg/kg) and celecoxib (50 mg/kg) in the combination regimen. We observed that CC-01
demonstrated a potent immune response by down-regulating the cell number of M-MDSCs, Tregs, and TAMs
in TME. Furthermore, we demonstrated that CC-01 in combination with immune checkpoint blockade, as a
triple regimen, presented a significantly increased immune response in CT26 tumors.
To confirm the anticancer mechanisms of the triple combination regimen through immunomodulation, we
evaluated several class I HDAC inhibitors (chidamide, entinostat, and mocetinostat), COX-1/COX-2 inhibitors
(aspirin, ibuprofen, and celecoxib), and ICIs (anti-PD-1/anti-CTLA-4 antibody) in different regimens. In the
triple regimens investigated, anti-CTLA-4 antibody demonstrated great efficacy probably by suppressing the
inhibition of dendritic cell activity via CTLA-4 blocking on Tregs, and subsequently activating T cells in lymph
nodes/tissues35, when synergistically combined with CC-01 treatment. Furthermore, the anti-PD-1 antibody plus
CC-01 triple combination regimen demonstrated similar results, probably by direct PD-1 blockade to augment T
cell activation synergistically with CC-0135. Both anti-CTLA-4 antibody and anti-PD-1 tested were highly effec-
tive in the triple combination. Finally, it has been known that several class I HDAC inhibitors (valproic acid, pan-
obinostat and entinostat) modulate PD-L1 expression36, suggested possible benefit when combined with immune
checkpoint blockade can be highly effective to achieve preclinical benefit in current study. However, PD-1+ regula-
tory T cells amplified by PD-1 blockade promote hyperprogression of cancer was demonstrated in animal study
in which murine Tregs that were deficient in PD-1 signaling were more proliferative and i mmunosuppressive37.
Therefore, in our study the circulating Tregs shown in flow cytometry data was significantly different in cell num-
ber between CC-01 and triple combination (Fig. 5H), suggesting that anti-PD-1 neutralized CC-01 attenuation
on Treg cell number. Our findings indicated that these class I HDAC inhibitors possessed a similar mechanism
to antitumor activation. The efficacy of the ibuprofen-containing triple combination regimen was not significant
owing to its lower half-life than COX-2 inhibitor celecoxib, partially reducing the tumor volume and failing to
effectively eradicate primary tumors. Similar results were observed with aspirin-containing triple combination
treatment, with failure to demonstrate remarkable primary tumor eradication. In summary, because tumors are
highly heterogeneous and dynamic in their own environment, differences in tumor volume may respond dif-
ferently due to different cell composition. The previous study demonstrated that lymphocyte and C D8+ T cells
number decreased in ≧ 8 cm undifferentiated pleomorphic sarcomas (UPS) than < 8 cm UPS38. We have also
observed that when the smaller the tumors at the starting point of administration, the better the efficacy would
Scientific Reports | (2022) 12:1100 | https://doi.org/10.1038/s41598-022-05055-8 15
Vol.:(0123456789)You can also read