PERFORMANCE CHARACTERIZATION OF THE HICIAO INSTRUMENT FOR THE SUBARU TELESCOPE
←
→
Page content transcription
If your browser does not render page correctly, please read the page content below
Performance characterization of the HiCIAO instrument for
                   the Subaru Telescope
Ryuji Suzukiab , Tomoyuki Kudobc , Jun Hashimotod , Joseph Carsone , Sebastian Egnerb , Miwa
  Gotoe , Masayuki Hattorib , Yutaka Hayanob , Klaus Hodappf , Meguru Itob , Masanori Iyec ,
 Shane Jacobsonf , Ryo Kandoric , Nobuhiko Kusakabec , Masayuki Kuzuharag , Taro Matsuoc ,
  Michael Mcelwainh , Jun-ichi Morinoc , Shin Oyab , Yoshihiko Saitob , Richard Sheltonf , Vern
   Stahlbergerf , Hiroshi Sutoc , Hideki Takamib , Christian Thalmanne , Makoto Watanabeib ,
                           Hubert Yamadaf , and Motohide Tamurac
a Thirty   Meter Telescope Observatory Corporation, 2632 E.Washington Blvd., Pasadena, CA,
                                             U.S.A 91107;
                b Subaru Telescope, 650 North A’ohoku Place, Hilo, HI, U.S.A 96720;
 c National Astronomical Observatory of Japan, 2-21-1 Osawa, Mitaka, Tokyo, Japan 181-8588;
    f University of Hawai’i, Institute for Astronomy, 640 North A’ohoku Place, Hilo, HI, U.S.A

                                                96720;
       e Max Planck Institute for Astronomy, Konigstuhl 17, Heidelberg, Germany D-69117;
   d Graduate University for Advanced Studies, 2-21-1 Osawa, Mitaka, Tokyo, Japan 181-8588;
             g The University of Tokyo, 2-21-1 Osawa, Mitaka, Tokyo, Japan 181-8588;
    h Princeton University, Department of Astrophysical Sciences, Peyton Hall, Princeton, NJ,

                                           U.S.A 08544-1001;
i Hokkaido University, Department of Cosmoscience, Kita-10-Nishi-8, Kita, Sapporo, Hokkaido,

                                            Japan 060-0811

                                                 ABSTRACT
HiCIAO is a high contrast instrument which works with a 188 element adaptive optics system (AO188) for the
Subaru Telescope. The instrument is specifically designed for extrasolar planet search and studies of proto-
planetary or debris disks. A coronagraph technique and some differential observing modes implemented in
HiCIAO extract faint objects from the sea of speckle around bright stars. We describe the instrument perfor-
mances verified in the laboratory and during the commissioning period. Readout noise with a correlated double
sampling method is 15 e− using the Sidecar ASIC controller with the HAWAII-2RG detector array. The readout
noise becomes as low as 5 e− with a multiple sampling method. Strehl ratio obtained by AO188+HiCIAO on
the sky is 0.4 and 0.7 in the H and K-band, respectively, with R ∼ 5 stars under median seeing conditions.
Image distortion is correctable to 7 milli-arcsec level using the ACS data as a reference image. Some examples
of contrast performances in all observing modes are presented from a limited number of observations. An ADI
observation for HR 8799 shows a clear detection of three known planets, demonstrating high contrast capability
of AO188+HiCIAO.
Keywords: near-infrared, camera, coronagraph, high contrast, adaptive optics

                                            1. INTRODUCTION
National Astronomical Observatory of Japan has developed a new high contrast instrument for the 8.2 m Subaru
Telescope under collaboration with the University of Hawaii, Institute for Astronomy. The instrument called
HiCIAO is designed to work with a newly developed 188 element adaptive optics system (AO188; Hayano et
    Further author information: (Send correspondence to R.S.)
R.S.: E-mail: ryuji@tmt.org, Telephone: 1 626 395 8956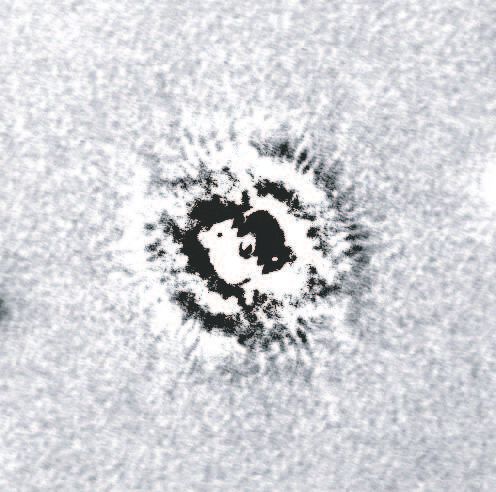
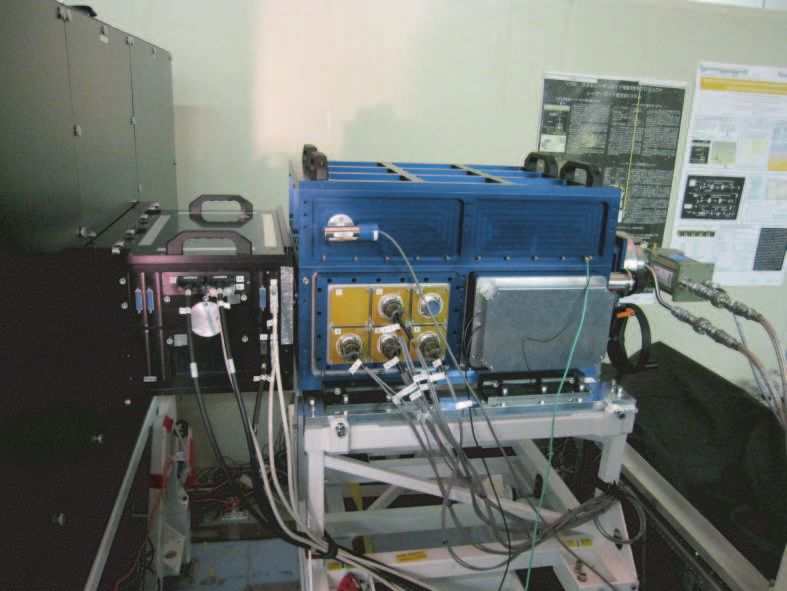
Figure 1. HiCIAO at the observing position on the Nasmyth floor of the Subaru Telescope. A black wall on the left side
is AO188.

al. 20101 ), and is specific to extrasolar planet search and detailed disk sciences. The basic concept of the
instrument is utilizing a high quality wavefront from the adaptive optics, coronagraph, and some differential
imaging techniques to enhance the contrast in the vicinity of bright stars where speckle noise hinders the planet
or disk detection. The instrument is an infrared imager which consists of a warm coronagraph/collimator module
and a cryogenic infrared camera module (Figure 1). The fundamental instrument parameters are summarized
as 20′′ × 20′′ field of view with 10 milli-arcsec pixel scale and wavelength coverage from 0.80µm to 2.4µm. A
simple Lyot type coronagraph with hard-edged opaque circular occulting masks and an undersized Lyot stop are
implemented in the warm coronagraph module. The warm coronagraph module also includes single and double
Wollaston prisms which split the light into two or four directions for the differential imaging techniques. The
cryogenic infrared camera module houses filters and a 2048×2048 pixel HAWAII-2RG infrared detector array
(Teledyne Scientific & Imaging LLC.). Two filter wheels are located near the pupil and the detector for a spectral
differential imaging mode as well as a normal imaging mode. Detail of the instrument concept and design is
described in Hodapp et al. (2006;2 20083 ) and Tamura et al. (2006).4
    HiCIAO currently supports a normal imaging mode (DI mode) and three differential imaging modes with
different techniques: Polarimetric Differential Imaging mode (PDI mode), Spectral Differential Imaging mode
(SDI mode), and Angular Differential Imaging mode (ADI mode). The ADI mode can cooperate with any of
other observing modes such as DI+ADI, PDI+ADI, and SDI+ADI mode. An example of the images in each
observing mode is shown in Figure 2. The DI mode is a normal imaging mode with 20′′ × 20′′ field of view with
a set of standard broadband filters in the near-infrared regime. In the PDI mode, two images with 10′′ × 20′′
each corresponding to two directions of polarization are obtained at the same time using the single Wollaston

                           20"                            10"

                                                                                              5"

                                                                                      λ1      λ2     5"
        20"                                  20"         o-ray        eo-ray
                                                                                               λ3      λ4

        Figure 2. Arrangement of the image in the DI mode (left), PDI mode (center ), and SDI mode (right).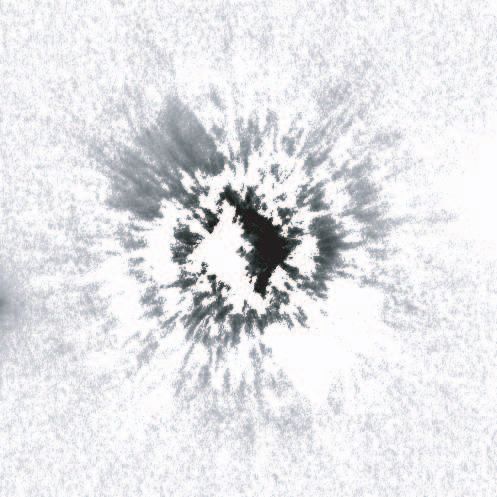
prism. The single Wollaston prism combined with a half wave plate located between the telescope and AO188
constitutes a dual beam polarimeter. The PDI mode provides a powerful tool to find a proto-planetary/debris
disk around the bright star since subtracting two images reduces the unpolarized speckle pattern of the bright
star and only leaves the polarimetric signature of the disk. The SDI mode has two Wollaston prisms which split
the light into four directions. The light in each direction is recorded through a separate filter located in front of
the detector. The resulting image on the detector is then a collection of four images with 5′′ × 5′′ each taken with
four different filters at the same time. The SDI mode is effective to find a self-luminous gaseous planet bearing a
spectroscopic feature such as methane absorption near the bright star as the subtraction of two or more images
taken at different wavelengths enhances the spectroscopic feature of the planet while the speckle pattern of the
bright star is subtracted out after appropriately scaling intensity and speckle pattern. Finally, in the ADI mode
the rotation angle is controlled by an image rotator so as to keep the orientation of the pupil constant on the
detector. As a result, the target star’s PSF including the speckle pattern and the residual spider pattern remains
fixed on the detector throughout the observation, while any planet in the field of view moves along an arc as the
sky rotates. During data reduction, this sequence of images can be exploited to estimate and subtract the fixed
stellar PSF while leaving the planet signals intact. Finally, the frames are de-rotated into a fixed position angle
and co-added. An important advantage of the ADI mode is that the ADI technique works equally well on any
kinds of self-luminous companions as it does not assume spectral feature as the SDI mode does.
   This paper concentrates on reporting the performances of the instrument based on the data obtained in the
laboratory and during the commissioning period. Imaging performance, detector performance, and coronagraphic
performance are described in dedicated sections.

                                    2. DETECTOR PERFORMANCE
2.1 RAW IMAGE
Figure 3 (left) shows a dark image as an example of the raw image. There are two significant features in the raw
image due to the characteristics of the current readout system using a Sidecar ASIC and JADE2 card (Teledyne
Scientific & Imaging LLC.): 32 horizontal stripe patterns corresponding to 32 readout channels, and vertical
banding patterns with a combination of some frequencies. Both patterns appear on the image in a random
manner. In order to remove the horizontal stripe patterns, extra pixels called “reference pixels” are provided
along the edges of the detector which have the same characteristics as rest of the pixels, but are not light sensitive.
This “reference pixel subtraction” removes the horizontal stripe patterns almost completely. It also works for
the vertical banding patterns, but some residuals persist as shown in Figure 3.
   Another way to remove the patterns is to use a part of the image that has virtually no light signals. As
the horizontal stripe patterns only differ in their offsets and the vertical banding patterns commonly exist in 32
horizontal stripes, extracting a common part of the patterns as a master pattern improves the pattern subtraction.

Figure 3. Left: Example of the raw image. Center : Image with the horizontal stripe patterns removed by “reference pixel
subtraction”. Right: Image with the horizontal and vertical patterns removed by “master pattern subtraction”.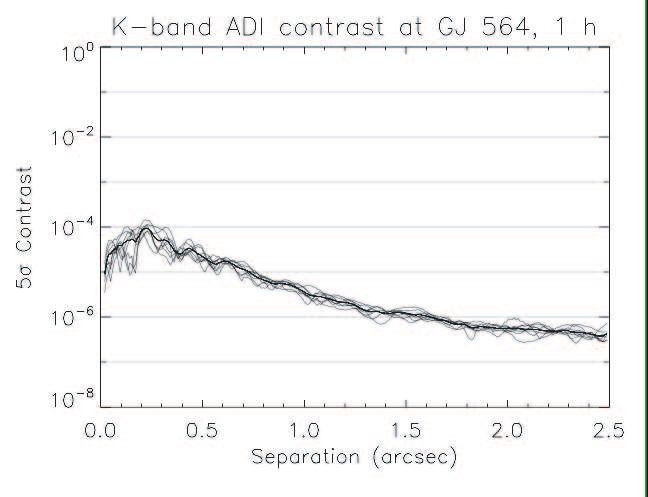
16
                                                                                    y = 15/sqrt(x) + b
                                                                                                 Data
                                              14

                                              12

                                 Noise (e-)
                                              10

                                               8

                                               6

                                               4
                                                   0   2     4     6        8       10       12          14   16
                                                                 Number of multi-sampling

                                                                                                √
          Figure 4. Readout noise with the multiple sampling method. A solid curve represents 1/ N law.

A master horizontal stripe is created as a median image of the 32 horizontal stripes with a box filter after masking
objects in the image. Subtracting the master stripe from each stripe after an appropriate offset removes the
horizontal stripes and leaves only the vertical bandings in the image. A similar process creates a master vertical
bandings from the 32 horizontal stripes without the box filter, and removes the pattern with much less residual
as shown in Figure 3. We note that this “master pattern subtraction” method is only applicable under a certain
condition where the detector has enough area with no light signals.

2.2 GAIN
Detector gain g in e− /ADU is derived by a photon transfer curve which is expressed in a form,

                                                              2        2             S
                                                             σtotal = σread +                                      (1)
                                                                                     g
where σtotal is total noise, σread readout noise, and S signal, all in units of ADU. An aluminum plate at ambient
temperature is used as a light source in the K-band. A least square fitting of the formula to the data yields the
detector gain of 1.60 e− /ADU.

2.3 READOUT NOISE
Readout noise of the detector is measured using the dark image with the patterns removed following the “master
pattern subtraction” method written in section 2.1. The readout noise of 15 e− is obtained with a single correlated
double sampling (CDS) method. Then we investigated how a multiple sampling method reduces the readout          √
noise. Figure 4 shows the readout noise with different numbers of sampling. The readout noise follows a 1/ N
law at least to N = 16 where we obtain readout noise of 5 e− . It is noted that additional overhead of 2.8 N
seconds are necessary for the multiple sampling method.

2.4 DARK CURRENT
Dark current is measured by taking dark images with different exposure times. A black-painted aluminum plate
at 77 K was placed in front of the detector to prevent the light from reaching the detector. The detector is
operated at 60 K. The dark current measurement is not as straightforward as it is usually done because of the
variable horizontal stripes described in section 2.1. The dark current is then derived from the total noise with
different exposure times using the following formula,

                                                            2        2            ndark t
                                                           σtotal = σread +                                        (2)
                                                                                   g2
where σtotal is total noise in ADU, σread readout noise in ADU, ndark dark current in e− /s, g detector gain
derived in section 2.2, t exposure time. A least square fitting of the formula provides the dark current of 0.046
e− /s which is sufficiently low for our purpose where exposure time barely exceeds a few minutes.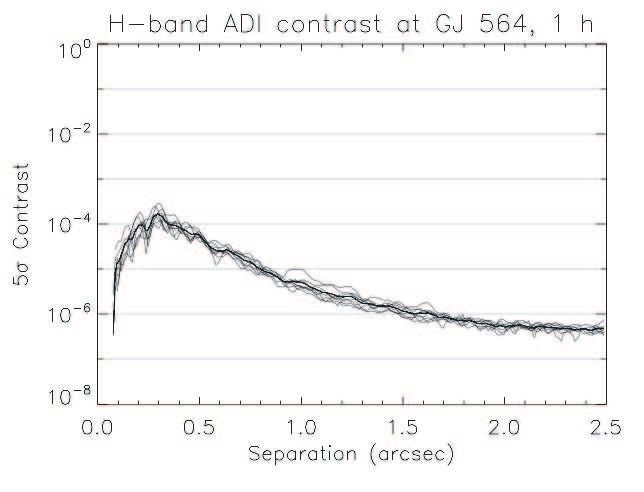
50 pix
                                                   2000

                                                   1500

                                  Position (pix)
                                                   1000

                                                    500

                                                     0

                                                          0   500       1000         1500      2000
                                                                    Position (pix)

Figure 5. Distortion map of the DI mode image. Arrows show the amount of distortion for a grid pattern. The distortion
is magnified 5 times for the illustrative purposes.

                                                   3. IMAGING PERFORMANCE
3.1 STREHL RATIO
Strehl ratio of AO188+HiCIAO is calculated by comparing peak-to-total flux ratio between observed and sim-
ulated PSFs. From a limited number of stars observed so far, we have obtained an average Strehl ratio of 0.4
and 0.67 in the H-band and K-band, respectively, with a guide star of R ∼ 5 under natural seeing of 0.5′′ in
the H-band. The Strehl ratio derived from the HiCIAO data is consistent with a result of other instrument
for Subaru Telescope which works with AO188. FWHM of the PSF directly measured without assuming profile
is 0.06′′ and 0.07′′ in the H-band and K-band, respectively. It is noted that the performance characterization
efforts in the laboratory show that the Strehl ratio of HiCIAO itself is almost unity as expected from the optical
design.

3.2 DISTORTION
We observed M15 to derive a distortion correction function in the DI mode. Coordinates of the stars extracted
by SExtractor (Bertin & Arnouts 19965 ) are compared to those obtained by the ACS instrument on board the
Hubble Space Telescope. We assume that the distortion of the ACS images is corrected at least at the level such
that they can serve as reference images for HiCIAO. A fifth order polynomial for x and y coordinates are used to
express the distortion correction function in a least square fitting process. The distortion pattern is characterized
by a different pixel scale in x and y direction and non-linear effect corresponding to higher order terms. The
difference in the pixel scale is 3 %, and this is consistent with the amount caused by a compensator which is a
tilted wedged plate located in a converged beam. RMS of the residual of the object corrdinates from the best
fit polynomial is 0.78 pix or 7 milli-arcsec in the entire 20′′ × 20′′ field. The residual has a random pattern, and
should be due to a measurement error of the centoid of HiCIAO PSFs.

3.3 PIXEL SCALE
Pixel scale is derived by measuring distance of a binary star with known angular distance in the pixel unit on the
image. We observed a binary star (HIP 482) with 7.687 arcsec separation with the H-band in the DI mode. The
distortion is corrected by the distortion correction function derived in section 3.2. Measurement at five different
dithered positions gives the pixel scale of 9.406 ± 0.004 milli-arcsec/pix. The accuracy is again limited by the
measurement error of the centroid of the HiCIAO PSFs.
3.4 THROUGHPUT
Throughput is calculated using the following formula,
Cobj g
γ= (3)
Fλ,obj Atel ∆λ
where Cobj is a count rate of an object in ADU/s, g the detector gain in e− /ADU, Fλ,obj the photon flux of the
object in photon/s/cm2 , Atel the effective area of the telescope in cm2 , and ∆λ the passband width of a filter in
µm. The throughput calculated by the formula above includes atmospheric transmission, telescope throughput,
throughput of AO188, transmission of the instrument optics, and the detector QE. From a number of stars with
known brightness observed at different zenith angles, the throughput at a zenith position is calculated as 0.09,
0.11, and 0.16 in the J, H, and K-band, respectively. The results agree with the numbers expected from the
reflectivity of AR coatings, filter transmission, Lyot stop size, detector QE, and measured throughput of the
telescope and AO188.
3.5 BACKGROUND BRIGHTNESS
We use background regions of the images taken with a long exposure time for the background brightness estima-
tion. Zero points of the magnitude are used for conversion between the counts and the magnitude. The resulting
background brightness is 15.2, 13.2, and 10.1 mag/arcsec2 (Vega) in the J, H, and K-band, respectively. The
result in the J-band and the H-band is consistent with an average sky brightness of Mauna Kea, while the
background in the K-band is brighter than the average because of thermal radiation from the optics at ambient
temperature in AO188 and HiCIAO.
3.6 LIMITING MAGNITUDE
Limiting magnitude is calculated using the measured values described so far. The limiting magnitude with 1 hour
exposure, 5 σ level, and 0.075′′ aperture is 24.05, 23.69, and 22.17 mag (Vega) in the J, H, K-bands, respectively.
The shallower limiting magnitudes compared to similar instruments on the other 8-m class telescopes originate
from the undersized Lyot stop which cuts off 50 % of the light collected by the telescope.
3.7 GHOST
Ghost image is investigated both in the laboratory and on the sky. In the laboratory using a light source with
Strehl ratio of ∼1, no ghost image brighter than 10−6 of the ghost source is found outside of 0.5′′ radius when
the occulting mask is used in the DI mode. On the sky, there are two occasions where the ghost image has been
found so far in the course of contrast analysis and ghost measurement analysis: one is an observation in the DI
mode without the occulting mask, and the other is an observation in the SDI mode without the occulting mask.
The ghost image in the DI mode is a pupil-like ghost with its contrast 10−5.6 of the ghost source per pixel and
size 260 pix in radius. On the other hand, the ghost image in the SDI mode is a point-like ghost. It is generated
by a double-bounce reflection of the light between the detector surface and the surface of the differential filter.
The ghost can be found in all four channels of the SDI image. The location is either 0.31 or 0.67 from the ghost
source depending on the channel, and the contrast is 10−4.3 of the ghost source.
4. CONTRAST PERFORMANCE
In this section, we demonstrate contrast performance in the different observing modes. Due to a limited observing
time and variable atmospheric condition, it turns out difficult to make a representative contrast estimate for each
observing mode. The results shown here should be considered as an example of performance that the instrument
can achieve. Accumulation of the data in the future will enable more comprehensive performance evaluation for
each observing mode as well as comparison between the observing modes. A summary of the observations is
shown in Table 1.
The observation procedure of the coronagraphic observation is as follows: (1) slewing the telescope for target
acquisition, (2) closing the AO loop and tuning the control parameters, (3) aligning the Lyot stop to the pupil
in the pupil-viewing mode, (4) centering the object on the occulting mask, and (5) starting science exposures.Table 1. Summary of the observations for the contrast evaluation.
Object Observing mode Filter Occulting mask Exposure time R H K
GJ 564 DI H 0.6′′ 160 s 5.5 4.7 4.5
GJ 564 DI K 0.6′′ 720 s 5.5 4.7 4.5
′′
HIP 104214 SDI CH4 0.3 500 s 4.5 2.5 2.2
′′
HD 282411 PDI H 0.3 ?? s - 4.6 4.1
GJ 564 ADI+DI H 0.6′′ 360 s 5.5 4.7 4.5
′′
GJ 564 ADI+DI K 0.6 780 s 5.5 4.7 4.5
HR 8799 ADI+DI H No 525 s - 5.3 5.2
The PSF image was visually monitored, and any tip/tilt error was corrected with a pixel accuracy during the
exposures.
We follow standard data reduction processes such as flat fielding, bad/hot pixel correction, cosmic ray rejec-
tion, and distortion correction after the pattern subtraction process described in section 2.1. A different recipe
is then employed to remove the speckle pattern for each observing mode as each observing mode has a different
feature in the speckle pattern. The distortion is corrected using the distortion correction function described in
3.2 for the DI and ADI mode, while the distortion correction function derived using a grid pinhole pattern placed
on the focal plane of AO188 (i.e., where occulting mask is placed) is used for the PDI and SDI mode.
For consistent contrast measurement, we use the same method to create contrast curves. (1) First, the image
with the speckle pattern removed goes through a smoothing filter with an aperture whose size is roughly same as
a PSF core of the filter used (e.g., 5×5 pixels in the H-band). (2) Then the image is divided into octant regions
centered on the object position. (3) A standard deviation of the pixel counts is calculated within a circular ring
with 5 pixel width in each octant region along radial distance from the object. (4) The standard deviations are
multiplied by 5 to account for a detection with S/N = 5. (5) Finally, the 5 σ deviations are either converted to
surface brightness relative to the total magnitude of the central star (in case of the PDI mode) or divided by the
peak count of the object PSF obtained without the occulting mask (in other observing modes).
4.1 DI MODE
We have observed GJ 564 with the H and K-band in the DI mode. The target is known to host a binary brown
dwarf at 2.6′′ separation. The total exposure time is 160 s and 720 s in the H and K-band, respectively. The
occulting mask with 0.6′′ diameter was used for better observation efficiency. As the simplest way to subtract
the PSF with the speckle pattern, we rotate the image by 180 degree and subtract it from the original one. The
resulting image and the contrast curves are shown in Figure 6 and Figure 7. The contrast is 10−3.54 at r = 0.4′′ ,
10−4.78 at r = 1.0′′ , 10−5.43 at r = 1.5′′ , 10−5.90 at r = 2.0′′ , and 10−6.08 at r = 2.5′′ in the H-band, and 10−3.94
at r = 0.4′′ , 10−4.74 at r = 1.0′′ , 10−5.37 at r = 1.5′′ , 10−5.48 at r = 2.0′′ , and 10−5.48 at r = 2.5′′ in the K-band.
The contrast is limited by the speckle noise in r < 2.0′′ and by the readout noise in the outer area. This method
is obviously too simple to achieve high contrast especially in the speckle-dominated inner region. However, it
could be still useful in certain cases, for example, when the main interest lies in an outer region and the target
cannot provide enough field rotation for the ADI mode.
4.2 PDI MODE
We have observed HD 282411, which is a nearby non-polarized star with H = 4.6, in the H-band for the contrast
measurement in the PDI mode. The stable and excellent seeing condition enables us to use the occulting mask
with 0.3′′ diameter. The data with the total exposure time of ?? s is obtained at each of four position angles (0,
22.5, 45, and 67.5 degree) of the half wave plate. Two 10′′ × 20′′ images (we call “channel images”) extracted
from a PDI frame are processed in the standard way. The distortion correction and image registration between
the two channel images uses the pinhole grid data. Then two sets of Stokes Q and U images, i.e., +Q, −Q,Figure 6. Images of fully reduced data for GJ 564 in the DI mode (H-band (left) and K-band (left)). Image size is
5′′ × 5′′ .
GJ 564 (H=4.7), H-band, 0.6" mask, 160 sec GJ 564 (K=4.5), K-band, 0.6" mask, 720 sec
-2 -2
10 10
10-3 10-3
5σ Contrast
5σ Contrast
10-4 10-4
10-5 10-5
10-6 10-6
10-7 10-7
0 0.5 1 1.5 2 2.5 0 0.5 1 1.5 2 2.5
Radius (arcsec) Radius (arcsec)
Figure 7. Contrast curve for GJ 564 in the DI mode (H-band (left) and K-band (right)). Thin dotted curves represent
the result in each octant region, while the thick solid curve is their average. A vertical dashed line shows the size of the
occulting mask.
+U , and −U , are created by subtracting p the two channel images for 0, 45, 22.5 and 67.5 degree, respectively.
Finally, P I image is produced as P I = Q2 + U 2 where Q = ((+Q) − (−Q))/2 and U = ((+U ) − (−U ))/2. The
resulting P I image and relative surface brightness to the total magnitude of the central star corresponding to 5
σ detection limit are shown in Figure 8. The relative surface brightness is 8.7 mag/arcsec2 at r = 0.2′′ , 9.0 at
R = 0.4′′ , 11.4 at r = 1.0′′ , 12.2 at r = 1.5′′ , 12.5 at r = 2.0′′ , and 12.5 at r = 2.5′′ . The readout noise becomes
a dominant noise source at r > 2.0′′ . It is noted that there is no systematic pattern even near the edge of the
occulting mask in the P I image, indicating that polarization can be measured as close to as 0.15′′ from the star.
4.3 SDI MODE
We have observed HIP 104214 for the contrast performance evaluation in the SDI mode. The occulting mask
with 0.3” diameter was used because the atmospheric condition and the seeing in the night were stable and
excellent. With a set of methane narrowband filters centered on λ = 1.575, 1.600, 1.625, 1.644 µm, we obtained
the SDI images with total exposure time of 500 s.
After the standard image process described above, four 5′′ × 5′′ images in a SDI frame are extracted as an
independent image (we call four images “channel images”). Distortion correction is applied separately to eachHD 282411 (H=4.6), H-band, 0.3" mask, 300 sec
5σ Relative surface brightness
6
8
(mag/arcsec2)
10
12
14
16
0 0.5 1 1.5 2
Radius (arcsec)
Figure 8. Contrast performance in the PDI mode. Left: P I image of HD 282411. Image size is 5′′ × 5′′ . Right: Surface
brightness curve corresponding to 5 σ detection limit. Definition of the lines is same as Figure 7.
channel image as the distortion pattern is different among the channels. Speckle subtraction in the SDI mode
requires special consideration because (1) the speckle pattern around the primary star is different from channel
to channel due to a scaling effect by the wavelength, and (2) scaling in intensity is also necessary as each image
is taken with a different filter. A linear transformation (shift, rotation, and scale) is considered in matching the
speckle patterns between the channel images. The best parameters in the linear transformation are determined
from a range of parameter spaces such that sum of the squared subtraction residuals is minimized.
Figure 9 shows the SDI image with speckle pattern subtracted and the contrast curves for HIP 104214.
Subtraction of the two channel images with λ = 1.600 and λ = 1.575 is shown as an example, however, we
confirm that the results with different wavelength combinations agree within a factor of 2. The contrast is
10−3.52 at r = 0.2′′ , 10−4.04 at r = 0.4′′ , 10−4.90 at r = 1.0′′ , 10−5.00 at r = 1.5′′ , 10−5.05 at r = 2.0′′ . Although
the sensitivity of the SDI mode is quite low due to the narrowband filters, it is still the most powerful observing
mode to find self-luminous gaseous planets with the spectroscopic feature, and more importantly, the SDI mode
HIP 104214 (H=2.5), CH4, 0.3" mask, 500 sec
10-2
10-3
5σ Contrast
10-4
10-5
10-6
10-7
0 0.5 1 1.5 2
Radius (arcsec)
Figure 9. Contrast performance in the SDI mode. The result of λ = 1.600 − λ = 1.575 is shown as an example. Left: High
contrast image of HIP 104214. Image size is 4′′ × 4′′ . Right: Contrast curve. Definition of the lines is same as Figure 7.Figure 10. Left: Fully reduced K-band image of GJ 564 in the ADI mode. Image size is 5′′ × 5′′ . Right: Signal-to-noise
map of the H-band image of HR 8799 in the ADI mode. Image size is 5′′ × 5′′ . Three objects labeled a,b,c are planets
discovered by Marois et al. (2008).7
Figure 11. Contrast curve for GJ 564 in the ADI mode (H-band (left) and K-band (right)). Definition of the lines is
same as Figure 7.
can explore the most inner region than the other observing modes due to less chromatic effect on the speckle
pattern.
4.4 ADI MODE
We have observed GJ 564 and HR 8799 for the contrast evaluation in the ADI mode. GJ 564 was observed in
the H and K-band with 0.6′′ occulting mask, while HR 8799 was observed in the H-band without the occulting
mask. The exposure time is 360 s and 720 s in the H and K-band, respectively for GJ 564, and 525 s for HR
8799. The data are reduced using a custom set of IDL routines that implement the ”LOCI” algorithm (Locally
Optimized Combination of Images, Lafrenière et al. 20076 ). As a very conservative form of high-pass spatial
filtering, a radial profile is subtracted from each frame. The LOCI code then divides each frame into annuli and
segments, and a localized background was subtracted for each frame. Each segment background is computed
from all other frames in the sequence by applying an optimization process that minimizes the image residuals.
Finally, the resulting frames are de-rotated to position angle zero and co-added to produce the high-contrast
output image.
Figure 10 shows a fully reduced K-band image of GJ 564. The contrast performance curves for the GJ 564
in the H and K-band are presented in Figure 11. We note that the contrast curve is divided by the ”partialTable 2. Performance summary of HiCIAO
Detector gain 1.60 e− /ADU
Readout noise 15 e−
Dark current 0.046 e− /s
Strehl ratio 0.4(H), 0.7(K)
Distortion See Figure 5
Distortion correction 7 milli-arcsec (rms) in 20′′ × 20′′
Pixel scale 9.406 ± 0.004 milli-arcsec/pix
Throughput 0.09 (J), 0.11 (H), 0.16 (K)
Background brightness 15.4 (J), 13.2 (H), 10.1 (H) mag/arcsec2
Limiting magnitude 24.05 (J), 23.69 (H), 22.17 (K) mag
subtraction factor”, a separation-dependent parameter between 0 and 1 describing the percentage of planet flux
that survives the LOCI subtraction, which is calculated by inserting test companions into the raw data and
processing it through the LOCI pipeline. The measured contrast is 10− at r = 0.4′′ , 10− at r = 1.0′′ , 10− at
r = 1.5′′ , 10− at r = 2.0′′ , and 10− at r = 2.5′′ in the H-band, and 10− at r = 0.4′′ , 10− at r = 1.0′′ , 10−
at r = 1.5′′ , 10− at r = 2.0′′ , and 10− at r = 2.5′′ in the K-band. Figure 10 also shows a detection of three
planets around HR 8799 discovered by Marois et al. (2008).7 This is a good demonstration of AO188+HiCIAO’s
capability as only 9 minutes exposure made a clear detection of the planet companions.
Although the target position on the sky comes into a consideration to take a full advantage of field rotation,
the ADI mode is the most powerful observing mode in searching the planet over the wide field coverage without
assuming planet property. Another benefit is that the ADI mode can be combined with other observing modes
to possibly enhance the contrast performance.
5. SUMMARY
We describe imaging performance, detector performance, and coronagraph performance of the HiCIAO instru-
ment based on the data obtained in the laboratory and during the commissioning observations. HiCIAO is the
high contrast instrument designed to work with the 188 element adaptive optics for the Subaru Telescope. Hi-
CIAO utilizes the adaptive optics, coronagraph, and differential imaging techniques to achieve the high contrast
imaging observation near the bright stars for the extrasolar planet search and detailed disk sciences.
The imaging performances are mostly consistent with the design and satisfactory for our purpose. The
highlights of the imaging performances are summarized as follows. (1) The Strehl ratio of 0.4 and 0.7 in the H
and K-band is obtained with R ∼ 5 star under 0.5′′ seeing condition in the H-band. (2) The distortion pattern
is correctable to 7 milli-arcsec accuracy which is limited by measurement accuracy of the PSF centroid. (3) The
background brightness is consistent with the average sky brightness at Mauna Kea in the J and H-band, but
the K-band (10.1 mag/arcsec2 ) is brighter due to the warm optics in AO188 and HiCIAO.
The detector performance is characterized by 1.60 e− /ADU detector gain, 15 e− readout noise, 0.046 e− /s
dark current, and some patterns on the raw image. The readout noise becomes as low as 5 e− using the multiple
readout method. The pattern appearing on the raw image can be removed almost completely using two methods
depending on the situation.
Finally, we present the contrast performance for each observing mode. Due to a limited number of data
obtained during the commissioning period, the results shown here should be considered as an example of the
performance that the instrument can achieve. We demonstrate that (1) the PDI mode and SDI mode can explore
the inner region of the object PSF to 0.15′′ and (2) the ADI mode is effective enough to detect the planets around
HR 8799 with exposure time less than 10 minutes. Future observations will provide fairer representation of the
contrast performance under different conditions such as atmospheric conditions, target brightness, occulting
mask size.ACKNOWLEDGMENTS
We are grateful to the HiCIAO Science working group member and reviewers in the early phase of the instrument
development, especially, M. Fukagawa, M. Hayashi, J. Kasdin , J. Krist, H. Kataza, M. Kuchner, M. Liu, T.
S. Pyo, B. Sato, A. Sivaramakrishnan, E. Turner, M. Ueno, T. Yamamoto for their contributions in the CDR
and PDR. We are grateful to the previous coronagraph (CIAO) development and operation teams, especially,
N. Kaifu, M. Ishii, N. Ebizuka, S. S. Hayashi, K. Murakawa, Y. Itoh, and N. Takato. We also thank the Subaru
telescope team for their telescope/instrument supports. This instrument development was supported by the
MEXT Grant-in-Aid for Scientific Research on Priority Areas, ”Development of Extra-Solar Planetary Science”.
The strategic observations with this instrument are supported by the MEXT Grant-in-Aid for Specially Promoted
Research. M.T. acknowledges support from The Mitsubishi Foundation.
REFERENCES
[1] Hayano, Y., Takami, H., Oya, S., Hattori, M., Saito, Y., Watanabe, M., Guyon, O., Minowa, Y., Egner,
S. E., Ito, M., Garrel, V., Colley, S., Golota, T. I., and Iye, M., “Commissioning status of Subaru laser guide
star adaptive optics system,” Proc. SPIE 7736 (2010).
[2] Hodapp, K. W., Tamura, M., Suzuki, R., Jacobson, S., Stahlberger, V., Yamada, H., Takami, H., Guyon, O.,
and Abe, L., “Design of the HiCIAO instrument for the Subaru Telescope,” Proc. SPIE 6269, 123 (2006).
[3] Hodapp, K. W., Suzuki, R., Tamura, M., Abe, L., Suto, H., Kandori, R., Morino, J., Nishimura, T., Takami,
H., Guyon, O., Jacobson, S., Stahlberger, V., Yamada, H., Shelton, R., Hashimoto, J., Tavrov, A., Nishikawa,
J., Ukita, N., Izumiura, H., Hayashi, M., Nakajima, T., Yamada, T., and Usuda, T., “HiCIAO: the Subaru
Telescope’s new high-contrast coronographic imager for adaptive optics,” Proc. SPIE 7014, 42 (2008).
[4] Tamura, M., Hodapp, K. W., Takami, H., Abe, L., Suto, H., Guyon, O., Jacobson, S., Kandori, R., Morino,
J., Murakami, N., Stahlberger, V., Suzuki, R., Tavrov, A., Yamada, H., Nishikawa, J., Ukita, N., Hashimoto,
J., Izumiura, H., Hayashi, M., Nakajima, T., and Nishimura, T., “Concept and science of HiCIAO: high
contrast instrument for the Subaru next generation adaptive optics,” Proc. SPIE 6269, 28 (2006).
[5] Bertin, E. and Arnouts, S., “SExtractor: Software for source extraction,” A&AS 117, 393 (1996).
[6] Lafrenière, D., Marois, C., Doyon, R., Nadeau, D., and Artigau, E., “A New Algorithm for Point-Spread Func-
tion Subtraction in High-Contrast Imaging: A Demonstration with Angular Differential Imaging,” ApJ 660,
770 (2007).
[7] Marois, C., Macintosh, B., Barman, T., Zuckerman, B., Song, I., Patience, J., Lafrenière, D., and Doyon, R.,
“Direct Imaging of Multiple Planets Orbiting the Star HR 8799,” Science 322, 1348 (2008).You can also read


