Performance Evaluation of Solar-Blind Gas-Filled Sensors to Detect Electrical Discharges for Low-Pressure Aircraft Applications
←
→
Page content transcription
If your browser does not render page correctly, please read the page content below
sensors
Article
Performance Evaluation of Solar-Blind Gas-Filled Sensors
to Detect Electrical Discharges for Low-Pressure
Aircraft Applications
Jordi-Roger Riba * , Manuel Moreno-Eguilaz                         , Maxence Boizieau and Tamerlan Ibrayemov

                                          Campus Terrassa, Universitat Politècnica de Catalunya, Rambla Sant Nebridi 22, 08222 Terrassa, Spain;
                                          manuel.moreno.eguilaz@upc.edu (M.M.-E.); maxence.boizieau@reseau.eseo.fr (M.B.);
                                          ibrayemov.tamerlan@gmail.com (T.I.)
                                          * Correspondence: jordi.riba-ruiz@upc.edu; Tel.: +34-937398365

                                          Abstract: Unpressurized aircraft circuits facilitate the initiation of electrical discharges in wiring
                                          systems, with consequent damage to related insulation materials and safety hazards, that can and
                                          have already caused severe incidents and accidents. Specific sensors and solutions must be developed
                                          to detect these types of faults at a very incipient stage, before further damage occurs. Electrical
                                          discharges in air generate the corona effect, which is characterized by emissions of bluish light, which
                                          are found in the ultraviolet (UV) and visible spectra. However, due to sunlight interference, the
                                          corona effect is very difficult to detect at the very initial stage, so the use of solar-blind sensors can
                                          be a possible solution. This work analyzes the feasibility of using inexpensive non-invasive solar-
                                          blind sensors in a range of pressures compatible with aircraft environments to detect the electrical
                                          discharges at a very incipient stage. Their behavior and sensitivity compared with other alternatives,
                                          i.e., an antenna sensor and a CMOS imaging sensor, is also assessed. Experimental results presented

                                   in this paper show that the analyzed solar-blind sensors can be applied for the on-line detection of
Citation: Riba, J.-R.; Moreno-Eguilaz,    electrical discharges in unpressurized aircraft environments at the very initial stage, thus facilitating
M.; Boizieau, M.; Ibrayemov, T.           and enabling the application of predictive maintenance strategies. They also offer the possibility
Performance Evaluation of                 to be combined with existing electrical protections to expand their capabilities and improve their
Solar-Blind Gas-Filled Sensors to         sensitivity to detect very early discharges, thus allowing the timely identification of their occurrence.
Detect Electrical Discharges for
Low-Pressure Aircraft Applications.       Keywords: aircraft power systems; low pressure; solar-blind sensors; ultraviolet radiation
Sensors 2022, 22, 492. https://
doi.org/10.3390/s22020492

Academic Editor: Amir H. Alavi
                                          1. Introduction
Received: 15 December 2021
Accepted: 8 January 2022
                                               Due to the relentless development of a wide range of sensors and low-cost commu-
Published: 10 January 2022
                                          nication systems compatible with IoT applications, there is a growing effort to develop
                                          automated acquisition systems for detecting electrical discharges in power systems. In
Publisher’s Note: MDPI stays neutral
                                          particular, aircraft power systems are more prone to electrical discharges due to the harsh
with regard to jurisdictional claims in
                                          environments and low-pressure conditions at which they are exposed. Recent and future
published maps and institutional affil-
                                          developments in the area of more electric aircrafts (MEA) and all electric aircrafts (AEA)
iations.
                                          highlight the need to increase distribution voltage levels beyond 1 kV, to limit the current
                                          requirements and the weight of distribution wiring systems. However, operation at higher
                                          voltage levels exposes aircraft distribution systems to new challenges, such as an increased
Copyright: © 2022 by the authors.
                                          risk of electrical discharge occurrence, which is accentuated by the harsh aircraft envi-
Licensee MDPI, Basel, Switzerland.        ronmental conditions, and specifically the low pressure, which significantly reduces the
This article is an open access article    dielectric strength of air [1–3]. According to the well-known Paschen’s law, when reducing
distributed under the terms and           the ambient pressure, electrical discharges are triggered at lower voltage levels [4,5], thus
conditions of the Creative Commons        increasing the risk of partial discharges, arcing and electric breakdown [6].
Attribution (CC BY) license (https://          Flight altitudes of current commercial airliners lie in the 33,000–42,000 feet (10,000–12,800 m)
creativecommons.org/licenses/by/          range, and military aircrafts can fly above 50,000 feet (15,200 m), which approximately
4.0/).                                    corresponds to 10 kPa. Therefore, electric and electronic systems placed in unpressurized

Sensors 2022, 22, 492. https://doi.org/10.3390/s22020492                                                      https://www.mdpi.com/journal/sensors
Sensors 2022, 22, 492 2 of 10
areas of aircrafts have to withstand a wide pressure interval [7], which can range from
100 kPa (sea level) to around 10 kPa (worst condition).
Electrical discharges in aircraft electrical systems must be avoided, since their effects
can lead to severe consequences, while tending to spread through electrical wires, pro-
ducing a fire hazard [8,9], shutting down the affected systems with the consequent loss
of functionality. Current jetliners can include hundreds of km of electrical wires, so fault
detection is an issue, because wiring faults cause many in-flight fires, mission aborts [10,11],
emergency aircraft landings and aborted takeoffs [12]. The aviation industry is continually
developing and improving condition monitoring systems, although, even today, wiring
issues frequently remain hidden. There is a pressing need to detect and assess the severity
of insulation failures in existing aircraft wiring systems, as it is crucial to ensure stable,
reliable and safe power system operation. However, the detection of arc tracking activity
(the formation of a conducting path along the surface of cable insulation due to chemical
and thermal decomposition or erosion of the insulation material) in the very early stage is
an unsolved problem. Because of the low fault current produced, it is below the sensitivity
of current circuit breakers, so they are only able to trip when the problem is in an advanced
stage, and a certain level of damage has been produced. Arc tracking activity releases
energy and generates different measurable effects [13], including radio waves, sound,
visible and ultraviolet light, heat or chemicals such as ozone, NOx and nitric acid, among
others [14]. Arc tracking activity tends to pyrolyze the insulation materials surrounding the
core of the wire, thus producing a partially conductive path that promotes discontinuous
arcing activity of low magnitude that overheats the insulation [15], thus producing more
damage. Therefore, the low energy level associated with arc tracking activity in the very
early stage makes its detection difficult [16].
Arc tracking often produces arcing in small air gaps, which in turn generates corona
activity in the most stressed region [17,18]. Corona is typically detected by means of com-
plex devices including UHF sensors [19], radio interference voltage and partial discharge
detectors [20], spectrophotometers [21] or noise meters [22], among others. Corona activity
can also be detected using visible and ultraviolet (UV) optical sensors [23], so these sensing
methods offer the possibility to detect electrical discharges in the incipient state [2] using
reduced-size and low-cost sensors. Visible/UV imaging can detect visible and UV emis-
sions produced during the electrical discharge process, while allowing the determination
of the discharge points [24]. However, sunlight also contains visible and UV wavelengths,
thus interfering with the measurements of visible and UV sensors.
Solar radiation is mostly optical radiation, i.e., radiant energy emitted within a broad
interval of the electromagnetic spectrum. It includes ultraviolet (UV), visible light and
infrared radiation, although both ionizing radiation of shorter wavelength and microwaves
and radiofrequency with longer wavelengths are also present. UV radiation falls in the
100–400 nm range, and it can be subdivided into UVC (100–280 nm), UVB (280–315 nm)
and UVA (315–400 nm). UVC and most UVB extraterrestrial radiation is absorbed by
stratospheric ozone. Optical sensors that are only sensitive to UVC radiation, i.e., sensitive
below the 280 nm interval, are known as solar-blind sensors [25], because they can only
detect electromagnetic radiation with wavelengths shorter than those of the solar radiation
once it has penetrated the atmosphere of the Earth. Therefore, solar-blind sensors do not
produce any measurable signal when exposed to ordinary outdoor lighting. However, the
concept of solar blindness in space changes, because of the lack of an atmosphere between
the Sun and the sensor [26].
Solar-blind sensors emerge as a plausible alternative to avoid sunlight interference, so
this possibility is analyzed in this paper. To this end, laboratory experiments comparing
the sensitivity of solar-blind UV sensors against the sensitivity of an antenna sensor and a
visible/UV CMOS imaging sensor are conducted at a wide range of pressures covering
most aircraft applications, this being a contribution of this work. Results presented here
also show the key role of pressure in the corona extinction voltage of a wire electrode, thus
providing valuable experimental data for designing wiring insulation systems for electricalSensors 2022, 22, 492 3 of 10
circuits found in MEA and AEA aircrafts. These applications require extensive testing for
the accurate prediction of the corona extinction voltage under low-pressure conditions. The
sensing approach proposed in this work seeks to identify discharge activity in the very
initial stage, well before the development of major faults.
The paper is organized as follows. Section 2 describes the experimental setup and
the electrodes and sensors used to detect the electrical discharges in the very early stage.
Section 3 presents and comments on the experimental results, and, finally, Section 4 con-
cludes the paper.
2. Experimental Setup
This section describes the experimental setup, including the electrodes and appara-
tus used to generate the electrical discharges, the low-pressure chamber where the tests
were carried out, as well as the sensors to detect the UV light at the very initial stage of
the discharge.
2.1. The Analyzed Sensors
The UVTRON is a binary (on/off) sensor sensitive to ultraviolet. It exhibits a fast
and very narrow spectral response in the 185–260 nm interval, thus being solar-blind
and insensitive to visible light. Since electrical discharges typically emit ultraviolet light,
this sensor is well suited to their detection. Its response is based on the photoelectric
effect. When an ultraviolet photon of adequate wavelength strikes the nickel electrode
(photocathode or negative electrode), an electron is released. The UVTRON consists of
a gas-filled tube, where an electron avalanche multiplication phenomenon takes place
between two metallic electrodes, the photo-cathode and the anode. The two electrodes are
subjected to a high-voltage difference to sustain the avalanche. The avalanche is initiated or
triggered when incident UV photons strike the photo-cathode and liberate electrons, known
as photo-electrons. Due to the high voltage applied between the two electrodes and the
original photo-electrons liberated inside the gas-filled tube by the incident UV photons, a
gas multiplication or electron avalanche occurs, in which each subsequent collision liberates
a new electron, with the consequent multiplicative effect, thus sustaining the avalanche.
Sensors 2022, 22, x FOR PEER REVIEW 4 of 11
These free electrons accelerate towards the anode, guided by the strong electric field,
colliding with gas molecules, ionizing such molecules and producing more electrons that
are accelerated by the electric field. They collide with other gas molecules, thus producing
more ionization
Operationand generating more electrons.
temperature −40This gas°C
to 125 multiplication process
−40 tois125
repeated
°C
until the electrons finally reach the anode. This type of electrical discharge is also known as
Weight 1.5 g 2.5 g
Townsend discharge. Figure 1 details the structure of the sensor and the avalanche process.
UV photon
Electric current
due to the
Photo-cathode discharge
_ Ni
liberated
photo-electron
Gas-filled tube High-voltage
Electron avalanche
Gas multiplication
Anode
Resistance to limit
UV transmitting glass the current
Figure1.1.Schematics
Figure Schematicsof of a gas-filled
a gas-filled tubetube to multiply
to multiply the liberated
the liberated photo-electrons
photo-electrons by the UV
by the incident incident
UV photons
photons anddriver
and the the driver
circuit.circuit.
To maximize the performance of each sensor, a suitable driver circuit is required. To
this end, the commercial C10807 and C10423 driver circuits were used jointly with the
R9454 and R9533 sensors, respectively, since they can be supplied at a low voltage in the
12–24 V range, while integrating a high-voltage dc/dc converter and a signal processingSensors 2022, 22, 492 4 of 10
Table 1 summarizes the main characteristics of the Hamamatsu gas-filled tube solar-
blind sensors analyzed in this paper.
Table 1. Hamamatsu UVTRON sensors analyzed in this work.
Parameters R9454 R9533
Manufacturer Hamamatsu Hamamatsu
UV range 185–260 nm 185–260 nm
DC supply voltage 400 ± 25 V 350 ± 25 V
Peak senssitivity 200 nm 200 nm
Sensitivity range > 10% 185–230 nm 185–230 nm
Maximum peak current 30 mA 30 mA
Estimated life 25,000 h 25,000 h
Operation temperature −40 to 125 ◦ C −40 to 125 ◦ C
Weight 1.5 g 2.5 g
To maximize the performance of each sensor, a suitable driver circuit is required. To
this end, the commercial C10807 and C10423 driver circuits were used jointly with the
R9454 and R9533 sensors, respectively, since they can be supplied at a low voltage in the
12–24 V range, while integrating a high-voltage dc/dc converter and a signal processing
circuit. Thus, the sensors can be operated by applying a low voltage through the drivers,
while the signal processing circuit allows for a reduction in background noise.
To assess the performance of the UVTRON sensors, their sensitivity was compared
against that of two other sensors, such as a low-cost back-illuminated CMOS imaging
sensor and a loop antenna, which have been tested in previous works [24].
The first corona detection method detects the visual corona using an imaging sensor
(48 Mp IMX586 CMOS sensor from Sony, Tokyo, Japan) sensitive to both visible and UV
wavelengths [27]. However, this sensor is not solar-blind and only partially sensitive to the
UV spectrum, although, due to the images generated, it allows the corona discharge points
to be localized.
The second sensor is a single-loop antenna (diameter = 95 mm, made of enameled
copper wire with diameter = 1.2 mm, approximate cutting frequency of 20 MHz). This
sensor presents several advantages, such as low cost, light weight, reduced dimensions
and very high sensitivity. Due to its superior sensitivity, this is the reference sensor in
this paper, although it cannot be used in aerospace applications due to the great impact of
electromagnetic noise typical of such applications on its response. The signal provided by
the antenna sensor was acquired by using an isolated digital oscilloscope (RTH1004, Rohde
& Schwarz, Munich, Germany, 5 GSa/s, 0–1000 V), which was connected to two passive
voltage probes (RT-ZI10, Rohde & Schwarz, Munich, Germany, 1 kV, 500 MHz, 10:1).
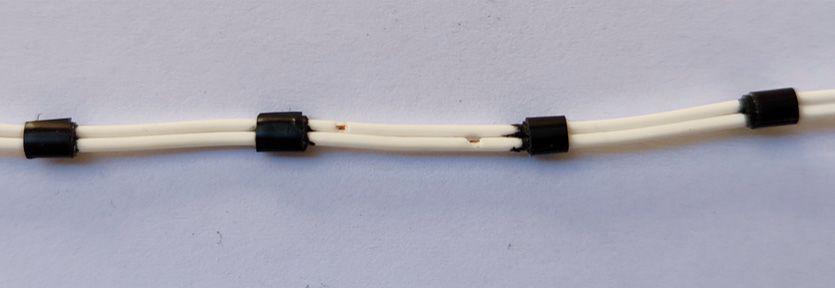
2.2. The Wire Electrodes
This section describes the wire electrodes used to assess the sensitivity of the sensors
analyzed in this work. Wire electrodes were analyzed since arc tracking frequently occurs
between adjacent wires in aircraft circuits, this being a relevant electrode geometry to
generate early-stage discharges. Moreover, standard methods to assess the resistance to arc
tracking in wire electrodes are well described in the technical literature [28,29]. To facilitate
corona activity, the core of one of the conductors was connected to the high-voltage terminal
of the high-voltage generator, whereas the other was connected to the ground.
The wire electrodes were configured and artificially damaged according to the descrip-
tion found in the EN 3475-603:2018 standard [28], as shown in Figure 2.Sensors 2022, 22, x FOR PEER REVIEW 5 of 11
Sensors 2022, 22, 492 The wire electrodes were configured and artificially damaged according 5 of to
10 the de
scription found in the EN 3475-603:2018 standard [28], as shown in Figure 2.
Notch 1
Lacing tape Notch 2 PTFE insulation
Figure 2. Polytetrafluoroethylene (PTFE)-insulated wire electrodes used to test the different sensors.
Figure 2. Polytetrafluoroethylene (PTFE)-insulated wire electrodes used to test the different sensors
The width of the notches is 1 mm and the distance between notches is 10 mm.
The width of the notches is 1 mm and the distance between notches is 10 mm.
Table 2 summarizes the properties of the analyzed PTFE-insulated wires.
Table 2 summarizes the properties of the analyzed PTFE-insulated wires.
Table 2. Properties of the analyzed PTFE-insulated wires.
Table 2. Properties of the analyzed PTFE-insulated wires.
Properties Values/Description
Properties
Manufacturer Values/Description
AlphaWire
Manufacturer
Size AWG 24 AlphaWire
(7/32)
Applicable standards AWM/STYLE 1213; MIL-W-16878/4 (Type E)
Size AWG 24 (7/32)
Insulation material PTFE
Applicable standards
Outer diameter AWM/STYLE 1213;
1.12 mmMIL-W-16878/4 (Type E)
Insulation material
Insulation thickness 0.25 mmPTFE
Temperature range −60 to 200 ◦ C
Outer diameter 1.12 mm
Voltage rating 600 VRMS
Insulation thickness 0.25 mm
Temperature
2.3. The Low-Pressure range
Chamber −60 to 200 °C
Voltagethe
As explained, rating 600inVRMS
pressure range in aircraft applications lies the 10–100 kPa range.
Therefore, experiments to simulate the behavior of the electrical discharges under these
2.3. The Low-Pressure
constraints Chamber
must be performed inside a low-pressure chamber. A cylindrical stainless-steel
low-pressure chamberthe
As explained, was used forrange
pressure this purpose, withapplications
in aircraft an inner diameter
lies inofthe
26010–100
mm andkPaa range
height of 375 mm. It included a methacrylate lid sealed with an elastic gasket
Therefore, experiments to simulate the behavior of the electrical discharges under these to prevent
the entry of air from the outside, thus allowing the wireless CMOS sensor to transmit
constraints must be performed inside a low-pressure chamber. A cylindrical stainless
photographs to an external computer. It also contained a vacuum-tight access port for the
steel low-pressure
high-voltage cable andchamber
anotherwas used
one for thefor thissupplying
wires purpose,thewith an innergas-filled
solar-blind diametertube
of 260 mm
and a height of 375 mm. It included a methacrylate lid sealed with
sensors. A vacuum pump was used to regulate the pressure, while it was measured by an elastic gasket to
prevent
means ofthe entry of manometer.
an analogic air from theExperimental
outside, thusmeasurements
allowing the wireless CMOS at
were performed ◦
sensor
25 Cto trans
mit humidity
and photographs to an external
was limited computer. It also contained a vacuum-tight access port for
below 25%.
During the tests,
the high-voltage the methacrylate
cable and anotherlid onewas
forcovered withsupplying
the wires an opaque material to prevent
the solar-blind gas-filled
sunlight from entering and interfering with the CMOS imaging sensor measurements.
tube sensors. A vacuum pump was used to regulate the pressure, while it was measured
by means of an analogic manometer. Experimental measurements were performed at 25
2.4. The Programmable High-Voltage Source
°C and humidity was limited below 25%.
Since the corona extinction voltage (CEV) value depends on the applied pressure, and
During the tests, the methacrylate lid was covered with an opaque material to pre-
the tests were performed under variable pressure conditions, a power supply capable of
vent sunlight
generating from high-voltage
a variable entering andoutput
interfering with the
was required. To CMOS
this end,imaging sensor
a low-voltage measure-
pro-
ments.
grammable power supply (0–300 V, ±0.1 V, SP300VAC600W, APM Technologies, Dongguan,
China) was connected to a single-phase step-up high-voltage transformer (36 kV, VKPE-36,
2.4. The Programmable
Laboratorio High-Voltage
Electrotécnico, Barcelona, Source
Spain), whereas the output frequency of the power
supply was settled to 400 Hz, which is the typical frequency in aircraft applications. The
Since the corona extinction voltage (CEV) value depends on the applied pressure
voltage was regulated to determine the CEV value at each pressure.
and the tests were performed under variable pressure conditions, a power supply capable
Figure 3a details the experimental setup used in this paper to determine the CEV
of generating a variable
values of the wire high-voltage
electrodes output
under varying wasconditions.
pressure required. To this end, a low-voltage pro
grammable power supply (0–300 V, ±0.1 V, SP300VAC600W, APM Technologies
Dongguan, China) was connected to a single-phase step-up high-voltage transformer (36kV, VKPE-36, Laboratorio Electrotécnico, Barcelona, Spain), whereas the output fre-
quency of the power supply was settled to 400 Hz, which is the typical frequency in air-
craft applications. The voltage was regulated to determine the CEV value at each pressure.
Sensors 2022, 22, 492 6 of 10
Figure 3a details the experimental setup used in this paper to determine the CEV
values of the wire electrodes under varying pressure conditions.
Oscilloscope
Manometer
Loop
antenna
High-voltage
Step-up high-voltage input
transformer
400 Hz
CMOS sensor
Variable frequency and Wire electrodes
amplitude power supply
Solar blind UV
sensor
to driver circuit Low-pressure chamber
(a)
(b)
Figure
Figure3.
3. (a)
(a)Experimental
Experimentalsetup
setupsketch
sketch including
includingthe
the used
used instrumentation.
instrumentation. The
Thedistance
distancebetween
between
the gas-filled sensors and the wire electrode is approximately 50 mm, whereas the distance between
the gas-filled sensors and the wire electrode is approximately 50 mm, whereas the distance between
the CMOS image sensor and the wire is approximately 90 mm; (b) photograph of an early-stage
the CMOS image sensor and the wire is approximately 90 mm; (b) photograph of an early-stage
discharge at 10 kPa when applying 700 VRMS and 400 Hz, appearing in the surroundings of the notch
discharge at 10 kPa when applying 700 VRMS and 400 Hz, appearing in the surroundings of the
sites.
notch sites.
2.5.
2.5.The
TheCoronaCoronaExtinction
ExtinctionVoltage
Voltage(CEV)
(CEV)Value
Value
The
The data presented in this work are to
data presented in this work are to determine
determine the the lowest
lowest voltage
voltage level
level at
at which
which
corona
corona activity is produced, so the CEV value is used. The corona tests carried in
activity is produced, so the CEV value is used. The corona tests carried out this
out in
work were performed using the electrodes described in Section 2.2.
this work were performed using the electrodes described in Section 2.2. To determine the To determine the CEV
value at eachatpressure
CEV value level, the
each pressure voltage
level, was initially
the voltage set to 0set
was initially kVto and
0 kVprogressively raised
and progressively
until corona activity was detected, this voltage corresponding to the corona
raised until corona activity was detected, this voltage corresponding to the corona inception inception volt-
age (CIV). Then, the voltage was further raised by around 10%
voltage (CIV). Then, the voltage was further raised by around 10% and next progressively and next progressively
reduced
reduceduntil untiltotal
totalextinction
extinctionof ofthe
thecorona
coronaeffect,
effect,the
thelast
lastpoint
pointwhere
wherecorona
coronaactivity
activitycan
can
be
be measured being the CEV value. The CEV value corresponds to the lowest voltage
measured being the CEV value. The CEV value corresponds to the lowest voltage atat
which
which corona
corona activity
activity can
can be
be measured.
measured.
ItIt isis noted
noted that
that UVTRON
UVTRON sensors
sensors produce
produce an an on/off
on/offoutput
outputsignal
signalwhose
whosefrequency
frequency
increases
increases with the discharge level, thus making it possible to quantify the evolutionof
with the discharge level, thus making it possible to quantify the evolution ofthe
the
discharge,
discharge, this information being useful to develop predictive maintenance strategies. The
this information being useful to develop predictive maintenance strategies. The
response
responseof ofthese
thesesensors
sensorscancanbebe combined
combinedwith withexisting
existingelectrical
electricalprotections
protectionsafter
aftersome
some
modifications.
modifications. When When the sensor detects
detects the
the presence
presenceof ofananinitial
initialdischarge,
discharge,ananalarm
alarmsignal
sig-
nal
cancan
be be sent
sent to to
thethe protection,
protection, whichininturn
which turncould
couldsendsendthethe alarm
alarm signal to an an external
external
computer,
computer, which which could
could decide
decide ifif further
further actions
actions are
are required.
The cost of the UVTRON sensor and the driver circuit is around 20 to 50 times less
than that of PD detectors, RIV detectors or UV cameras.Sensors 2022, 22, 492 7 of 10
3. Experimental Results
This section describes the results attained with the different sensors to assess the
sensitivity of the solar-blind UV-sensitive gas-filled sensors. The results presented in this
section are based on the electrodes detailed in Section 2.2, by applying the procedure to
detect the CEV value explained in Section 2.5.
3.1. Initial Experimental Tests with the Solar-Blind Sensors
To determine the suitability of using the UVTRON sensors to detect electrical discharges,
different initial tests were performed under regular atmospheric pressure conditions.
The first test consisted of comparing the behavior of the solar-blind sensors under
sunlight conditions and under total darkness, resulting in the same sensitivity for the
UVTRON sensors under both conditions, thus proving that sunlight does not interfere
their measurements.
The second test consisted of measuring the detection sensitivity of the sensors placed
at a distance of 0.5 m from the discharge point (needle-plane gap in this case). This distance
was selected because it was sufficient for the purpose of this study. The results attained are
sown in Table 3.
Table 3. Detection limit (CEV value) of the UVTRON sensors at a distance of 0.5 m from the
discharge point.
Voltage (kV) Imaging Sensor R9454 R9533
8.0 Detection limit ≈0.1 Hz No detection
8.5 Detection 1.5–1.75 Hz ≈0.1 Hz
9.0 Detection 3.0–3.5 Hz 0.25–0.5 Hz
10.0 Detection 4.0–5.0 Hz ≈1 Hz
The results in Table 3 show very similar detection limits of the UVTRON sensors
compared to that of the CMOS imaging sensor, where, in a previous work [23], it was
shown that the CMOS imaging sensor has almost the same sensitivity as one of the most
sensitive and expensive sensors, a conventional PD (partial discharge) detector.
Sensors 2022, 22, x FOR PEER REVIEW Finally, a third test was carried out for determining the frequency response of the sen-
8 of 11
sors from below the CEV value (they produce a response of 0 Hz) to saturation (maximum
frequency, fmax ). The results attained are shown in Figure 4.
1.0
Normalized output frequency (f/fmax)
0.8
0.6
0.4
0.2
0.0
0.0 0.2 0.4 0.6 0.8 1.0
Normalized voltage (V/Vma x)
Figure4.4.Normalized
Figure Normalizedfrequency response
frequency of the
response UVTRON
of the R9454
UVTRON sensor.
R9454 sensor.
3.2. Experimental Tests with the Wire Electrodes Inside the Low-Pressure Chamber
This section deals with the wire electrodes, which were used to assess the sensitivity
of the sensors analyzed in this work.
Figure 5 summarizes the results obtained in the low-pressure chamber using the an-Normaliz
0.2
Sensors 2022, 22, 492 0.0 8 of 10
0.0 0.2 0.4 0.6 0.8 1.0
Normalized voltage (V/Vma x)
The results in Figure 4 show the dependency of the output frequency of the sensors
Figure 4. Normalized frequency response of the UVTRON R9454 sensor.
with the applied voltage, thus making it possible to quantify the intensity of the discharge,
this information being useful to develop predictive maintenance strategies.
3.2. Experimental Tests with the Wire Electrodes Inside the Low-Pressure Chamber
3.2. Experimental
This sectionTests withwith
deals the Wire
the Electrodes Inside thewhich
wire electrodes, Low-Pressure Chamber
were used to assess the sensitivity
of the sensors
This sectionanalyzed
deals withinthe
this work.
wire electrodes, which were used to assess the sensitivity
of theFigure
sensors5analyzed in thisthe
summarizes work.
results obtained in the low-pressure chamber using the an
Figure 5 summarizes the
tenna, CMOS imaging sensor and theresults obtained in the low-pressure
two solar-blind gas-filledchamber
sensorsusing
withinthethe pres
antenna, CMOS imaging sensor and the two solar-blind gas-filled sensors within the
sure range covering the 10–100 kPa interval in steps of 10 kPa.
pressure range covering the 10–100 kPa interval in steps of 10 kPa.
PTFE sample
2.6
2.4 Imaging sensor
UVTRON R9454
2.2 UVTRON R9533
Antenna
2.0
CEV (kV RM S at 400 Hz)
1.8
1.6
1.4
1.2
1.0
0.8
0.6
0.4
10 20 30 40 50 60 70 80 90 100
Air pressure (kPa)
Figure5.5.Results
Figure Results attained
attained with
with the the different
different sensors
sensors in thein the 10–100
10–100 kPacovering
kPa range range covering the pressure
the pressure
rangefound
range foundinin aeronautic
aeronautic applications
applications usingusing the PTFE-insulated
the PTFE-insulated wire electrodes
wire electrodes depicted indepicted
Figure 2. in Figure
2.
The results presented in Figure 5 clearly show a similar trend for the four analyzed
sensors.
TheA results
close examination
presentedsuggests
in Figurethat, in most cases,
5 clearly show the antennatrend
a similar is the for
mostthesensitive
four analyzed
one, because it detects the very early corona activity at the lowest CEV values, followed by
sensors. A close examination suggests that, in most cases, the antenna is the most sensitive
the UVTRON R9533 sensor, which, under the conditions of the tests, is the second most
one, because
sensitive sensor.it As
detects theexplained,
already very early coronathe
although activity
antennaatisthe
the lowest CEV values,
most sensitive methodfollowed
bydetect
to the UVTRON R9533
the electrical sensor, in
discharges which, under
the very earlythe conditions
stage, of the
this sensing tests, is
method is the second mos
strongly
sensitive sensor. As already explained, although the antenna is the
affected by electromagnetic noise, so it is difficult to apply in real environments. most sensitive method
to detect
For a the electrical
better discharges
interpretation of theinresults
the very early stage,
presented this 5,
in Figure sensing
Table 4method
shows the is strongly
relative differences in the CEV values of the different sensors compared to
affected by electromagnetic noise, so it is difficult to apply in real environments. the antenna, the
most sensitive sensor, which is taken as the reference sensing method.
The results summarized in Table 4 show a great similitude among the CEV values
determined by the different sensors. Compared to the antenna sensor, the most similar
results are attained by the UVTRON R9533, exhibiting a mean difference with respect to the
antenna of 0.79% (minimum and maximum differences of 0.00% and 1.35%, respectively),
followed by the CMOS imaging sensor, with a mean difference of 2.60% (minimum and
maximum differences of 0.00% and 8.15%, respectively).Sensors 2022, 22, 492 9 of 10
Table 4. CEV values percentage difference (%) of the different sensors with respect to the antenna
(most sensitive sensor) using PTFE-insulated wire electrodes.
Pressure (kPa) Imaging Sensor UVTRON R9454 UVTRON R9533
10 0.00 0.00 0.00
20 −8.15 −2.06 −1.14
30 −1.01 −1.01 −1.01
40 −1.28 −1.28 −0.76
50 −1.91 −1.91 −1.25
60 −2.29 −3.40 −0.53
70 −4.02 −5.01 −0.98
80 −1.38 −1.38 −0.91
90 −2.59 −3.93 −0.45
100 −0.84 −6.02 −0.84
Average −2.35 −2.60 −0.79
4. Conclusions
This paper has analyzed the behavior and sensitivity of two solar-blind sensors in the
10–100 kPa pressure interval, which accounts for the pressure range found in unpressurized
aircraft circuits. The analyzed solar-blind sensors are sensitive within the 185–260 nm
ultraviolet spectral range. Their sensitivity has been contrasted with that of an antenna
sensor and a CMOS imaging sensor, since, in previous works, the good performance
of the two last sensors has been proven. A wire electrode has been used to assess the
performance of the different sensors. Wiring systems in aircraft applications tend to
produce discharges, and standard procedures to assess the resistance to arc tracking of wire
insulation materials are found in the technical literature. Experimental results presented
in this work clearly show the feasibility and accuracy of using solar-blind UV sensors to
detect electrical discharges at the very incipient stage in low-pressure environments found
in aircraft applications, well before irreversible damage in wiring systems is produced. The
analyzed sensors have appealing features because they are inexpensive, allow non-invasive
measurements, are suitable for on-line monitoring, are insensitive to sunlight interferences
and have reduced dimensions and low power consumption. The use of these sensors
facilitates the application of predictive maintenance plans while offering the possibility to
be combined with existing electrical protections to expand their capabilities, thus allowing
timely fault identification and a fast response.
Author Contributions: Conceptualization, J.-R.R.; methodology, J.-R.R. and M.M.-E.; validation,
J.-R.R., M.M.-E., M.B. and T.I.; formal analysis, J.-R.R. and M.M.-E.; investigation, M.B. and T.I.;
writing—original draft preparation, J.-R.R.; writing—review and editing, J.-R.R. and M.M.-E. All
authors have read and agreed to the published version of the manuscript.
Funding: This research was partially funded by Ministerio de Ciencia e Innovación de España, grant
number PID2020-114240RB-I00, and by the Generalitat de Catalunya, grant number 2017 SGR 967.
Institutional Review Board Statement: Not applicable.
Informed Consent Statement: Not applicable.
Data Availability Statement: Not applicable.
Acknowledgments: We acknowledge the Shakhmardan Yessenov Science and Education Foundation
for providing a scholarship to coauthor T.I.
Conflicts of Interest: The authors declare no conflict of interest.
References
1. Riba, J.-R.; Gomez-Pau, A.; Moreno-Eguilaz, M. Sensor Comparison for Corona Discharge Detection Under Low Pressure
Conditions. IEEE Sens. J. 2020, 20, 11698–11706. [CrossRef]Sensors 2022, 22, 492 10 of 10
2. Riba, J.-R.; Gómez-Pau, Á.; Moreno-Eguilaz, M. Experimental Study of Visual Corona under Aeronautic Pressure Conditions
Using Low-Cost Imaging Sensors. Sensors 2020, 20, 411. [CrossRef] [PubMed]
3. Kuffel, J.; Zaengl, W.S.; Kuffel, P. High Voltage Engineering Fundamentals, 2nd ed.; Newnes: Oxford, UK, 2000; ISBN 978-0-7506-3634-6.
4. CleanSky. 9th Call for Proposals (CFP09)—List and Full Description of Topics; CleanSky: Brussels, Belgium, 2018; pp. 1–354.
5. Esfahani, A.N.; Shahabi, S.; Stone, G.; Kordi, B. Investigation of Corona Partial Discharge Characteristics Under Variable
Frequency and Air Pressure. In Proceedings of the 2018 IEEE Electrical Insulation Conference (EIC), San Antonio, TX, USA,
17–20 June 2018; pp. 31–34.
6. Capineri, L.; Dainelli, G.; Materassi, M.; Dunn, B.D. Partial discharge testing of solder fillets on PCBs in a partial vacuum: New
experimental results. IEEE Trans. Electron. Packag. Manuf. 2003, 26, 294–304. [CrossRef]
7. Karady, G.G.; Sirkis, M.D.; Li, L. Investigation of corona initiation voltage at reduced pressures. IEEE Trans. Aerosp. Electron. Syst.
1994, 30, 144–150. [CrossRef]
8. Landfried, R.; Savi, L.; Leblanc, T.; Teste, P. Parametric study of electric arcs in aeronautical condition of pressure. EPJ Appl. Phys.
2014, 67, 20802. [CrossRef]
9. Hongkun, Z.; Tao, C.; Wenjun, L. Arc fault signatures detection on aircraft wiring system. In Proceedings of the World Congress
on Intelligent Control and Automation (WCICA), Dalian, China, 21–23 June 2006; Volume 2, pp. 5548–5552.
10. Dornheim, M.A. New rules and hardware for wiring soon to emerge. Aviat. Week Space Technol. 2001, 154, 92.
11. Furse, C.; Safavi, M.; Smith, P.; Lo, C. Feasibility of spread spectrum sensors for location of arcs on live wires. IEEE Sens. J. 2005, 5,
1445–1449. [CrossRef]
12. Lectromec. 2016 Statistical Analysis of EWIS Failures of the US Commercial Aircraft Fleet and How to Improve; Lectromec: Chantilly,
VA, USA, 2017.
13. Yuan, Z.; Ye, Q.; Wang, Y.; Guo, Z. State Recognition of Surface Discharges by Visible Images and Machine Learning. IEEE Trans.
Instrum. Meas. 2020, 70, 5004511. [CrossRef]
14. Hernández-Guiteras, J.; Riba, J.-R.; Romeral, L. Redesign process of a 765kVRMS AC substation connector by means of 3D-FEM
simulations. Simul. Model. Pract. Theory 2014, 42, 1–11. [CrossRef]
15. Jalil, M.; Samet, H.; Ghanbari, T.; Tajdinian, M. An Enhanced Cassie-Mayr Based Approach for DC Series Arc Modeling in PV
Systems. IEEE Trans. Instrum. Meas. 2021, 70, 9005710. [CrossRef]
16. Maqsood, A.; Oslebo, D.; Corzine, K.; Parsa, L.; Ma, Y. STFT Cluster Analysis for DC Pulsed Load Monitoring and Fault Detection
on Naval Shipboard Power Systems. IEEE Trans. Transp. Electrif. 2020, 6, 821–831. [CrossRef]
17. Abomailek, C.; Riba, J.-R.; Casals-Torrens, P. Feasibility analysis of reduced-scale visual corona tests in high-voltage laboratories.
IET Gener. Transm. Distrib. 2019, 13, 2543–2549. [CrossRef]
18. IEEE Std 100-2000; The Authoritative Dictionary of IEEE Standards Terms, Seventh Edition. IEEE: Piscataway, NJ, USA, 2000;
pp. 1–1362.
19. Chai, H.; Phung, B.T.; Mitchell, S. Application of UHF Sensors in Power System Equipment for Partial Discharge Detection:
A Review. Sensors 2019, 19, 1029. [CrossRef] [PubMed]
20. Souza, A.L.; Lopes, I.J.S. Experimental investigation of corona onset in contaminated polymer surfaces. IEEE Trans. Dielectr. Electr.
Insul. 2015, 22, 1321–1331. [CrossRef]
21. Kozioł, M.; Nagi, Ł.; Kunicki, M.; Urbaniec, I. Radiation in the Optical and UHF Range Emitted by Partial Discharges. Energies
2019, 12, 4334. [CrossRef]
22. Chen, L.; MacAlpine, J.M.K.; Bian, X.; Wang, L.; Guan, Z. Comparison of methods for determining corona inception voltages of
transmission line conductors. J. Electrostat. 2013, 71, 269–275. [CrossRef]
23. Riba, J.-R.; Abomailek, C.; Casals-Torrens, P.; Capelli, F. Simplification and cost reduction of visual corona tests. IET Gener. Transm.
Distrib. 2018, 12, 834–841. [CrossRef]
24. Bas-Calopa, P.; Riba, J.R.; Moreno-Eguilaz, M. Corona Discharge Characteristics under Variable Frequency and Pressure Environ-
ments. Sensors 2021, 21, 6676. [CrossRef]
25. Schreiber, P.; Dang, T.; Pickenpaugh, T.; Smith, G.A.; Gehred, P.; Litton, C.W. Solar-blind UV region and UV detector development
objectives. In Proceedings of the Optoelectronics ’99—Integrated Optoelectronic Devices, San Jose, CA, USA, 23–29 January 1999;
SPIE: San Jose, CA, USA, 1999; Volume 3629, pp. 230–248.
26. Schühle, U.; Hochedez, J.-F. Solar-blind UV detectors based on wide band gap semiconductors. In Observing Photons in Space;
Springer: New York, NY, USA, 2013; pp. 467–477.
27. Turner, J.; Igoe, D.; Parisi, A.V.; McGonigle, A.J.; Amar, A.; Wainwright, L. A review on the ability of smartphones to detect
ultraviolet (UV) radiation and their potential to be used in UV research and for public education purposes. Sci. Total Environ.
2020, 706, 135873. [CrossRef] [PubMed]
28. European Standard EN 3475-603:2018-03; Aerospace Series—Cables, Electrical, Aircraft Use—Test Methods—Part 603: Resistance
to Wet Arc Tracking. Comite Europeen de Normalisation: Brussels, Belgium, 2018; pp. 1–12.
29. Degardin, V.; Kone, L.; Valensi, F.; Laly, P.; Lienard, M.; Degauque, P. Characterization of the High-Frequency Conducted
Electromagnetic Noise Generated by an Arc Tracking between DC wires. IEEE Trans. Electromagn. Compat. 2016, 58, 1228–1235.
[CrossRef]You can also read