PHD CAREER PATHWAYS A QUANTITATIVE STUDY OF MCGILL'S PHD GRADUATING COHORTS 2008-2018 - TRACE MCGILL
←
→
Page content transcription
If your browser does not render page correctly, please read the page content below
PhD Career Pathways
A Quantitative Study of McGill’s PhD Graduating Cohorts
                      2008-2018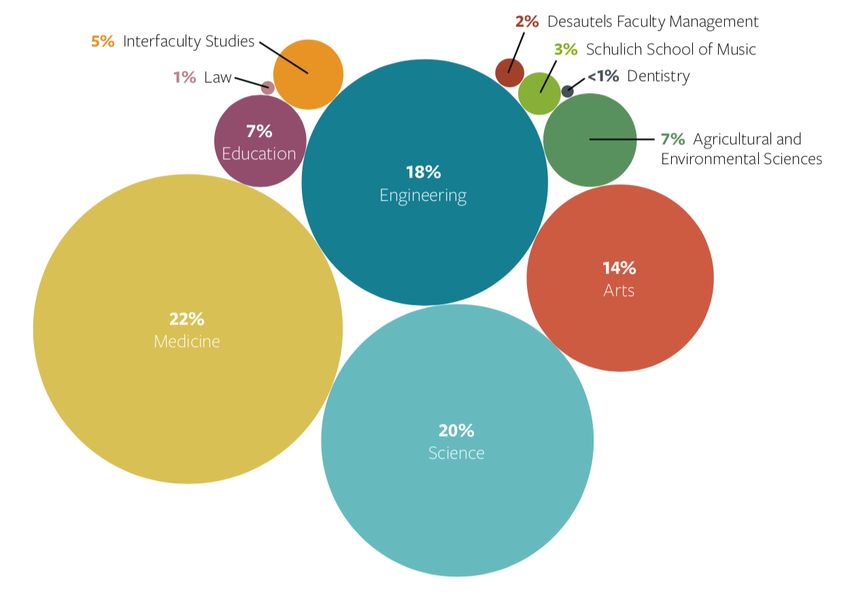
Introduction

TRaCE McGill is a university-wide project that tracks the career outcomes and pathways of McGill PhD
alumni who graduated between 2008 and 2018. Led by a team at Graduate and Postdoctoral Studies
and graduate student researchers, TRaCE McGill not only gathered statistical information on over
4,500 PhD graduates, but also interviewed over 300 of them across all faculties. TRaCE McGill’s focus
on both quantitative and qualitative knowledge shows how a doctoral degree can lead to a multiplicity
of successful, socially valuable, and personally fulfilling careers in a variety of sectors both inside and
outside academia. As part of its legacy, TRaCE McGill is also building a mentoring community of PhD
graduates who are committed to helping doctoral students and recent grads find their own career
pathways.

 TRaCE McGill’s integration of statistical data, narrative knowledge, and
community building is unique in the world among PhD tracking projects.

This report presents the methods and findings of the TRaCE McGill quantitative study. The TRaCE
McGill quantitative study successfully tracked over 88% of all 5,523 alumni who earned their PhD at
McGill from 2008 to 2018 inclusive (the “cohort”). The first tool used for data collection was a survey sent
to our study cohort in the summer of 2019. Survey respondents gave us precious information about their
current employment, location, and level of satisfaction with their professional situation. Building on this
data, a team of 14 graduate student researchers from each faculty tracked the PhD graduates by
searching publicly available data from institutional and other professional websites.

Although this report’s only focus is on the quantitative analysis, the unique contribution of the TRaCE
project rests on telling the individual stories of the PhD graduates and collecting qualitative
information that goes beyond the numbers and statistics. Why did McGill grads choose to do a PhD in
the first place? What was the role of their graduate studies? How did their career pathways unfold? These
were some of the questions answered by over 300 PhD alumni who shared their individual stories with a
graduate student from their respective faculty. The interviews were conducted by 17 graduate students
over the winter and summer of 2020. A team of four graduate student editors was in charge of
transcribing and editing as many interviews as possible over the course of the study; they will complete
over 100 published narratives by spring 2021.

                                                                                                          1
Methodology
TRaCE McGill builds on the methodological know-how acquired during two previous nationwide
projects, the TRaCE pilot project (2016-2017) and TRaCE 2.0 (2018-2019). Combined, these two
initiatives tracked over 4,500 and interviewed over 330 PhD grads in the humanities, social sciences, and
fine arts from 25 Canadian universities universities1.

Participants

Participants were McGill alumni who graduated from a doctoral program between 2008 and 2018,
inclusive (n=5,253). The McGill office of Analysis, Planning and Budget compiled the names of the alumni
who met the inclusion criteria. University Advancement was able to provide email addresses for 4,691
(89.3%) of the target population.

Data Collection

We used two methods of data collection: a) an online survey (“data survey”) and b) a search of public
websites (“data scrape”).

Data survey

The survey instrument was created by the McGill office of Analysis, Planning and Budget in Limesurvey,
an online survey tool used by McGill University for institutional research. The survey included several
demographic items (gender identity, race, ethnicity, and sexual orientation), and an item on current
employment situation (employed, unemployed but looking for a job, in a postdoc, caring for family, or
other). Branching was used to guide respondents to the next relevant question based on a previous
response. For example, in the survey, only respondents who indicated that they were “employed”
received follow-up questions about their employer, job title, field of work, job satisfaction, the relevance
of their field of study to their current job, and the fit of their qualifications to their current job.

Alumni email addresses were imported into Limesurvey and a unique token was generated for each
address. Tokens were used to create a personalized survey link for each participant that enabled
researchers to isolate non-responders with reminder emails and to link participants’ survey responses to
their McGill student record data. Invitations to this closed-access survey were sent electronically.
Reminders were sent to non-responders every two weeks over an 8-week period. The survey closed in
August 2019 with a response rate of 12.6%.

Concurrently, a second version of the survey was created to facilitate greater engagement. This survey
was open-access; that is, it did not use a token and was accessible to anyone with the survey link. Two

1
 The TRaCE pilot project tracked 2,700 PhD grads in the humanities from 24 Canadian universities. TRaCE 2.0 expanded on the
TRaCE pilot project by tracking 1,818 PhD graduates in the humanities, social sciences, and fine arts from 8 Canadian universities.
Both projects conducted over 330 interviews combined. Click here for the full quantitative and qualitative reports. All the published
narratives of TRaCE Pilot and TRaCE 2.0 can be found here.

                                                                                                                                   2
new items were added to the open-link version of the survey to enable the verification of respondents as
belonging to the target population. Respondents were required to provide one of two unique identifiers:
their 9-digit McGill ID number or McGill student email address. The open-access survey launched in July
and was publicized and shared via McGill’s social media channels (e.g., Twitter, Facebook) and via
websites (LinkedIn). The open-access survey closed in August 2019, and yielded 54 respondents.

A total of 645 responses were collected.

Survey participants were volunteers. Participation in the closed-access survey was incentivized with the
chance for respondents of awarding a bursary in their name to a current student from their former
department. These bursaries took the form of gift cards (eight in total) to the James McGill Bookstore,
ranging in value from $100 to $400. The winning respondents were randomly selected by the office of
Analysis, Planning and Budget. Gift cards were then awarded to a randomly selected graduate student
in the winning respondent’s former department or institute.

Data Scrape

The data scrape method sought to collect data on the target population using publicly available
information. Survey respondents were not excluded from the data scrape. To conduct this data scrape,
graduate student researchers from every faculty (13 PhD students and one Master student) were hired
and trained by TRaCE McGill project leaders in the Office of Graduate and Postdoctoral Studies at McGill
University.

The complete list of 5, 253 PhD alumni was partitioned (primarily by faculty) and each section was given
to a graduate student researcher. The list of PhD alumni entrusted to each graduate student researcher
contained the graduates’ first and last name(s), gender, faculty of enrolment, year of graduation, and
dissertation title.

Data were scraped between October 2019 and January 2020 from public websites including university
websites, LinkedIn, ResearchGate, etc. Following data collection, faculty sections were merged. The
TRaCE project manager reviewed and standardized the data, and undertook quality control measures
(more information in the section on the scope of the data scrape).

Graduate student researchers were provided data collection guidelines that used a standardized
taxonomy to categorize each graduate’s position and employer by sector, main field of employer,
graduate’s job function, country of employer, and province (if living in Canada). If the graduate was
unemployed but the country of residence was known, the latter data was included. The taxonomy can
be found in appendix of this report.

A standardized approach for the categorization of higher order employment situations (e.g.,
employment sector) was used, whereas the categorization of granular employment details (e.g., job
function) was more variable. The question of whether academic positions were tenure track or non-
tenure track, for instance, was of great interest to the project, yet sometimes difficult to verify across
institutions, educational systems, and nations. Graduate researchers were instructed to categorize
academic positions as non-tenure track by default if they had doubts about a position’s tenure status.

                                                                                                        3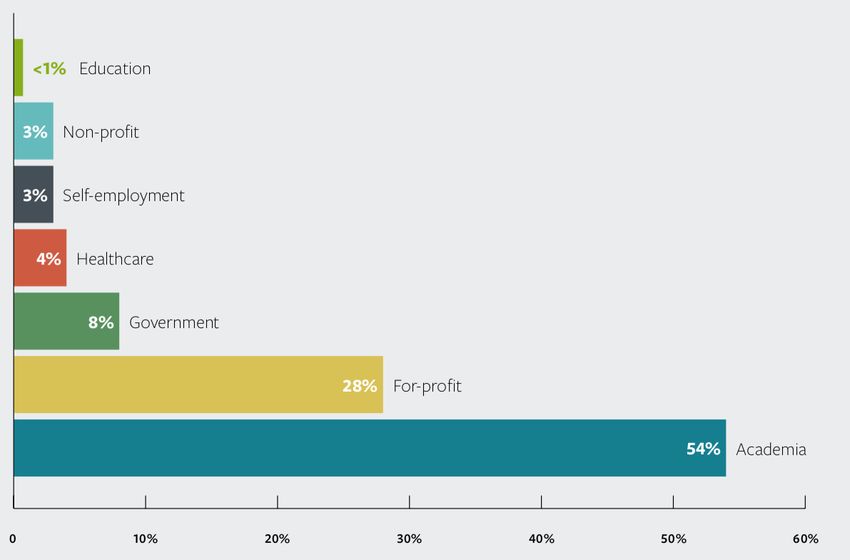
Scrape results were not validated against survey results, since there was a gap of up to seven months
between the time graduates responded to the survey and when researchers performed the data scrape.
Employment situations may indeed have changed at any time over those seven months. For 31 graduates,
survey data was available to fill gaps in the scrape data (e.g., cases where current information could not
be found or confirmed online). Survey data on employment status, location of employer, sector of
employment, and job function was added to the scrape data set for these 31 graduates (more
information on the scope of the scrape data below).

Analysis

Prior to analysis, datasets were cleaned. The data scrape and survey data were analysed separately.
Analysis was performed using R (R Core Team, 2019). We explored both datasets using basic descriptive
statistics (which describes the data as is) and simple inferential statistics (which allows predictions based
on the data).

Our descriptive analysis focused on exploring differences and similarities between
faculties/departments, gender, employment, and geography. Our inferential analysis focused on
associations between variables in the survey data which could be generalizable to the cohort. As this
study is cross-sectional and more advanced statistically methods were not deployed, results should be
taken as descriptive and associations should not be viewed as causal.

There is also potential for selection bias to skew the results of the data scrape. A potential impact of
selection bias is an over-representation of individuals who are employed and who work in certain sectors.
It may indeed be systemically easier to find graduates who are employed and who work for companies
or institutions that make information about their employees publicly available online. The survey may
also have selection bias, since some individuals who chose to participate could have career pathways
substantially different from some of those who did not participate. Selection bias could skew the results
of the descriptive and inferential statistics.

                           Scrape Data: A Global portrait

Scope of The Data

From the beginning of 2008 to the end of 2018, 5,253 individuals graduated from doctoral programs at
McGill (the “cohort”). A search of public websites enabled us to track 84% of the cohort with high
confidence (n = 4427). This means we are confident to know their current employment situation and
know the location of their employer (country at the least). For 4% of the cohort, we were able to gather
some data, but it was not clear if this data was up to date (n = 194). For 12% of the cohort, no information
relating to the grad was found.

In 31 cases where no information or incomplete information was found for individuals, survey data was
added to the data scrape data set. Since in 17 of these cases the survey captured an employment status
that proved difficult for researchers to capture via data scrape (e.g., unemployed but looking for a job,
retired, caring for family, pursuing further studies, etc.), it was decided that the data should be added as

                                                                                                           4
a supplement to provide a fuller picture of graduate employment. We expect that, within the 12% of the
cohort we were unable to find, there are more graduates who are unemployed but looking for a job,
retired, caring for family, or pursuing other studies. This brought the final total of data capture to 4,446
graduates with complete data, 191 graduates with some data, and 616 graduates with no data.
Data on gender, immigration status at enrolment, graduation year, and faculty of enrolment were
supplied from McGill University records, allowing us to have complete data for these variables. There
does not appear to be a difference in data capture rate by gender or immigration status. There was an
85% and 84% capture rate for complete data on women and men, respectively. It was an 85% and 83%
capture rate for domestic and international alumni, respectively. We postulate that some international
graduates likely used romanised first names while at McGill, but might not be using these names post
graduation, making them harder to find via search engines. We thus expect we may have missed a
number of graduates using different names post graduation (such as international graduates or those
who might have changed their surname after marriage).
There was a difference, though slight, in capture rates by year of graduation and faculty (Table 1; Table
2). This suggests we were less successful at tracking alumni who graduated in the last couple of years.
This may be due to their not having entered the job market yet. Employed individuals are generally easier
to find due to their larger online presence. Graduates who were not part of the traditional workforce at
the moment of the data scrape (e.g., caregivers or currently unemployed) were likely harder to find and
are therefore likely missing in this dataset. It is also worth noting that individuals working in the academic
sector (e.g. post-docs, tenure-track positions, and non-tenure-track faculty positions) most likely had an
institutional online presence that highlighted their academic credentials, making it easier to find them
and to validate their identities online.
Table 1: Rate of complete data capture for data scrape by year of graduation for PhD graduates
Year 2008 2009 2010 2011 2012 2013 2014 2015 2016 2017 2018
% 82 86 83 84 86 86 88 88 87 82 80
Table 2: Rate of complete data capture for data scrape by faculty for PhD graduates
Faculty %
Agricultural and Environmental Sciences 85
Arts 85
Dentistry 77
Desautels Faculty Management 91
Education 80
Engineering 80
Interfaculty Studies 87
Law 94
Medicine and Health Sciences 85
Schulich School of Music 93
Science 89
5Who Are The Graduates?
From the basic descriptive analysis of the data supplied directly by McGill University, the majority of the
cohort was male (54%). McGill Enrolment data does not currently include a non-binary gender option,
so this option could not be included in the data scrape, but it was a question included in the TRaCE
McGill survey (see the survey results section below).
Between 400 and 550 PhDs graduated per year from McGill (Table 3). The faculty with the most
graduates was Medicine and Health Sciences (n = 1184) (Table 4) or 23% of the cohort (Figure 1). While
most faculties had similar rates of male and female graduates, Engineering, Science, and Medicine and
Health Sciences were more gender-skewed with Engineering and Science having more male graduates
and Medicine and Health Sciences having more female graduates. Data on trends and patterns in PhD
enrollment have been evaluated elsewhere and can be seen in enrollment statistics2.
Table 3: Number of McGill doctoral graduates per year
Year 2008 2009 2010 2011 2012 2013 2014 2015 2016 2017 2018
No. of 421 439 445 401 445 480 526 542 519 530 504
graduates
Table 4: Number of McGill doctoral graduates by faculty
Faculty Number
Agricultural and Environmental Sciences 355
Arts 712
Education 353
Engineering 939
Dentistry 48
Desautels Faculty Management 115
Interfaculty Studies 270
Law 78
Medicine and Life Sciences 1184
Schulich School of Music 161
Science 1038
2
Annual McGill University Enrolment Reports are available at www.mcgill.ca/es/registration-statistics.
6Figure 1: Proportion of McGill PhD Graduates from 2008-2018 by Faculty
Where Are They?
The majority of the cohort still works in Canada (Figure 2). We determined the country and province (if
in Canada) of employer for 4,635 individuals. This number also included country of residence for
individuals who are not working. While it is possible that some graduates might be working remotely,
the country where the employer is located was selected as the country of residence for graduates. Of the
4,635 graduates, 2,723 live or work in Canada (59%) and 34% in Quebec.
Roughly a third of domestic students we have data on appear to be working outside Canada (34%), while
two thirds of international students (66%) are not currently working in Canada. The percentage of
graduates working in Canada by faculty ranges from 49% to 60%, with the exception of the Faculty of
Education where 77% of the graduates are working in Canada.
7Figure 2: Proportion of PhD graduates with Canadian vs. Non-Canadian employers based on
immigration status at time of enrolment
Table 5: The number and percentage of graduates living in Canada by faculty
Faculty Number in Canada % in Canada
Agricultural and Environmental Sciences 197 60
Arts 350 57
Education 220 77
Engineering 469 60
Dentistry 24 56
Desautels Faculty of Management 53 49
Interfaculty Studies 134 57
Law 40 54
Medicine and Health Sciences 643 60
Schulich School of Music 85 57
Science 508 54
8In What Sector Are They Working?
We looked at the sectors in which graduates are working: academia, for-profit, government, healthcare,
self-employment (entrepreneur/freelancing), non-profit, and education.
The Prevalence of the Academic Sector
While a portion of the graduates work in the for-profit sector (28%) or the government (8%), the majority
of the cohort is working in academia (Figures 3 and 4). Of the 4,624 graduates on whom we have
information and who are employed, 54% work in academia. Our definition of the academic sector
includes universities, colleges, CEGEPS, and university research centres or institutes. While a majority of
graduates work in the academic sector, they hold a range of different positions within that sector,
including post-doctoral positions.
Figure 3: Sector of employment for doctoral graduates
9Figure 4: Proportion of doctoral graduates employed in each sector by faculty
Main Employment Sectors
In addition to identifying what sectors graduates are working in, the data scrape collected data about
the types of work graduates are engaged in within those sectors. Below, we look at the top four sectors
where graduates find themselves post graduation as of 2019: academic, for-profit, government, and self-
employment.
The Academic Sector
Women in the Academic Sector
Women are employed in the academic sector at slighter higher rates than men. Of female PhD graduates,
57% are in the academic sector as against 51% of male graduates. In absolute numbers, slightly more
10men work in academia (n = 1285) than women (n = 1206) as there are more male graduates overall in
the cohort. The exceptions are those who work in for-profit organizations.
Tenure-track Jobs
Of the 2,491 graduates who work in academia in a research/teaching capacity, 43% are in tenure-track
jobs (n = 1071) (Figure 4). Of the 4,624 graduates we have data on and who are employed, 23% have
tenure-track jobs. This percentage is the same for men and women.
The percentage of graduates in tenure-track positions is similar across faculties, except for the Desautels
Faculty of Management, where the rate of tenure-track placement is higher. Some faculties have higher
percentages of their graduates in academia and in tenure-track positions. For example, graduates from
the Desautels Faculty of Management and the Faculty of Arts both had higher rates of tenure-track
placement. Recent graduates are less likely to be in a tenure-track position. This may be partly due to
tenure-track positions requiring successful applicants to have finished a postdoc or gained experience
in non-tenure track positions prior to entering tenure-track positions.
Gender did not appear to be a factor in relation to securing a tenure-track position. Working for an
employer based in Canada was associated with a decreased chance of being in a tenure-track position.
This may be an artifact of bias in the data capture since we might have been better at finding graduates
in non-tenure track positions in Canada than we were at finding non-tenure-track graduates outside of
Canada.
11Figure 5: Percentage per faculty of graduates working in and outside academia, with and without
tenure-track jobs
For-Profit Sector
Of those graduates working in the for-profit sector (n = 1289), 44% work as experts (e.g., lawyers, doctors,
engineers, architects, librarians, consultants), 26% as non-academic researchers, 18% in management or
policy positions, and 5% in administration positions. The remaining 6% include artists, communication
or information professionals, sales or marketing professionals, teachers or trainers, and post-doctoral
researchers in for-profit organizations.
12Figure 6: Proportion of graduates from each department that are employed in the for-profit sector
0% 20% 40% 60%
As the numbers indicate, graduates from the Faculty of Arts are some of the least likely to find themselves
in the for-profit sector while engineers are the most likely (Figure 6). Graduates from the departments of
Electrical and Computer Engineering, Mechanical Engineering, Air and Space Law, and Mining and
Materials work in for-profit organizations post graduation at the highest rates. From those departments,
61%, 55%, 54%, and 52% of graduates, respectively, have gone into the for-profit sector. In the Faculty
of Science, Computer Science graduates are the most likely to go into the for-profit sector at 48%.
Chemistry grads (47%) are the next most likely. Economics graduates are the grads from the Factuly of
13Arts who work in the for-profit sector at the highest rate (22%), followed by East Asian Studies graduates
(17%).
Fewer women work in the for-profit sector, where we find 23% of female graduates compared with 32%
of male graduates. This may be due to lower numbers of women who graduated in the departments
that are most likely to have graduates working in the for-profit sector. Overall, within the for-profit sector,
most of the graduates were working for employers whose main fields were related to STEM, life-sciences
or health.
Government Sector
Those working in government (n = 361) tend to work as non-academic researchers (45%) or in
professional expert practice (24%). Expert practice in our data brings together occupations which require
a professional designation, such as lawyers, doctors, architects, engineers, librarians, and other fields.3
Graduates from the Faculties of Agricultural and Environmental Sciences, Law, Engineering, and Science
have a higher probability of going into this sector. Seven percent of female graduates and eight percent
of male graduates work in government.
Self-Employment sector
The self-employment/entrepreneur/freelancing sector is a very diverse group. The most common job
titles in this sector are the following: consultant, musician/composer, co-founder/founder, and
writer/editor/translator.
For both male and female graduates, only 3% overall are primarily self-employed. It is possible, however,
that selection bias factors into this finding since we may have missed forms of part-time freelance work
that graduates do.
3
The Professional: Expert Practice category did not include K-12 teachers, who had their own separate professional
category.
14Survey Data
How it Compares to the Data Scrape
The individuals from the survey were a subset of the larger 2008-2018 cohort. The survey captured 12%
(n = 642) of the total cohort. In terms of gender, it captured 14% of females and 11% of males from the
total cohort. There was not a large difference in the response rate among the faculties (Figure 7)4.
Figure 7: Survey response rate by faculty relative to full cohort
AGRICULTURAL AND ENVIRONMENTAL SCIENCES 12,4%
ARTS 11,0%
DENTISTRY 16,7%
DESAUTELS FACULTY OF MANAGEMENT 12,2%
EDUCATION 12,2%
ENGINEERING 8,9%
INTERFACTULTY STUDIES 18,5%
LAW 15,4%
MEDICINE AND HEALTH SCIENCES 13,9%
SCHULICH SCHOOL OF MUSIC 12,4%
SCIENCE 12,2%
0,0% 2,0% 4,0% 6,0% 8,0% 10,0% 12,0% 14,0% 16,0% 18,0% 20,0%
In the survey data, 18% of respondents identified as being on the tenure track. In the data scrape, the
number in a tenure-track-position was 23%.5 It appears that those in tenure-track positions were slightly
less likely to respond. However, most survey respondents were relatively new graduates. 55% had
graduated in the past 5 years, between 2015-2018 and 25% had graduated in the past 3 years, between
2017-2018. As could be anticipated, the data scrape suggests that graduation year affects one’s chances
of being in a tenure-track position in 2019, and that more recent graduates are less likely to be in tenure-
track positions within their first few years post graduation. The survey data also seems to support the
trend identified in the data scrape suggesting that recent grads are more likely to be in contingent
positions, such as post-doctoral fellowships, than they are likely to be in permanent tenure-track
positions (if they are working in the academic sector).
4
A chi-squared test of independence did not suggest that there was any difference by faculty in response rate, based
on a 95% confidence level (p-value = 0.23).
5
The denominator for this percentage is all individuals we had at least some data on, not just the employed, to make
it comparable to the percentage of the survey data.
15The open-access survey was accessible to McGill graduates via a web link and the closed-access survey
was sent directly to graduates using the graduate’s last known email address (often a McGill student
email address). We expect that the alumni who graduated some time ago were less likely to access their
student email addresses (and/or that we may not have had their current emails on file), explaining why
recent graduates responded at a higher rate. We can also postulate that graduates who completed the
survey differ in some ways from those who didn’t, perhaps feeling more compelled to tell us about where
they are now. We however can’t know precisely if and how this self-selection might bias our results.
Who Are They?
Self-identified Demographic Characteristics
In the finalized survey dataset, of those that answered (n = 626), 47% identified as men, 52% as women,
0.2% as non-binary, 0.3% as transgender, and 0.2% identified as two-spirited. The majority of the
participants identified as White/Caucasian (56%) (Table 6). Asians also made up a large portion of the
sample with these proportions: Chinese (9%), South Asian (8%), West Asian (6%), Southeast Asian (2%),
Korean (1%), Filipino (1%), and Japanese (1%). Five percent of the sample identified as Arab, 6% as Latin
American, 3% as Black, and 0.5% of the sample identified as Indigenous. These ethnicity/race groups
were not mutually exclusive and 5% of the sample identified as mixed race.
Table 6 : Self-identified ethnicity/race in the survey dataset participants (n = 622)
Ethnicity /Race Number %
Indigenous 3Table 7: Self-identified sexual orientation in the survey dataset participants (n = 622)
Sexual orientation N %
Asexual 15 2
Bisexual 12 2
Gay 18 3
Lesbian 7 1
Heterosexual 507 82
Queer/Pansexual 7 1
Don’t know 3Table 8: Current situation of employment in the survey participants
Current Situation Numbers %
Employed / Self-employed / Freelancing (not including 473 74
postdoctoral studies)
Pursuing postdoctoral studies 117 18
Not currently employed, but looking for a job 18 3
Other 19 3
Pursuing further studies, not including postdoctoral studies 12 2
Caring for family 3Figure 8: Overall satisfaction with current job by faculty of respondent
Did They Stay in Canada?
The majority in the survey dataset is working in Canada, a finding similar to the data scrape. Of those
who are employed, 62% (n = 270) are working in Canada. The United States is the next most common
country of employment (n = 91; 21%). This was also seen in the data scrape dataset. We also asked
graduates to identify their immigration status upon graduation, and to then identify their current status
in Canada. In Figure 9, we looked at the change in immigration status in Canada between graduation
and when the survey was taken, as well as their current country of residence.
The majority of permanent residents at graduation had become full Canadian citizens by the time the
survey went out to the graduates. Only 17% of permanent residents (at graduation) had left Canada. The
majority of international students (at graduation) were now living outside of Canada (61%). Of these
international students still in Canada, the majority were now permanent residents.
Of the students that were not Canadian citizens during their PhD at McGill, 50% were still in Canada at
the time of the survey. This suggests a significant retention of non-Canadian citizen PhD graduates in the
country. Again, this data may be skewed by selection bias.
19Figure 9: Flow of Canadian immigration status between graduation and the present
Permanent resident Permanent resident
Not known
Not living in Canada
International student
Not known
International student
Canadian citizen
Canadian citizen
Status at Graduation Current Status
Conclusion and Legacy
TRaCE McGill’s quantitative results demonstrate that McGill PhD graduates find employment in a variety
of fields. With a slight prevalence of academia, the doctoral alumni work in other key sectors such as the
for-profit and government sectors. We also saw that the trajectory of men and women are very similar in
most sectors and that career outcomes can vary substantially between faculties and departments.
While the scrape data provides a snapshot of how diverse career outcomes were for McGill PhD
graduates in Fall 2019, the survey data provides insight into what those outcomes mean for the graduates
themselves in terms of the relevance of their doctoral training to their current position and their overall
satisfaction with their current situation. We saw that the great majority of PhD alumni who responded to
the survey are satisfied with their current job and find their doctoral degree relevant to their work.
Further research will be required to explore the career trajectories of McGill PhD graduates over time,
and to explore populations of graduate students not included in this study (e.g., Master’s students).
Now that TRaCE McGill is in its final phase, our sights turn to building a vast mentoring community. Over
70 graduates (and counting!) from our study cohort have volunteered as mentors for current graduate
students and recent grads, who can reach out to them individually via the TRaCE McGill website. In
addition, a series of round tables, webinars and other events – such as speed mentoring sessions, in
partnership with the Post-Graduate Student Society – bring students in contact with our PhD alumni.
Open to all who wish to attend, these events feature graduates from all faculties who share their own
career pathways, their successes and challenges, and their words of advice to current and prospective
PhD students.
By reaching out to grads from their faculty, doctoral students have the opportunity to explore careers
beyond the academy, get the mentorship they need, and make sense of their own narratives in the
making.
20The people behind TRaCE McGill
The TRaCE McGill project has been the work of many individuals:
Project Director: Prof. Paul Yachnin
Project Managers: Dr. Marie-Claude Felton and Dr. Chantelle Thauvette
Graduate student researchers: Renzo Calderon Anyosa, Ashley Chin, Collins Chukwuma, Claudia Claros,
Jarred Dunn, Claire Edrington, Sam Howes, Felicia Huang, Dongyun Jung, Gabrielle Kielich, André
Liberati, Heba Madi, Sara Mahabadi, Helen Martin, Samuel Preston, Elena Corella Puertas, Joanne Smith
and Hongyu Zhang
Narrative editors: Claire Edrington, Catherine Nygren, Sonja Soo and Willow White
Quantitative report: Martha Lee
21Appendix: – Categories used in the Data Scrape
Employment Sector Classifications:
• Academic Sector (e.g. college, university, university research centre or institute)
• Government (federal, provincial, municipal, public service, governmental research centre)
• Health care system
• Educator (K-12)
• For-profit organization
• Non-for-profit organization
• Self-employed/Entrepreneur/Freelancing
• Unknown
Main Field of Employer Classifications:
• Arts, Communications, & Entertainment
• Business, Financial Services, & Logistics
• Education, Public & Human Services
• Food & Agriculture; Environmental & Natural Resources
• Life Sciences & Health
• STEM Related
• Unknown
Job Function Classifications:
ACADEMIC: Research/teaching Tenure-Track (e.g. Assistant professor)
ACADEMIC: Research/teaching Non-Tenure-Track (Research associate; Adjunct; Lecturer; postdoc…)
PROFESSIONAL: non-academic research (Researcher at pharmaceutical company, at policy agency…)
PROFESSIONAL: Administration (Administrator, Project Coordinator...)
PROFESSIONAL: Information, Communications, Media (Comm. Officer, Journalist…)
PROFESSIONAL: Sales and Marketing (Sales rep., Marketing specialist…)
PROFESSIONAL: Management, policy, and leadership (Financial Director, Lead Policy Advisor,
Politician)
PROFESSIONAL: Artist (musician, composer, dancer, writer…)
PROFESSIONAL: teaching and training (non-college or CEGEP, non-university) (music teacher, K-12,
ESL, Instructor…)
PROFESSIONAL: Expert practice (doctor, Engineer, Architect, Librarian, Lawyer, Consultant,…)
UNKNOWN
22You can also read


