Phosphoproteome studies of human mitotic spindle proteins - Dissertation zur Erlangung des Doktorgrades der Naturwissenschaften (Dr. rer. nat.) ...
←
→
Page content transcription
If your browser does not render page correctly, please read the page content below
Phosphoproteome studies of human mitotic spindle proteins

                          Dissertation
     zur Erlangung des Doktorgrades der Naturwissenschaften
                         (Dr. rer. nat.)
                    der Fakultät für Biologie
          der Ludwig-Maximilians-Universität München

                        Vorgelegt von
                         Bin Wang
                        München 2009
Dissertation eingereicht am 17.12.2009
     Datum der mündlichen Prüfung: 04.05.2010

II        Erstgutachter: Prof. Dr. Erich A. Nigg
     Zweitgutachter: Prof. Dr. Angelika Boettger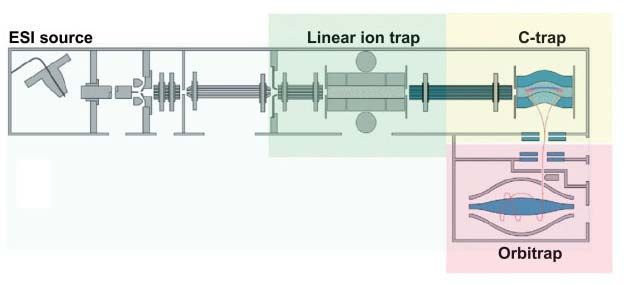
Ehrenwörtliche Erklärung und Erklärung über frühere Promotionsversuche
Hiermit erkläre ich, dass ich, Bin Wang, die vorliegende Dissertation selbständig und ohne
unerlaubte Hilfe angefertigt habe. Sämtliche Experimente wurden von mir selbst
durchgeführt, soweit nicht explizit auf Dritte verwiesen wird. Ich habe weder anderweitig
versucht, eine Dissertation einzureichen oder eine Doktorprüfung durchzuführen, noch habe
ich diese Dissertation oder Teile derselben einer anderen Prüfungskommission vorgelegt.

Bin Wang

München, den 16.Dec.2009

                                           III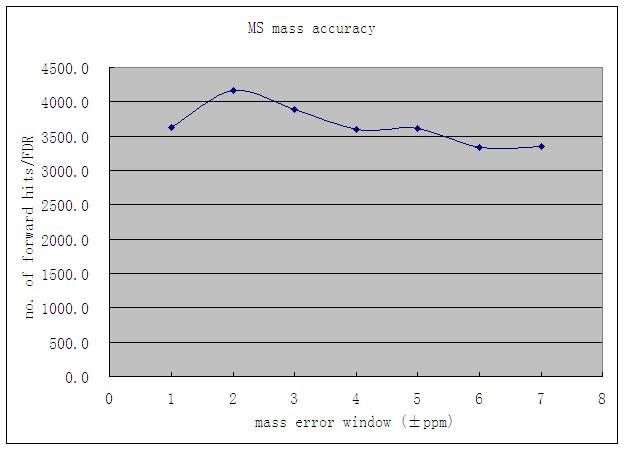
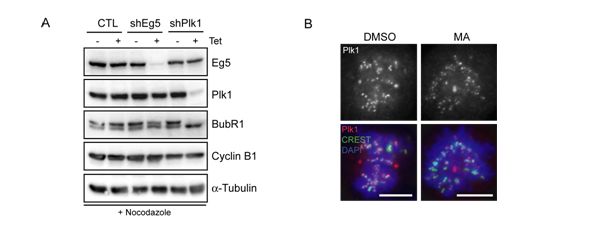
Table of contents ...........................................................................................................
Acknowledgement .................................................................................................................. 1
Summary ................................................................................................................................. 3
1     Introduction ..................................................................................................................... 5
    1.1      Cell cycle ....................................................................................................................5
    1.2      Mitosis......................................................................................................................... 5
        1.2.1 The mitotic spindle ............................................................................................... 7
        1.2.2 Phosphorylation in mitotic progression ................................................................ 8
    1.3      Polo-like kinase 1 (Plk1) ............................................................................................. 9
    1.4      Mass spectrometry based proteomics ........................................................................ 9
        1.4.1 General workflow of MS-based proteomics.......................................................... 9
        1.4.2 MS instrumentation ............................................................................................ 11
        1.4.3 MS-based Quantitative Proteomics .................................................................... 16
        1.4.4 Phosphoproteomics ........................................................................................... 20
2     Aims of this study ......................................................................................................... 22
3     Results ........................................................................................................................... 23
    3.1      Quantitative identification of Polo-like kinase 1 (Plk1) specific phosphorylation sites
    on human mitotic spindle proteins ..................................................................................... 23
        3.1.1 Introduction ........................................................................................................ 23
        3.1.2 Experimental design for the comparison of the spindle phosphoproteome
        between cells in the presence or absence of Plk1 ........................................................ 25
        3.1.3 Plk1-dependent human mitotic spindle proteome and phosphoproteome ......... 29
        3.1.4 Plk1-dependent quantitative human mitotic spindle phosphoproteome ............. 30
        3.1.5 Plk1 spindle substrates identification ................................................................. 35
        3.1.6 Validation of Plk1-dependent phosphorylation sites on spindle proteins through
        a candidate-based in vitro kinase screening ................................................................. 35
        3.1.7 Reconsideration of the Plk1 consensus motif .................................................... 38
        3.1.8 Plk1-dependent localization of spindle components .......................................... 39
        3.1.9 Integration of Aurora A and Plk1 activity ............................................................ 41
    3.2      Phosphoproteome analysis of human mitotic spindle proteins by using low-
    specificity protease elastase .............................................................................................. 44
        3.2.1 Introduction ........................................................................................................ 44
        3.2.2 Experimental outline ........................................................................................... 46
        3.2.3 Adjustment of the Elastase Concentration ......................................................... 46
        3.2.4 MS Mass Accuracy ............................................................................................ 46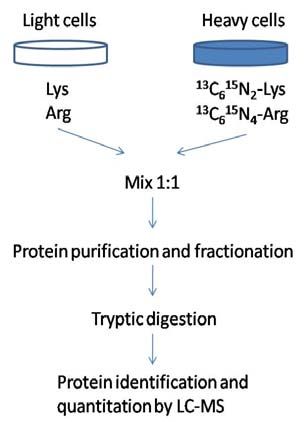
3.2.5 Elastase cleavage specificity ............................................................................. 48
3.2.6 Elastase cleavage scores .................................................................................. 50
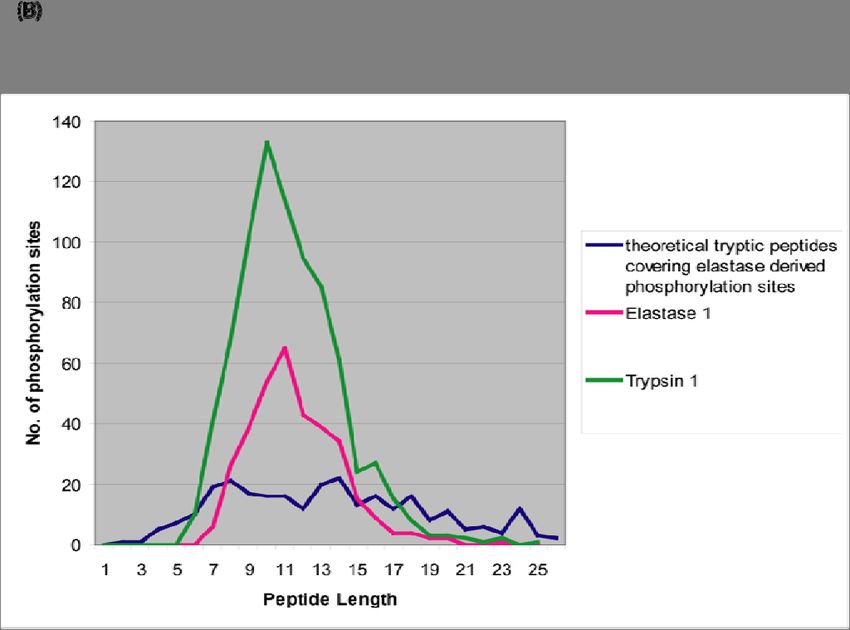
3.2.7 Comparison of phosphorylation site identification using trypsin and elastase ... 51
3.2.8 “Custom database” search strategy .................................................................. 53
3.2.9 Complementary phosphorylated peptide coverages using trypsin and elastase54
3.2.10 Testing for undersampling effects ..................................................................... 56
4 Discussion .................................................................................................................... 58
5 Material and Methods ................................................................................................... 63
5.1 Quantitative identification of Polo-like kinase 1 (Plk1) specific phosphorylation sites
on human mitotic spindle protein....................................................................................... 63
5.1.1 Materials ............................................................................................................ 63
5.1.2 SILAC media ..................................................................................................... 63
5.1.3 Cell culture and spindle isolation ....................................................................... 63
5.1.4 In vitro kinase assays ........................................................................................ 64
5.1.5 Gel Electrophoresis and In-Gel Digestion ......................................................... 64
5.1.6 Enrichment of Phosphorylated Peptides and Desalting .................................... 64
5.1.7 Nano LC-MS/MS ............................................................................................... 65
5.1.8 Database searching and Data Filtering ............................................................. 66
5.2 Phosphoproteome analysis of human mitotic spindle proteins by using low-
specificity protease elastase ............................................................................................. 67
5.2.1 Materials ............................................................................................................ 67
5.2.2 Cell Culture and Mitotic Spindle preparation ..................................................... 67
5.2.3 Gel Electrophoresis and In-Gel Digestion ......................................................... 67
5.2.4 Phosphorylated Peptide Enrichment and Sample Desalting ............................. 68
5.2.5 Nano LC-MS/MS ............................................................................................... 68
5.2.6 Data Processing and Analysis ........................................................................... 69
6 Abbreviations................................................................................................................ 70
7 References .................................................................................................................... 73
8 Appendix ....................................................................................................................... 80
Curriculum Vitae .................................................................................................................. 89
II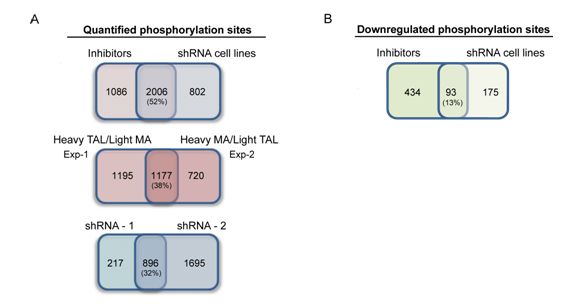
Acknowledgement

        Firstly, I would like to give my thanks to Prof. Dr. Erich A Nigg for providing me the
opportunity to pursue my doctoral degree in his laboratory. I thank Erich for all the invaluable
and helpful advice he has given me. I also thank Erich and Elena Nigg for the kind invitation
to their family at the beginning of my stay in Germany. I appreciate that warm welcome.
        I am thankful to Prof. Dr. Xinmiao Liang, who was the supervisor of my Masters
studies. I thank Prof. Liang for giving me the chance of doing my postgraduate studies in his
laboratory. I am especially grateful to Prof. Liang for encouraging me to do my Ph.D. at MPI
and all the help he has given me in the past years.
        I would like to express my deepest gratitude to Dr. Roman Körner, who is my supervisor
of my Ph.D. studies. I thank Roman for everything he taught me at the early period of my
Ph.D. with great patience, and also the guidance and all the helpful ideas for the projects I
worked on. I appreciate the precious friendship with him in private time, and I will never
forget the help he offered me for my personal life in Munich. I am very lucky to work with
him and have him as my supervisor.
        I am grateful to Ms. Alison Dalfovo for her great secretary assistance. I thank Alison for
all the help and kind suggestions she gave me in the past years.
        I am thankful to Dr. Anna Santamaria for the warm help at the early days of my stay in
Munich and for her great job for the collaborating Plk1 project in this thesis. I have learned so
much from our collaboration.
        I want to thank Dr. Rainer Malik for his contribution in the elastase project. I also want
to thank Kalyan Dulla for all the discussions and help. I thank Dr. Rene Lenobel for his kind
help at the first year of my studies in the lab.
        My special thanks to Albert Ries for his countless help and advices.
        I thank my friends Eunice, Anja W., Stefan L. and Shin for all the great time I spent
with.
        I want to thank all the Nigg department mates for creating such a stimulating and
friendly atmosphere in the lab. I have enjoyed and benefited a lot from this unforgettable
time.
        I want to thank Dr. Spielmann, Ms. Panglung, Mr. Fang and Mr. Shi for running the
MPG-CAS Ph.D. promotion program.
                                                   1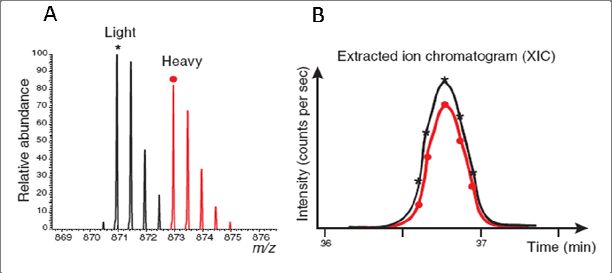
I thank Prof. Dr. Matthias Mann and Dr. Jürgen Cox for early access to the MaxQuant
software package.
     I thank Xiaofang Yang for being with me and the wonderful time spent together.
     Lastly, I would like to thank my parent Qijiang Wang and Shuxian Li for their endless
love and continues support.

                                             2
Summary
Mitosis is the process during which a eukaryotic cell segregates the chromosomes into
two identical daughter cells. The chromosomes are physically separated to the opposite poles
of the cell by the mitotic spindle, which is a highly dynamic microtubule (MT)-based
macromolecular machine. Spindle assembly begins early in mitosis and is completed when
the bipolar attachment of microtubules to kinetochore (KT) pairs is achieved. Many mitotic
spindle associated proteins are regulated by phosphorylation and dephosphorylation. A
comprehensive phosphorylation site mapping of mitotic spindle proteins would help us to
gain a better understanding of its functions and regulation in mitotic progression.
Mass spectrometry (MS) has become the most powerful and robust tool for protein
identification and the study of their post-translational modifications. The development of MS
hardware and data processing software made large scale quantitative proteomics and
phosphoproteomics studies feasible.
In the project of quantitative identification of Polo-like kinase 1 (Plk1) specific
phosphorylation sites on human mitotic spindle proteins, we present the first quantitative
study of the Polo-like kinase 1 (Plk1) dependent phosphoproteome of the human mitotic
spindle. Mammalian Plk1 controls centrosome maturation, spindle assembly and microtubule
attachment to kinetochores. However, despite the essential and diverse functions of Plk1, only
a limited number of substrates have been identified. In our study, we combine SILAC with
Plk1 depletion or inactivation, followed by spindle isolation and mass spectrometry to
compare the phosphoproteomes of mitotic spindles isolated from cells lacking Plk1 activity to
spindles from cells with fully active kinase. We report the down-regulation of more than 700
phosphorylation sites upon Plk1 inactivation, including 360 sites on known spindle proteins,
of which more than 100 were validated as direct Plk1 targets using in vitro phosphorylation of
synthetic peptide arrays. This approach identifies many novel Plk1 substrates and suggests a
broader phosphorylation consensus motif for this kinase than previously recognized.
Furthermore, we analyze in a quantitative manner the consequences of Plk1 inactivation on
the localization of its substrates to the spindle. We report the mis-localization of certain
centrosomal and kinetochore proteins upon Plk1 inhibition and further analyze the
kinetochore protein CENP-F as an example. Finally, we identify several Aurora A-dependent
phosphorylation events that depend on Plk1, thus highlighting the role of Plk1 in the
3regulation of Aurora A activity. Collectively, our data provides a rich source of information
on Plk1-dependent phosphorylation, Plk1 docking to substrates, the influence of
phosphorylation on protein localization, and the functional interaction between Plk1 and
Aurora A on the early mitotic spindle.
In the project of phosphoproteome analysis of human mitotic spindle proteins by using
the low-specificity protease elastase, we evaluated the use of elastase in a phosphoproteome
study of human mitotic spindle associated proteins. Despite the usefulness and obvious
advantages of trypsin in bottom-up proteomics experiments, it still has certain limitations in
sequence coverage and cleavage efficiency. As an alternative to specific enzymes, low-
specificity proteases have attracted our attention. Elastase became the enzyme of choice to
supplement tryptic digestions, mainly because it generates medium sized peptides in the mass
range between 500 Da and 1500 Da which are optimal for detection with current LC-MS
hardware. We took advantage of the high mass accuracy of Orbitrap mass spectrometers and
optimized the database search specificity by analyzing both elastase cleavage preferences and
employing a dedicated two-step database search strategy. Through this approach, we have
approximately doubled the number of detectable phosphorylation sites from elastase digested
samples. Remarkably, phosphorylation sites detected by trypsin and elastase were highly
complementary with an overlap of less than 10%. In total, we identified 1068 phosphorylation
sites using trypsin and 467 phosphorylation sites using elastase. Approximately 30% of the
phosphorylation sites were exclusively identified after digestion by elastase, demonstrating
the value of this enzyme for phosphoproteome studies.
41 Introduction
1.1 Cell cycle
The cell cycle is an ordered series of events that take place in a cell and leads to its
division and replication. Newly formed daughter cells can themselves grow and divide. In
bacteria and yeast, each round of cell division is sufficient to produce a complete new
organism. In higher eukaryotes, multiple and complex rounds of cell divisions are required to
produce functional organism and to replace dead cells. The most fundamental characteristic of
cell cycle through all living organism is to pass on exact genetic information to newly formed
daughter cells. To accomplish this, each cell first duplicates its genetic material and then
equally segregates it between two daughter cells to ensure each cell retains the exact same
content of genetic information. In eukaryotes, this process is divided into four sequential
phases: G1 (Gap phase1), S (Synthesis phase), G2 (Gap phase2) and M (Mitosis and
cytokinesis). DNA synthesis and replication occur in S phase. In M phase, cell growth and
protein production are greatly reduced, and duplicated chromosomes segregate equally to the
daughter cells. Between S and M phases, there are two gap phases called G1 and G2. During
G1 (after M phase and before S phase), cells grow in size, produce RNA and synthesize
proteins. In G2 (after S phase and before M phase), cells continue to grow and prepare for
entry into mitosis.
1.2 Mitosis
Mitosis is relatively brief but a key event during the cell cycle. In M phase, equal
segregation of genetic and cytoplasmic material takes place. Mitosis has five stages: prophase,
prometaphase, metaphase, anaphase and telophase (figure 1). In prophase, the interphase
chromatin condenses into chromosomes, which each comprises two chromatids held together
by protein complex cohesion. The centrosomes, which have been duplicated during S phase,
start moving to opposite poles and increase the nucleation of highly dynamic microtubules
(MTs) to build mitotic spindles 1, 2. During prometaphase, the nuclear envelope breaks down.
The microtubules emanating from opposite spindle poles are captured by kinetochores which
are situated on the centromeres of both sister chromatids. Attached chromosomes are then
moved to the equator of the cell in a process called chromosome congression. In metaphase,
5all attached chromosomes align on an equatorial plate known as the metaphase plate in the
middle of the cell. Once all chromosomes are properly aligned, the spindle assembly
checkpoint, which is a surveillance mechanism that is active in prometaphase to prevent
inaccurate separation of the sister chromatids, is satisfied. This leads to anaphase promoting
complex mediated ubiquitin-dependent degradation of the separase inhibitor securin, resulting
in the removal of sister chromatid cohesion and anaphase onset. In anaphase A, the sister
chromatids separate and are pulled to the opposite poles by shortening of kinetochore
microtubules. In anaphase B, the centrosomes move towards the cell cortex accelerating
chromosome separation. Mitosis ends with telophase, in which the nuclear envelope reforms,
the chromosomes arrive at the poles of spindles and start decondensing.
Figure 1. Schematic representation of different stages of mitosis and cytokinesis. The colours shown
here are brown for DNA, light green for centrosomes and dark green for MTs. Image adapted from
Alberts et al, Molecular Biology of the Cell, fourth edition, 2002.
Mitosis is followed by cytokinesis. In cytokinesis, the contraction of an actomyosin-
based contractile ring (formed during late anaphase) takes place at the site of the spindle
midzone, leading to furrow ingression. Cell division is completed by abscission and two
daughter cells are formed, each with one nucleus and one centrosome 3.
61.2.1 The mitotic spindle
Mitotic spindles pull the sister chromatids apart and move a complete set of
chromosomes to each pole of the cell, where they are packaged into daughter nuclei. This
ensures the faithful segregation of the genetic material during mitosis.
Figure 2. The features of the metaphase mitotic spindle. With their minus ends tethered at the
spindle poles, microtubules extend either to the kinetochores of paired chromatids (kinetochore
fibers), to the central spindle where they form an overlapping antiparallel array (inter polar
microtubules), or away from the spindle towards the cell cortex (astral microtubules). Image adapted
from Gadde S et al, Current Biology, 2004.
The microtubule array is biopolar, with minus ends tethered at the poles and plus ends
attached to the chromosomes (figure 2). In most vertebrate cells, the spindle poles are the
microtubule organizing centers, they are formed by the centrosomes. The mitotic spindle is a
highly dynamic microtubule-based structure. Microtubules continuously grow and shrink, this
behavior is regulated by motor proteins which can travel along microtubules, and many other
microtubule associated proteins (MAPs) which have important roles in the assembly and
stability of the microtubule array and the movement of chromosomes on the spindle.
71.2.2 Phosphorylation in mitotic progression
Mitotic progression is regulated by reversible protein phosphorylation (figure 3) and
irreversible protein degradation. These two mechanisms are interdependent since the
proteolytic machinery is regulated by phosphorylation and many mitotic kinases are down-
regulated by protein degradation. Cyclin-dependent kinase 1 (Cdk1), Polo-like kinase 1 (Plk1)
and Aurora kinases are the most prominent and well characterized mitotic regulatory kinases.
Cdk1 protein level is constant throughout the cell cycle. Its catalytic subunit has to bind to a
regulatory subunit called cyclin (Cyclin A or B) to become enzymatically active 4, 5.
Figure 3. Kinases play important roles at different mitotic stages. Image adapted from Nigg E A,
Nature Reviews, Molecular Cell Biology, 2001
Activated Cdk1 has many phosphorylation substrates in all mitotic stages, including
proteins important for nuclear envelope breakdown, chromatin condensation, spindle
assembly and centrosome separation. Furthermore, Cdk1/Cyclin B complexes are involved in
the regulation of the anaphase-promoting complex/cyclosome (APC/C) which triggers the
degradation of several mitotic regulators such as securin and Cyclin B itself 6, 7.
8Aurora kinases are also highly active during mitosis. Aurora A activity is closely
associated with the centrosomes and spindle assembly form prophase to telophase 8. It
controls the timely mitotic entry by modulating nuclear envelope breakdown 9 and assists in
centrosome maturation. Aurora B localizes to kinetochores and central spindles at different
mitosis stages 10. The kinase activity of Aurora B is required for spindle checkpoint signaling,
central spindle formation and cytokinesis 11.
1.3 Polo-like kinase 1 (Plk1)
Polo-like kinase 1 is well-characterized and has been reported to be involved in all
phases of mitosis12-14. It is highly conserved from yeast to human 14. Plk1 N-terminal harbors
the kinase catalytic domain whereas the C- terminal features a polo-box domain (PBD). The
PBD is required for Plk1 substrate targeting and subcellular localization. It recognizes and
binds to phosphorylated docking proteins, which results in a conformational change and
liberates the kinase domain of Plk1. Activated Plk1 can then phosphorylate either the docking
15
proteins or downstream targets . The docking proteins are phosphorylated by the so-called
priming kinases. Cdk1/Cyclin B, Calmodulin dependent kinase II 16, MAP kinase Erk2 17 and
Plk1 itself 18 are the most prominent priming kinases.
The localization of Plk1 is highly dynamic throughout mitosis. It accumulates at
14, 19
centrosomes during early mitosis to regulate centrosome maturation and separation . It
also binds to the kinetochores to assure their correct attachments to the mitotic spindle 20. Plk1
is further involved in the dissociation of chromosome cohesion through the removal of
cohesin, which holds the two sister chromatids together21, 22. In addition, Plk1 has been shown
to regulate the function of the anaphase-promoting complex/cyclosome (APC/C), which is
essential for mitotic exit 7, 23. At metaphase-anaphase transition, Plk1 relocalizes to the spindle
midzone and plays a key role in cytokinesis 14.
1.4 Mass spectrometry based proteomics
1.4.1 General workflow of MS-based proteomics
Modern proteomic approaches include mass spectrometry, protein microarray
technologies, large scale two-hybrid analysis, high-throughput protein production and
crystallization 24.
9Mass spectrometry measures the mass-to-charge ratios (m/z) of ionized molecules in the
gasphase and can be used to determine the elemental composition provided that the mass
accuracy of the instrument is sufficiently high. In proteomics, the measured m/z ratios and
fragmentation patterns reflect the amino acids composition and modifications of analyzed
peptides or proteins. In the past decade, mass spectrometry has been developed further
successfully and become a popular technique in a wide variety of biological studies,
especially for protein identification, the determination of protein post-translational
modifications, and the study of protein-protein interactions.
There are two general approaches in MS: “bottom-up” and “top-down”. In the “bottom-
up” strategy, proteins are enzymatically digested into peptides using proteases. The collection
of peptide products is then analyzed by the mass spectrometers. In the “top-down” strategy,
intact proteins are directly ionized and analyzed by mass spectrometry.
Figure 4. General workflow of bottom‐up MS‐based proteomics experiment. Illustration adapted
from Steen H et al., Nature Reviews on Molecular Cell Biology, 2004.
Due to the advantages in detection sensitivity, sample preparation, ionization and
fragmentation efficiency, “bottom-up” is by far the most widespread and successful method in
MS-based proteomics. A general workflow is depicted in figure 4. The proteins to be
analyzed are isolated or purified from cells or tissues. The purification of proteins often
includes gel electrophoresis as the last step. The proteins are then separated in the gel
according to their molecular weight or isoelectric point. The obtained gel lane is cut into
several slices, and then in-gel digestion of proteins is performed. Various proteases or
chemicals are available for this step. For the most popular enzyme trypsin, most peptides
consist of 6-20 amino acids, which is optimal for detection and identification by mass
spectrometry. Prior to MS analysis, the peptide mixtures normally undergo single or multiple
dimensions of on-line or off-line separation. Peptides are then ionized, their m/z values
determined by mass spectrometry, and further structural information generated by low energy
10excitation (MS/MS fragmentation). Finally, obtained mass spectra are searched against
protein databases via computer algorithms, returned search results identify peptide sequences
and post-translational modifications, thus allowing the identification of proteins and the
characterization of their modifications 25, 26.
In the “top-down” approach, intact proteins are directly ionized and measured in mass
spectrometers without previous proteolytic digestion. MS/MS fragmentation is also
performed by various activation methods. As an alternative approach, “top-down” obtains
better sequence coverage for protein identifications, and it can in principle provide complete
information on post-translational modifications. However, the application is usually limited to
small proteins with molecular weight up to 30 kDa and the analytical sensitivity is low
compared to the bottom-up strategy. Furthermore, insufficient automated hardware and
software tools within the field make high throughput and routine laboratory use very difficult
27, 28
.
1.4.2 MS instrumentation
A mass spectrometer measures the mass to charge ratio in the gas phase of ionized
analytes. A complete MS system consists of an ion source, a mass analyzer and a detector.
Typically, the peptide or protein ions are generated in the ion source by one of two soft
29
ionization methods: electrospray ionization (ESI) and matrix-assisted laser
desorption/ionization (MALDI) 30.
In the field of proteomics, time-of-flight (TOF), ion trap, quadrupole, Fourier transform
31
ion cyclotron resonance (FTICR)-MS and Orbitrap analysers are the most frequently used
25
instruments .
1.4.2.1 Electrospray ionization (ESI)
Dole and colleagues introduced the idea of using electrospray dispersion to produce gas
phase ions from solutions in 1968. Fenn and coworkers applied this technique to
29
biomolecules and developed the modern day ESI . Further improvements were made by
Mann and coworkers in the development of nanoelectrospray ionization (nanoESI), which is
compatible with nano-flow rates for minute amount of samples thus strongly increasing the
detection sensitivity 32 .
11Electrospray generates gas phase ions with high efficiency and is extremely gentle,
enabling the study of a wide range of polar biomolecules by mass spectrometry 33. Since large
biomolecules become usually multiply charged upon ESI, these high-mass ions can still be
detected by instruments with a relatively low m/z detection range (frequently 50-2000 Da).
Furthermore, since samples are applied in solution, ESI is compatible with many types of
separation techniques such as liquid chromatography and capillary electrophoresis.
Figure 5. Schematic presentation of the electrospray ionization process. From Nielsen et al 34.
In the classical ESI process, the sample dissolved in a polar solvent such as
methanol/water flows through a fine capillary or a needle with a thin, sharp, conductive tip to
which positive or negative high voltage of several kilovolts is applied. The capillary is placed
towards the ESI source, of which the orifice is warmed up to around 150-200 degrees to aid
desolvation. The surface of the emerging liquid gets charged under such a high voltage field
and is being attracted toward the counter-charged electrode, whereas the surface tension acts
in an opposite direction. As a result of these two forces, a pointed liquid cone forms at the tip
of the capillary if the electric field is sufficiently strong. If the strength of the electric field
increases further, a thin, charged liquid jet emerges from the cone, which quickly subdivides
into smaller charged droplets to minimize its surface area29. The droplets quickly shrink by
evaporation and become unstable as the charge density on the surface increases. This leads
the droplets to blow apart into a cloud of tiny, highly charged droplets which move towards
the orifice (figure 5). As the droplets move, more and more solvent evaporates and eventually
12charged solute molecules are liberated into the gas phase of which the m/z ratio can be
determined by the mass analyzer 35.
1.4.2.2 Linear quadrupole ion trap (LTQ)
The linear quadrupole ion trap can be used in various applications such as protein
identification and quantitative differential expression analysis, biomarker studies and PTM
identification, metabolite identification and quantification, drug screening etc. The basic
construction of a commercial LTQ contains two pairs of orthogonal hyperbolic rods, each
segmented into three sections, with the length of the central section is about three times larger
than the two end sections. There are two small slits along the rods at the Z axis to allow ions
to be scanned out of the trap. Two detectors are placed symmetrically towards the slits to
record the radially ejected ions. Direct current (DC) voltages are applied to three sections
allowing trapping of the ions along the axis in the central part (figure 6).
Figure 6. Basic structure of the two‐dimensional linear ion trap. Image adapted from Schwartz J C et
al., Journal of the American Society for Mass Spectrometry, 2002.
In a linear ion trap, injected ions are confined radially (x- and y- directions) by a two
dimensional radio frequency (RF) field, and axially by stopping potentials applied to the end
electrodes. The two pairs of opposing rods receive the same voltages, but neighboring rods
have opposite voltages but with the same amplitude. Along the z- axis, different DC voltages
are applied to the three sections to generate a deep electric potential well in the central section
for ion trapping in the axial direction. In addition, a supplemental alternating current (AC)
voltage across the x rods is applied to assist ion isolation, activation and ejection 36.
13Once in the trap, the ions are cooled by collision with an inert gas and fly along the z-
axis between the end electrodes, while simultaneously oscillating in the xy plane owing to the
application of the RF potential on the rods37. Importantly, the ion oscillation frequencies in
the radial and axial directions depend on the mass-to-charge ratios, so ions can be specifically
fragmented or ejected by applying the corresponding RF resonance frequencies to the trap.
The analyzer is scanned by applying RF at a fixed frequency but with variable amplitudes.
For analyzing trapped ions, the mass-selective instability principle is employed where the
primary RF voltage increases at a constant rate. Under the two-dimensional electric field the
ions are pushed and pulled in the x- and y-directions as they travel along the z-axis, this
process filters out ions of all m/z values except for those of interest. The ramping of the RF
potential amplitude causes all ions to eventually exceed the resonance ejection limit and be
ejected through the exit slits in the x-rods to the detectors placed right beyond the slots, to
provide maximum sensitivity36, 38. In this way, ions with specific mass to charge ratio can be
isolated and ejected from the trap.
The LTQ can perform MS analysis alone or be connected with other analyzers as a
hybrid mass spectrometer. The mass accuracy of LTQ can be up to 50 ppm and resolution
close to 1000 (m/z 400, at an ion target value of 5000) 39. Compared to a conventional 3D ion
trap, LTQ has an increased ion storage capacity (15 times higher), improved ion trapping
efficiency (up to 70%), high detection efficiency (up to 100%) and better scan rate (3 times
faster) 36.
1.4.2.3 Orbitrap
The Orbitrap is the most recent type of ion trap mass analyzer. It uses an electrostatic field
to trap ions instead of a RF or magnet field. The Orbitrap consists of an outer barrel-like
electrode and a coaxial inner spindle-like electrode (figure 7). The outer electrode is split at
the middle allowing ions to be injected into the trap. The two electrodes generate a static,
quadro-logarithmic electrostatic field. The ions enter the electric field between the two
electrodes in a tangential way, and they are trapped because of their electrostatic attraction to
the inner electrode is balanced by centrifugal forces. The ions cycle around in circles and also
move back and forward along the axis.
14Figure 7. A cut‐away model of the orbitrap mass analyzer. From Scigelova M. et al., Proteomics, 2006.
The frequency of the oscillations of the ions is proportional to the square root of the
mass-to-charge ratio but is completely independent of the energy and the spatial spread of the
40
ions . By sensing the ion oscillation frequencies using Fourier transformation, the trap can
be used as a mass analyzer. The Orbitrap can provide very high mass accuracy (1-2 ppm) and
mass resolution (up to 200,000) 41, 42.
1.4.2.4 LTQ-Orbitrap Hybrid Mass Spectrometer
The LTQ-Orbitrap is widely used in MS-based proteomics studies. Produced by Thermo
Fisher, the LTQ-Orbitrap combines the advantages of fast scanning rate and high sensitivity
of the LTQ and the advantages of high mass accuracy, high resolution and high dynamic
range of the Obitrap 43. MS related experiments in this thesis were all performed on a LTQ-
Orbitrap.
The Linear ion trap is placed in front of the Orbitrap (figure 8), which detects MS and
n
MS with very high sensitivity but relatively low resolution and mass accuracy. Ions injected
from the ESI source at first scanned in the LTQ to determine the ion current within the mass
range of interest. This allows storing a user-defined number of ions 43. Accumulated ions can
be transferred into an RF-only quadrupole called C-trap. The C-trap accumulates and stores
31
the ions. The additional storage improves the analytical capabilities considerably . After
leaving the C-trap, the ions are accelerated to high kinetic energies and pass through a small
42
entrance aperture and enter the Orbitrap tangentially . Ions are captured in the Orbitrap by
rapidly increasing the electric field. Signals from each of the Orbitrap outer electrodes are
amplified by a differential amplifier and transformed into a frequency spectrum by fast
15Fourier transformation. The frequency spectrum is converted into a mass spectrum and
processed with Xcalibur software 43.
Figure 8. A schematic of the LTQ Orbitrap. From Scigelova M et al., Proteomics, 2006.
1.4.3 MS-based Quantitative Proteomics
Many biological processes are triggered and regulated not only by turning protein
expression on and off. Protein expression levels and their dynamic changes are also essential
for various cellular activities. Therefore, it is not always sufficient to only identify proteins to
decipher different biological phenomena. Precise quantification of protein expression and
their modifications are of great demand for biological research.
Traditionally, quantitative proteomics utilizes dyes, fluorophores or radioactivity. In
MS-based proteomics quantification, established methods can be classified as metabolic
labeling, chemical and enzymatic labeling, label free strategies and absolute quantitation 44, 45.
General MS-based quantification workflows are illustrated in figure 9.
16Figure 9. General MS‐based quantitative proteomics workflows. Boxes in blue and yellow represent
two experimental conditions. Horizontal lines indicate when samples are combined. Dashed lines
indicate points at which experimental variation and thus quantification errors can occur. Adapted
from Bantscheff M et al., Analytical and bioanalytical chemistry, 2007.
Metabolic labeling introduces a stable isotope signature into proteins at the early stages
of protein expression. Labeled proteins with stable isotopes thus have shifted m/z values in
mass spectra compared to their natural, non-labeled counterparts but are otherwise identical in
all respects. Metabolic labeling allows mixing of labeled/unlabeled samples at the level of
intact cells, which avoids accumulating systematic errors and inaccurate quantitation results.
Stable isotope labeling by amino acid in cell culture (SILAC) is currently the most widely
used method in metabolic labeling (detailed description in 1.4.3.1).
Labeling of proteins or peptides after biosynthesis is often performed by in-vitro
18
enzymatic or chemical labeling. Enzymatic labeling incorporates O molecules onto the C-
termini of peptides during protein digestion. This results for most proteases in a 4 Da mass
difference between labeled and unlabeled peptides 46, 47. Chemical labeling can be performed
both at intact protein or peptide level. Most often used methods include isotope-coded affinity
1748 49, 50
tags (ICAT) , isotope tags for relative and absolute quantification (iTRAQ) , isotope-
coded protein label (ICPL) 51 and HysTag 52.
Label free quantification is an emerging method: it compares the mass spectrometric
signal intensity of peptides precursor ions belonging to a protein or the numbers of fragment
spectra identifying a given protein between two biological samples 45. The method demands
53
very precise and accurate performance of sample-preparation and analytical systems .
Absolute quantitation can be achieved by spiking known amount of a standard reference into
samples to be analyzed. Several methods are available for different applications, such as
culture-derived isotope tags (CDITs) 54 and absolute quantitation (AQUA) 55.
1.4.3.1 Stable Isotope labeling by amino acid in cell culture (SILAC)
Using the SILAC method, based on labeling differences, up to three biological
conditions can be directly compared in a single experiment. One population is fed with
growth medium containing normal amino acids whereas the other one or two are fed with
media supplemented with amino acids labeled with certain heavy isotopes. SILAC in
combination with tryptic digestion often uses labeled arginine and lysine since trypsin
predominantly cleaves peptide chains at the carboxyl side of lysine and arginine, thus
allowing the relative quantitation of virtually all detected peptides. The most commonly used
labeled forms are 13C6-Arg, 13C615N4-Arg, 2H4-Lys and 13C615N2-Lys. 44, 56, 57.
Taking13C615N2-Lys and 13C615N4-Arg labeling as an example, the light form of cells are
grown with normal amino acids whereas the heavy labeled cells are fed with13C615N2-Lys and
13
C615N4-Arg containing medium (figure 10). This results in 8 Da and 10 Da mass shifts for
each lysine and arginine in the detected peptides, respectively. Light and heavy peptides co-
elute from liquid chromatography column (heavier peptides containing deuterium atoms elute
58, 59
earlier than their unlabeled counterparts ). The quantitation is done by comparing the
extracted ion current (XIC) of two peptides, which is proportional to the peptide abundance
(figure 11).
In a cell-line dependent manner, the SILAC accuracy can be compromised by metabolic
conversion of arginine to proline. This results in the formation of multiple satellite peak
clusters for all proline containing peptides in the labeled states and thus hampers accurate
quantitation60, 61. Solutions include empirically reducing the amount of arginine used in the
18labeling media, mathematical corrections for all proline-containing peptides62, providing extra
proline in media63, or internal correction strategies61.
Figure 10. Outline of a double SILAC experimental workflow
SILAC has proven to be a powerful quantitative method in many biological research
64
fields, such as cell signaling , protein-protein interaction 65, protein phosphorylation 66
and
67
gene function analyses . The limitation of SILAC is that it is not feasible for in vivo tissue
sample applications of large mammals.
Figure 11. (A) MS spectra of isotope clusters of a SILAC peptide pair. (B) Extracted ion chromatogram
of co‐eluted SILAC peptide pair from HPLC column. Adapted from Ong S E et al., Nature Chemical
Biology, 2005
191.4.4 Phosphoproteomics
Reversible phosphorylation of proteins is among the most widespread post-translational
modifications in eukaryotic cells. It regulates many biological processes such as signal
transduction, cell division, gene expression, molecular recognition. It has been estimated that
64, 68, 69
about 30% of the proteome is affected by phosphorylation at a given time point .
Therefore, in-depth studies on protein phosphorylation are of great importance to help us to
better understand diverse biological phenomena. However, complete phosphorylation
profiling still remains a challenge due to its frequently low stoichiometry. Often only a few
percent of the entire protein amount is present in the phosphorylated form 70.
32
Traditionally, radioactive P-labeling coupled with 2D gel-electrophoresis and Edman
sequencing was widely used to characterize phosphorylation on proteins. Western blotting
using phospho-antibodies also has high sensitivity and specificity for detecting specific
phosphorylation sites.
Nowadays, mass spectrometry has become the most powerful and popular method in the
field of phosphoproteomics. Generally, target proteins are in-solution or in-gel digested
before phosphopeptides are isolated from highly complex peptide mixtures and subjected to
mass spectrometry analysis. A comprehensive phosphorylation profiling should include the
identification of phosphorylated peptides, and the exact localization of the phosphorylated
amino acids within the peptide sequences.
The ability of performing phosphoproteomics is highly dependent on effectively
isolating phosphorylated peptides from non-phosphorylated species. There are many
developed enrichment strategies such as TiO2, strong cation exchange chromatography
(SCX), immobilized metal affinity chromatography (IMAC), ZrO2 71 etc. Projects described in
this thesis are based on TiO2 and SCX as phosphorylated peptide enrichment methods.
1.4.4.1 TiO2 phosphorylated peptide enrichment
Titanium dioxide (TiO2) beads have specific affinity to organic phosphates in solution.
Additionally, their high mechanical, chemical and thermal stability facilitates their use to
selectively enrich phosphorylated peptides from complex mixtures. Very high enrichment
72
efficiencies (> 90%) in low-complexity samples have been reported . In large-scale
phosphoproteomics, unspecific binding of non-phosphorylated peptides and acidic peptides to
20TiO2 beads become severe. Loading peptide mixture to TiO2 in organic solvent with strong
acid and “non-phosphorylated peptide excluder” as a modifier can significantly increase
enrichment selectivity. The “non-phosphorylated peptide excluders” should be able to
compete with the binding of non-phosphorylated peptides to TiO2 and 2,5-dihydroxy benzoic
acid (DHB), phthalic acid, glycolic acid, and lactic acid have proven to be efficient additives
73, 74
.
1.4.4.2 SCX phosphorylated peptide enrichment
SCX often uses silica-based materials with bonded coating of hydrophilic, anionic
polymer to selectively separate phosphorylated peptides from non-phosphorylated ones based
on their charges. Between pH 2.7-3.0, which is used in the SCX loading buffer, most tryptic
peptides carry at least two positive charges 75. Because of added negatively charged phosphate
groups, phosphorylated peptides will have reduced numbers of positive net charges, and
therefore exhibit weak or no binding to the SCX separation column, while non-
phosphorylated peptides bind usually stronger. However, the interfering effect from acidic
peptides has not yet been overcome in this strategy. SCX is a robust phosphorylated peptide
75, 76
enrichment method but with modest enrichment efficiency .
212 Aims of this study
The mitotic spindle is essential for accurate chromosome segregation during cell
division. Reversible protein phosphorylation is a key regulatory mechanism involved in the
formation and regulation of spindles. Insight into the phosphorylation network of spindle
proteins is of great interest for us to gain a better understanding of the regulation and function
of the mitotic spindle.
The Plk1 substrate identification part of this thesis aims at identifying the specific
phosphorylation substrates of a key mitosis regulator, Polo-like kinase 1, on human mitotic
spindles, and to explore the role of this kinase in the phosphorylation network of the spindle
associated proteins.
The evaluation of the use of elastase project aims at combining the use of the specific
enzyme trypsin and the low specificity enzyme elastase to achieve a better sequence coverage
for the phosphoproteomics study of human mitotic spindles.
5
223 Results
3.1 Quantitative identification of Polo-like kinase 1 (Plk1) specific
phosphorylation sites on human mitotic spindle proteins
3.1.1 Introduction
In mitosis, a eukaryotic cell separates the chromosomes into two identical sets in two
daughter cells. A series of tasks such as mitotic entry, spindle assembly, chromosome
segregation, and cytokinesis, must be carefully coordinated to ensure the error-free
distribution of chromosomes into the newly forming daughter cells. The physical separation
of the chromosomes to opposite poles of the cell is driven by the mitotic spindle, a highly
dynamic microtubule (MT)-based, protein-associated macromolecular machine. Spindle
assembly begins early in mitosis and is completed when bipolar attachment of microtubules to
77, 78
kinetochore pairs occurs . Polo-like kinase 1 (Plk1), a serine/threonine-specific kinase
first identified in Drosophila , is a key regulator of this essential mitotic process 13, 14.
79
Plk1 has diverse functions and it’s localization during mitosis is dynamic. Plk1 first
associates with centrosomes in prophase, then associates with the spindle poles and
kinetochores (KTs) in prometaphase and metaphase, is recruited to the central spindle in
anaphase, and finally accumulates at the midbody during telophase. Proteomics studies using
oriented peptide libraries suggest that the two polo-box domains (PBDs) of Plk1 are crucial
15
for its localization to cellular structures . These domains bind to specific amino acid
sequence motives which were phosphorylated by priming kinases or self-primed by Plk1, thus
providing an efficient mechanism to regulate localization and substrate selectivity in time and
space.
Plk1 has fundamental roles in early mitosis in centrosome maturation, kinetochore-
microtubule attachments and spindle assembly, but to date only a limited number of targeted
proteins and phosphorylation sites on these substrates have been conclusively identified 12, 80.
Moreover, the current understanding of the functions of these site-specific Plk1
phosphorylations is far from being complete, in part due to low abundance of the substrates,
technical difficulties in determining in vivo phosphorylation sites, and the requirement of Plk1
localization for substrate recognition in some of the cases 81.
23In recent years, mass spectrometry (MS) has become a key technology for mapping
protein phosphorylation sites. The optimization of methods for enriching and detecting
82
phosphorylated peptides have shown great promise for large scale studies . Previously, we
explored the human mitotic spindle by MS and successfully identified a large number of
83, 84
novel spindle proteins and phosphorylation sites . The development of quantitative
64, 85
methods to monitor in vivo phosphorylation changes in complex samples , represents a
unique opportunity to address the role of individual kinases in spindle function.
In this work, we performed quantitative analysis for human mitotic spindle proteins
using SILAC in combination with a phosphopeptide enrichment approach. Aimed at
improving our current experimental coverage of Plk1 substrates and gaining insight into the
direct and indirect effects of Plk1, we have analyzed how reduced Plk1 activity affects the
phosphoproteome of purified human mitotic spindles. We report the combination of the
selective inhibition of Plk1 using either an inducible Plk1 depletion shRNA cell line or the
86
small molecule inhibitor TAL . The experimental strategy was applied to analyze Plk1
phosphorylation on spindle proteins at an early mitosis stage. Furthermore, we set out to
validate the phosphorylation sites found to be down-regulated in the absence of Plk1 activity
using in vitro phosphorylation assays on peptide spots arrays.
Our approach identified novel Plk1 substrates and validated more than 100 in vivo direct
Plk1 phosphorylation sites. By probing a large set of candidate Plk1 peptides, we were able to
broaden the consensus phosphorylation motif of this kinase. Moreover, we showed that the
Plk1-dependent localization of some of the identified protein substrates to the centrosomes
and kinetochores. In addition, we could confirm that the Aurora A signaling pathway is
downstream of Plk1.
I emphasize that major biological experiments (cell culture, spindle isolation, IF, western
blotting etc.) in the Plk1 substrate identification project of this thesis were performed by Dr.
Anna Santamaria (MPIB). The results are shown here in order to confer biological relevance
to the proteomics analysis that was carried out by myself. The in vitro kinase assay
experiments were performed by Dr. Sabine Elowe (MPIB).
243.1.2 Experimental design for the comparison of the spindle
phosphoproteome between cells in the presence or absence of
Plk1
To gain insight of the phosphoproteomes of human mitotic spindles from Plk1-inhibited
cells with spindles from control cells with fully active Plk1, we developed a quantitative
phosphoproteomics strategy that combines SILAC with selective enrichment of spindle-
associated proteins by isolating human mitotic spindles (figure 12).
25Figure 12. Schematic of the experimental design for the SILAC experiments. (A) HeLa S3 cells grown
in the presence of normal or stable isotope‐labeled arginine and lysine were synchronized by Tet
induction and MA/TAL treatment, respectively. (B, C) DNA and/or spindle morphology of MA and
TAL‐treated cells (DAPI staining is shown) and shEg5 and shPlk1‐induced cells (α‐Tubulin is shown in
green and DNA was visualized using DAPI (blue)) prior to mixture and spindle isolation. (D, E) DIC
pictures of isolated mitotic spindles. Scale bar, 10 μm. (F) Analytical strategy to map phosphorylation
sites in spindle proteins. (G) Validation of direct Plk1 phosphorylation sites by peptide spotting and in
vitro Plk1 kinase assays.
To synchronize control cells to the same mitotic stage and importantly, obtain similar
microtubule arrays as in Plk1-inactivated cells, we interfered with the function of the kinesin
87
motor protein Eg5. Similar to Plk1 inactivation , Eg5 inhibition results in a prometaphase
88
arrest with a monoastral microtubule array surrounded by a ring of chromosomes .
Importantly, Plk1 localization and kinase activity were retained in Eg5-inactivated cells,
supporting the use of Eg5 as control (figure 13) 86.
Figure 13. (A) Lysates from CTL, shEg5 and shPlk1 cells treated for 36 h with Tet or left for 36 h in Tet‐
free medium, treated for the last 12 h with nocodazole, to obtain cells in the same mitotic stage.
Membranes were probed for Eg5, Plk1, BubR1, Cyclin B1 and α‐Tubulin, as loading control. (B)
DMSO, MA‐treated cells were fixed and stained for the indicated antibodies. Plk1 is shown in red and
CREST in green. DNA was visualized using DAPI (blue). Scale bar is 10 μm (experiment performed by
Dr. Anna Santamaria).
26We employed two different experimental strategies. First, we interfered with Plk1
function by lowering Plk1 protein levels. To do this systematically, we generated tetracycline
(Tet) inducible stable HeLa S3 cell lines for shRNA-mediated knockdown of Plk1 and Eg5,
as control (shPlk1 and shEg5 cell line, respectively). After shRNA induction, Eg5 and Plk1
protein levels were efficiently reduced when compared to non-induced or control cells (a
stable cell line generated with an empty vector driving non specific shRNA expression; CTL
cells) (figure 13A and 14A). Consistently, depletion of Plk1 but not Eg5 led to loss of BubR1
89-91
hyperphosphorylation (figure 13A), which was shown to be Plk1 dependent . Flow
cytometry (FACS) analysis of Tet-induced shEg5 or shPlk1 cells revealed an accumulation of
cells with a 4N DNA content, indicative of a G2/M arrest (data not shown). Concomitantly, a
striking increase in the mitotic index could be observed, in agreement with the predominant
phenotype seen upon interference with Plk1 or Eg5 87, 88.
Analysis of the protein levels of Plk1 and Eg5 upon Tet induction by MS in the
appropriate shRNA cell line provided an independent assessment for depletion efficiency in
our shRNA cell lines (figure 14B and C).
As a second complementary strategy, a chemical biology based approach using the
86
specific small molecule Plk1 inhibitor TAL was employed to directly interfere with the
enzymatic activity (rather that protein levels) of Plk1. Monastrol (MA), a small molecule
inhibitor of Eg5 92, was used to treat control cells (figure 12B and 13B).
Two independent experiments were performed for each Plk1 inactivation strategy which
served as biological replicates.
To enable accurate quantitation of the changes of phosphorylated peptide abundances by
MS, cells were labeled by growing them in medium containing either normal arginine and
13
lysine (Arg0/Lys0) or the heavy isotopic variants C6-15N4-arginine and 13
C6-15N2-lysine
(Arg10/Lys8) 44. In three of the four experiments shPlk1 or TAL-treated cells were grown in
SILAC medium supplemented with light amino acids, whereas shEg5 or MA-treated cells
were grown in SILAC medium supplemented with heavy amino acids, whereas an additional
experiment was performed under reverse labeling condition (experiment Inhibitor-1).
27Figure 14. (A) shEg5 and shPlk1 cells treated for 36 h with Tet or left for 36 h in Tet‐free medium
were fixed and stained for the indicated antibodies. Eg5 and Plk1 are shown in green and α‐Tubulin
in red. DNA was visualized using DAPI (blue). Scale bar is 10 μm. (experiment performed by Dr. Anna
Santamaria, MPIB) (B) Mass spectra representing a SILAC peak‐pair for Plk1 and Eg5, respectively,
from shEg5/shPlk1‐induced cells.
Taxol-stabilized mitotic spindles (containing KTs and centrosomes) were purified
93
essentially as previously described . To ensure minimal variation in sample handling and
processing, equal amounts of Plk1 and Eg5-depleted/inhibited cells were combined prior to
spindle isolation (figure 12A-C). Examination of the purified spindles by differential
interference contrast (DIC) light microscopy revealed predominantly monopolar spindles
(Figure 12D, E), as expected, largely free of other cellular structures.
28You can also read