Population Dynamics of CD4+ T Cells Lacking Thy-1 in Murine Retrovirus-Induced Immunodeficiency Syndrome (MAIDS)
←
→
Page content transcription
If your browser does not render page correctly, please read the page content below
Published in : Scandinavian Journal of Immunology (1994), vol. 39, pp. 216-274.
Status : Postprint (Author’s version)

Population Dynamics of CD4+ T Cells Lacking Thy-1 in Murine Retrovirus-
             Induced Immunodeficiency Syndrome (MAIDS)

M. P. Moutschen, S. Colombi, M. Deprez, F. Van Wijk, C. Hotermans, M.-T. Martin, R. Greimers & J.
Boniver
Department of Pathology, University of Liège, Liège, Belgium

Increased numbers of CD4+ Thy-1- cells have been described in the spleen (SP) of mice with retrovirus-induced
immunodeficiency (MAIDS). Since this phenotypic abnormality might have considerable functional importance,
the expansion of the CD4+ Thy-1- subset in MAIDS was characterized further. CD4+ Thy-1- and Thy-1+ T-cells
from infected mice expressed similar densities of CD3 and TCR α/β. In contrast, the Thy-1- subset was
uniformly C'D44hi, even early in the disease when part of Thy-1+ cells were still CD44lo, The emergence of CD4+
Thy-1- cells occurred first in SP and lymph nodes and was observed later in thymus. The important fraction of
CD4+ cells lacking Thy-1 normally present in Peyer's patches was only weakly modified. Despite the major
expansion of the CD4+ Thy-1- phenotype. the proliferating fraction was not higher in this subset than in CD4+
Thy-1- cells from infected mice. Persistence after hydroxyurea administration was identical in both subsets,
indicating similar mean cell lifespans. Taken together, these results show that the major expansion of CD4+ Thy-
1- T-cells in MAIDS is not ascribable solely to increased proliferation within this subset. Phenotypic analysis
suggests that CD4+ Thy-1- cells result from the differentiation of Thy-1+ cells induced by activation signals
related to retroviral infection.

INTRODUCTION

Infection of susceptible strains of mice by viral isolates derived from the Latarjet-Duplan strain of radiation
murine leukaemia viruses such as RadLV-Rs [1,2] and LP-BM5 MuLV [3-5] causes a lymphoproliferative
disease with a profound impairment of immune responses [4-7]. T-cells participate in the lymphoproliferation
and exhibit impaired responses to mitotiens in vitro [4-7]. However, the mechanisms responsible for the
involvement of T-cells are unclear because most of the infected target cells belong to the B-cell lineage. It has
been proposed that the defective retrovirus responsible for this murine acquired immunodeficiency syndrome
(MAIDS) could act as an oncogene by stimulating a target B-cell population to proliferate [8-11]. In turn, this
subset could affect additional cell populations through the production of soluble factors [12, 13] or the
membrane expression of a viral product with superantigen-like properties [14, 15].

Abnormal expansion of a CD4+ Thy-1- phenotype has been observed in SP and LN of mice infected with LP-
BM5 MuLV [16]. This phenotypic abnormality is interesting as Thy-1 is associated with a protein tyrosin kinase
and could be involved in signal transduction [17]. Thus, its absence on an important subset of T-cells might be
related to the impairment of T-cell responses. However, al present it is not known whether these cells are the
result of either a differentiation 01 activation disorder in T-cell lineage or if they represent the retrovirus-induced
expansion of a minor CD4+ Thy-1- T-cell population which exists in SP. LN and more prominently in Peyer's
patches (PP) of non-infected mice [16, 18].

The kinetics of the CD4+ Thy-1- phenotype expansion in thymus, SP, LN, PP and liver of infected mice was
analysed. PP were considered because up to 40% of CD4+ T-cells of this lymphoid organ are Thy-1- in normal
animals [18]. Liver was studied because it has been reported that extrathymic differentiation of T-cells lacking
Thy-1 takes place in this organ in the autoimmune mice with the MRL lpr mutation [19, 20] which develop a
syndrome sharing some common features with MAIDS [21]. Also analysed was the expression of CD44 (PGP-
1), a marker associated with the memory/activated stale induced by antigen-priming [22], within CD4+ Thy-1-
versus Thy-1+ T-cell subsets early in the course of RadLV-Rs infection. Parameters defining population
dynamics such as the proportion of cells in S and G2/M phases of the cycle and meat) cell lifespan were
determined in each population. Although proliferative fraction was increased in both subsets of CD44 cells
compared to controls, the results outlined below show that the preferential expansion of the Thy-1- phenotype is
not due solely to increased proliferative activity of Thy-1 cells in any of the organs tested.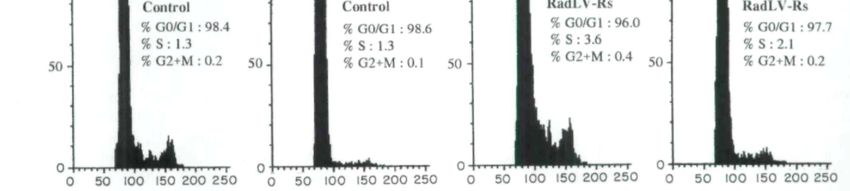
Published in : Scandinavian Journal of Immunology (1994), vol. 39, pp. 216-274.
Status : Postprint (Author’s version)

MATERIALS AND METHODS

Mice and cell suspensions

Male CS7B1/Ka (H-2b) mice were bred in the facility. Mice were injected twice i.p. at the age of 4 and 5 weeks
with 0.25 ml RadLV Duplan MuLV stock solution. Aged-matched control mice were injected twice with 0.25 ml
saline. After different time intervals (first injection, time 0). mice were sacrificed by CO2 asphyxiation. SP.
thymus. LN (inguinal, axillary, cervical, mediastinal and mesenteric) and PP were removed. Single-cell
suspensions of LN, SP, PP and thymus were prepared separately with a fitting glass homogeneizer passed
through a nylon cell strainer, washed three limes and counted on a Thoma haemacytometer. Hepatic
lymphocytes were isolated according to Watanabe et al. [23].

Virus

Extract was prepared from the lymph nodes and spleen from three mice injected 2 months previously with
RadLV-Rs extract 64. RadLV-Rs extract 64 was kindly provided by E. Legrand (INSERM 117 Bordeaux,
France) and was described previously [1,2]. Lymphoid organs were ground in PBS and centrifuged 30 min at 1.5
× 104 g. The supernatant was spun again for 30 min at 1.5 × 10⁴ g. This cell-free supernatant constituted the
extract. It was injected immediately into mice or stored in liquid nitrogen. XC plaque assay [24] was used to
measure virus litre. The virus preparation contained 1.0 × 10³ PPU of ecotropic virus/ml.

Antibodies

The MoAbs used were fluorescein isothiocyanate (FITC) conjugated anti-Thy-1.2 (30-H12). phycoerythrin (R-
PE) labelled anti-CD4/L3T4 (GK1.5) (Becton Dickinson. Erembodegem, Belgium), biotinylated anti-mouse
CD44 (IM7), biotinylated anti-mouse TCR αβ (H57 597) (Pharmingen, San Diego CA, USA), anti-CD3 MoAb
(145-2C11) (provided by Dr J. A. Bluestone University ol Chicago, Chicago, IL, USA). Purified anti-FcγRII
(CD32) (2.4G2) was purchased to Pharmingen (San Diego, CA. USA), 145-2C11 was conjugated to FITC or
biotin following published protocols [25]. A purified rat IgG2b myeloma (Gamma, Liège, Belgium) was used as
isotypic irrelevant control for IM7, the anti-CD44 MoAb. Streptavidin-PE (Dako) and streptavidin-Red613®
(Gibco BRL) were used as a second step reagent to reveal biotinylated antibodies.

Flow cytometry and cell sorting

Single-cell suspensions were prepared from lymphoid organs and stained with optimal amounts of MoAb on ice
for 20 min in PBS with 2% 8SA and 0.1 % sodium azide. Cells were washed twice and counterstained with
streptavidin-PE or slreptavidin-Red613. After additional washes, cells were analysed on a FACStar Plus® (Becton
Dickinson). Gating was performed according to forward and side scatter histograms. Data were collected and
processed using the LYSIS II software (Becton Dickinson). Anti-Thy-1.2 (30-H12) induced significant doublet
formation between Thy-1+ T-cells and B-cells or macrophages from infected mice. Therefore, cell suspensions
were preincubaled with anti-FcγRII (CD32) (clone 2.4G2) before the addition of anti-Thy-1.2 (30-H12). The
complete absence of doublets after this treatment was confirmed by FSC analysis and fluorescence microscopy.

For sorting of CD4+ Thy-1- and CD4+ Thy-1+ populations, cells were preincubaled with anti-FcγRII 2.4G2,
stained as above with appropriate labelled antibodies and sorted on a FACStar Plus® (Becton Dickinson). Gates
were set on FSC versus SSC dot plots(G1) (to eliminate dead cells, debris and non-lymphoid cells) and on FL1
(Thy-1-FITC) versus FL2 (CD4-PE) dot plots according to high level expression of CD4 and low (G2) versus
high level (G3) expression of Thy-1. Logical sorting gales were used to combine both types of gates: G1 and G2
for CD4+ Thy-1- cells; G1 and G3 for CD4+ Thy-1+ cells. Sorted cell populations were routinely 95-99% pure.

Cell cycle analysis

Cell cycle analysis was performed on isolated nuclei with the CycleTest™ kit (Becton Dickinson) according to
Vindelov [26]. Briefly, cells were treated with a trypsin buffer and RNase. Isolated nuclei were incubated for 10
min with propidium iodide at room temperature, filtered and run in the Bow cytometer. For each sample 3 × 10⁴-
5 × 10⁴ nuclei were analysed. The DNA histograms were analysed with the CellFIT™ software (Becton
Dickinson) using the 'sum of broadened rectangles' model. This analysis provided statistical estimations for the
three regions : G0G1, S and G2M of the DNA histograms. The percentage of proliferation was calculated as the
percentage of cells in S + G2M phases of the cell cycle.
Published in : Scandinavian Journal of Immunology (1994), vol. 39, pp. 216-274.
Status : Postprint (Author’s version)

Hydroxyurea treatment

HU (Sigma) was dissolved in phosphate-buffered saline (PBS) and administered i.p. at 1 g/kg body weight in
two separate injections with a 7-h interval according to the protocol of Hodgson et al. [27]. Control animals
received two i.p. injections of PBS with a 7-h interval. Mice were sacrificed al various times after HU
administration. LN were dissected and weighted. Cell suspensions were prepared from the pooled LN from three
mice in each group.

RESULTS

Early expansion of the CD4+ Thy-1- phenotype in LN and SP but not in thymus, PP or liver

As reported previously with the LP-BM5 virus [15], RadLV-Rs Duplan infection was associated with the
emergence of a CD4+ T-cell population lacking Thy-1 in the SP and LN of infected animals (Fig. 1). This
phenomenon was analysed sequentially in the LN, SP and thymus of infected mice (Fig. 2). The fraction of
CD4+ T-cells lacking Thy-1 was less than 10% in SP and LN of control animals. Their frequency was
significantly lower in the thymus (less than 3% of total CD4+ T-cells). No significant variation was observed
after mock-i.p. injection (not shown). After i.p. inoculation of RadLV-Rs. the frequency of CD4+ Thy-1- cells
increased rapidly in SP and LN and reached up to 60% of total CD4+ T cells 8 weeks after infection. This
frequency remained around 60% at least until week 15 after viral inoculation (not shown). In contrast with SP
and LN, the appearance of CD4+ Thy-1- T-cells in the thymus of infected animals was much slower during the
first weeks of infection. The process accelerated dramatically in the thymus later in the disease (week 7) and a
frequency similar to that observed in SP and LN was reached eventually. To rule out the participation of a
depletion of CD4+ Thy-1+ cells in the relative increase of Thy-1- cells, the total cell numbers were calculated in
LN CD4+ Thy-1+ and Thy-1- cells. After RadLV-Rs inoculation, the absolute number of cells increased
dramatically in each subset of CD4+ T-cells and reached a plateau around week 8 post-inoculation. At this time
point. the total number of cells was roughly equal in both subsets. Afterwards, the number of CD4+ Thy-1- T-
cells remained constant while CD4+ Thy-1+ cells decreased slowly (unpublished observations). Compared to
their respective values in controls, CD4+ Thy-1- T-cells displayed the more important expansion since their total
number was increased 70-100-fold. In contrast the number of CD4+ Thy-1+ T-cells was increased only 8-12-fold
(Table 1).

Table 1. LN CD4+ T-cell subsets in MAIDS. Total cell numbers
                                  Week 4                                Week 8
                    CD4+ Thy-1+         CD4+ Thy-1-        CD4+ Thy-1+        CD4+ Thy-1-
Controls                 55.7               3.9                49.6               4.5
RadLV-Rs             153.8 ± 6.2         43.9 ± 6.8         341.4 ±51.8       350.5 ± 86.6
The data ( × 106) represent the LN CD4+ T-cell numbers of two pooled control mice and the means ± SD of groups of live infected mice
analysed individually.

Fig. 1. Presence of CD4+ Thy-1- cells in a RadLV-RS infected mouse. LN cells from (A) a mock-injected control
and (B) a RadLV-RS infected mouse (8 weeks post-infection) were stained with FITC labelled anti-Thy-1.2 and
PE-labelled anti-CD4. In the control mouse CD4+ Thy-1 - cells represent 2.22% of lymphocytes or 6.30% of
CD4+ cells; in the infected mouse they represent 19.48% of lymphocytes or 49.92% of CD4+ cells. Similar dot
plots were obtained with LN cells from all mice infected with RadLV-Rs (five mice in each group) and in several
independent experiments.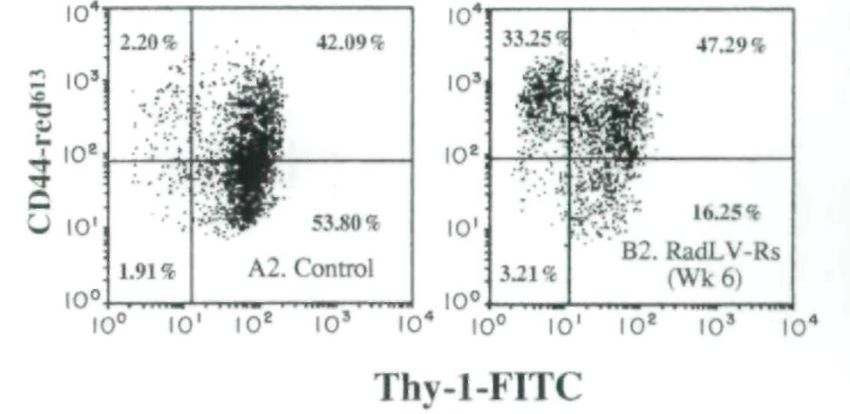
Published in : Scandinavian Journal of Immunology (1994), vol. 39, pp. 216-274.
Status : Postprint (Author’s version)

Fig. 2. Changes in the frequency of CD4+ cells lacking Thy-1 during the course of RadLV-Rs infection. These
results represent the mean frequency (±SD) of CD4+ Thy-1- cells within the total CD4+ population in (-▲-) LN,
(-○-) SP and (-●-) thymus of infected mice (n = 5). No variation was observed in mock-injected controls (not
shown).

Fig. 3. CD4+ Thy-1- T-cells in the Peyer's patches of infected animals. PP and LN lymphocytes were stained with
FITC labelled anti-Thy-1.2 and PL-labelled anti-CD4. The results express the proportion of Thy-1- cells within
the CD4+ T-cell population of (-○-) control PP, (-□-) control LN. (-■-) RadLV-Rs infected PP, (-■-) RadLV-Rs
infected LN and represent mean±sd from groups of three mice.

In separate experiments, the frequency of CD4+ cells lacking Thy-1 in the Peyer's patches (PP) of RadLV-Rs
infected animals and controls was analysed (Fig. 3). Consistent with previous findings [18], normal mice had a
high frequency of CD4+ Thy-1- lymphocytes (around 40% of CD4+ cells). In contrast with observations in SP
and LN where the relative frequency of CD4+ lacking Thy-1 increased up to six-fold, there was only a minor
increase of this frequency in the PP of infected mice where the proportion of CD4+ T-cells lacking Thy-1 always
remained less than 50% after RadLV-Rs inoculation (Fig. 3), A similar picture was found in the liver where 20-
30% of CD4+ cells were Thy-1- in control mice. There was no early increase of this subset in infected mice
(unpublished observations), furthermore the fraction of cells with an intermediate expression of TCR α/β did not
increase in the infected animals (unpublished observations).

Identical expression of CD3 and TCR α/β in Thy-1+ and Thy-1- T-cells of infected mice. Increased expression of
CD44 by CD4+ Thy-1- T-cells

T-cells lacking Thy-1 have been found with low surface expression of CD3 and TCR α/β in mice with the
MRL/lpr and gld mutations [19, 20], so three-colour staining was used to compare the expression of these
differentiation markers on CD4+ Thy-1+ and Thy-1- T-cells from RadLV-Rs infected mice (Fig. 4). No difference
was found between both subsets of CD4+ cells in infected mice confirming the belonging of CD4+ Thy-1-
lymphocytes to the T-cell lineage and arguing against an extrathymic differentiation pathway.
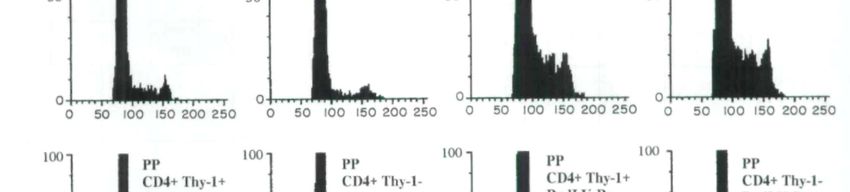
Published in : Scandinavian Journal of Immunology (1994), vol. 39, pp. 216-274.
Status : Postprint (Author’s version)

However the CD4+ Thy-1- subset displayed a particular pattern of CD44 expression. Murine antigen-primed T-
lymphocytes can be identified phenotypically by high-level surface expression of CD44 (Pgp-1) [22]. The
expression of CD44 was compared in LN CD4+ Thy-1- and Thy-1+ T cells during the first weeks of the infection
(Fig 5). In control animals, the minor CD4+ Thy-1- subset resembled other CD4+ lymphocytes as to the
expression of CD44. On the contrary, most CD4+ Thy-1- lymphocytes from infected mice expressed a high
density of CD44 even in the early stage of the infection when a significant fraction of CD4+ Thy-1+ cells was
still CD44lo( Fig. 5).

Fig. 4. Expression of TCR α/β (A, C, E) and CD3 (B, D, F) by LN CD4+ T-cells (A, B) from a control mouse and
CD4+ Thy-1+ (C, D) versus Thy-1- cells (E, F) from a RadLV-Rs infected mouse (week 6). LN cells were stained
with PE-labelled anti-CD4, FITC-labelled anti-Thy-1.2 and biotinylated anti TCR α/β or anti-CD3 revealed with
streptavidin-red613. Gates are set on CD4+ cells for the control mouse and on CD4+ Thy-1+ and CD4+ Thy-1-
cells lor the infected mouse. The light histograms are shown as internal negative controls and represent anti-
CD3 or anti-TCR α/β reactivity within gated CD4+ Thy-1- cells (presumed to be mostly non T-cells) from the
same mice.
Published in : Scandinavian Journal of Immunology (1994), vol. 39, pp. 216-274.
Status : Postprint (Author’s version)
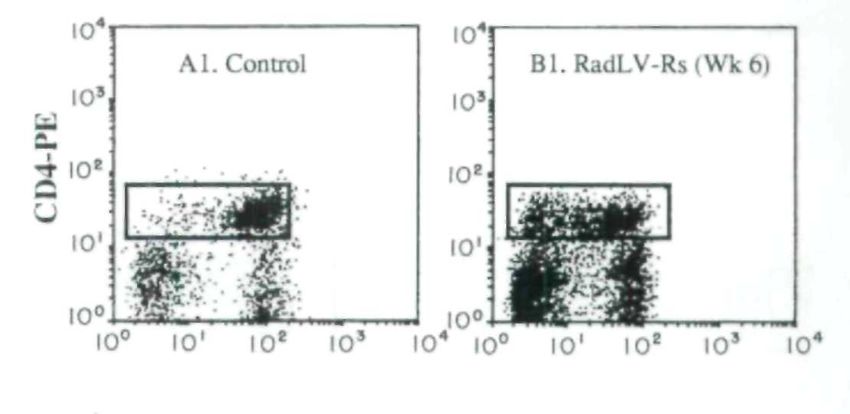
Fig. 5. High-level surface expression of CD44 by LN CD4+ Thy-1- T-cells from RadLV-Rs infected mice. LN cells
from (A) a control mouse and (B) a RadLV-Rs infected mouse (6 weeks post-infection) were stained with PL-
labelled anti-CD4, FITC-labelled anti-Thy-1.2 and biotinylated anti-CD44 revealed with streptavidin-red613. On
Thy-1 (FL1) versus CD4 (FL2) dot plots (A1, B1), a gate is set on CD4+ cells. Gated dot plots (i.e. CD4+ T-cells)
of Thy-1 (FL1) versus CD44 (FL3) are displayed in A2 and B2. In the infected mouse, the proportion of CD4+
Thy-1+ cells with high expression of CD44 is 74.43% while it is of 96.65% for CD4+ Thy-1- cells. In contrast, the
level of non-specific binding of an irrelevant Rat IgG2b, antibody is similar in both subsets of CD4+ T-cells (not
shown). Similar dot plots were obtained with LN cells from all mice infected with RadLV-Rs (live mice in each
group) and in several independent experiments.
Population dynamics in CD4+ Thy-1+ and Thy-1- T-cells
The faster expansion of CD4+ Thy-1- compared to CD4+ Thy-1+ T-cells in the LN of infected mice prompted
investigation into whether this difference could be ascribed to a higher in situ proliferative activity in the Thy-1-
subset from LN. Both CD4+ T-cell subsets from infected mice between week 4 and week 6 after inoculation and
controls were sorted by flow cytometry (Table 2). After sorting, nuclei were isolated and DNA was stained with
propidium iodide. In control mice, the frequency of LN CD4+ cells in S + G2M phases of the cycle (referred here
as proliferating cells) was always less than 5%. In infected mice, the proliferative activity displayed by LN CD4+
T-cells was increased with a frequency of S + G2M cells ranging between 5 and 10% (Table 2). Nevertheless
despite their 10-fold higher expansion, CD4+ Thy-1- T-cells from infected mice did not display an increased
proliferative fraction compared to the CD4+ Thy-1+ cells from the same mice (Table 2). Also compared to rule
out the existence of a more important cycling pool outside the LN were the proliferative fractions of both CD4+
subsets in LN. SP and PP. For both CD4+ subsets of infected mice, the proliferating fractions were comparable in
SP and LN while lower values were found in the PP (Fig. 6). Moreover, cell cycle analysis on unsorted
thymocytes failed to reveal an early increase in proliferative fraction after infection (Table 3).
Table 2. LN CD4+ T-cell subsets in MAIDS. DNA distribution
S G2/M
Controls
total CD4f 2.71 ± 1.34% 0.26 ± 0.23%
RadLV-Rs
CD4+ Thy-1+ 7.25 ± 0.52% 0.82 ± 0.41%
CD4+ Thy-1- 6.10 ± 1.56% 0.71 ± 0.14%
The results represent means + SD from three mice between week 4 and week 6 post-inoculation and three controls.Published in : Scandinavian Journal of Immunology (1994), vol. 39, pp. 216-274.
Status : Postprint (Author’s version)
Table 3. DNA distribution in thymocytes
S G2/M
Controls I2.62 ± 1.89% 5.50 ± 0.99%
RadLV-Rs 14.5.1 ± 2.25% 3.20 ± 0.72%
The results represent means + SD from groups of three mice (week 4 post-inoculation) and three controls.
Next, it was hypothesized that the Thy-1- T-cell subset might have an increased life-span which is responsible for
their accumulation to the LN of infected animals. To estimate the mean cell life-span, the rates of decay in LN T-
cell numbers after two consecutive injections of HU at 7 h-inlerval were studied . This treatment is expected to
kill all dividing cells in a few hours. Therefore, cell depletion observed afterwards reflected cell turnover in the
absence of replenishment from the cycling pool [26, 29]. Accordingly, 1 h after administration, HU had no effect
on the number of CD4+ T-cells in the LN of normal mice (Fig. 7). A significant depletion (around 30%) was
observed at 24 h and 72 h after HU administration. In infected mice at week 8 post-inoculation, CD4+ Thy-1+ and
CD4+ Thy-1- populations displayed an important depletion with a maximum around 60% al 72 h. This indicated
that for both CD4+ subsets of infected animals, the turnover was increased compared to normal CD4+ Thy-1+ T-
cells from non-infected animals. However, no major difference was seen between the depletion patterns of CD4+
Thy-1+ and CD4+ Thy-1- T-cells of infected mice.
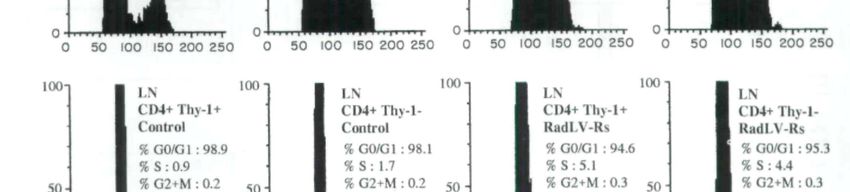
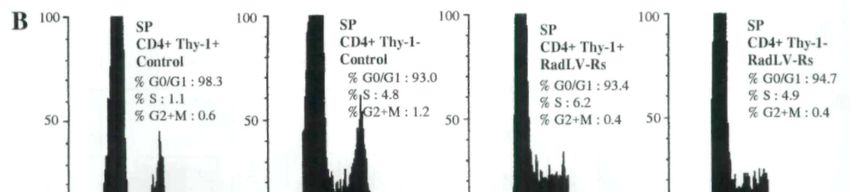
Fig. 6. DN A distribution in CD4+ Thy-1+ and CD4+ Thy-1- T-cells in different lymphoid organs of infected mice.
SP, LN and PP cells from a mock-injected control and a RadLV-RS infected mouse (6 weeks post-infection) were
stained with FITC labelled anti-Thy-1.2 and PE-labelled anti-CD4. CD4+ Thy-1+ and CD4+ Thy-1- T-cells were
sorted by flow cytomelry. (A) shows dot plots and sorting gates for LN cells before and after FACS. Ail dot plots
are made with ungated data. The sorting gate set on CD4+ Thy-1- cells is slightly larger for the control mouse
than for the infected animal to increase recovery. Purity is calculated according to the logical gales (see
Materials and Methods). Similar sorting gates were used for SP and PP (not shown). (B) Isolated nuclei from
the sorted cells were stained with propidium iodide. Data were analysed with the CELLFIT software. The
histograms were normalized using the same software.Published in : Scandinavian Journal of Immunology (1994), vol. 39, pp. 216-274. Status : Postprint (Author’s version) Fig. 7. Effects of HU on the total number of (A) (-●-) CD4+ T-cells in the LN of control mice and (B) (-○-) CD4 ' Thy-1- and (-■-) CD4+ Thy-1+ T-cells in the LN RadLV-Rs infected mice (7 weeks post-infection), The results represent the differences between the total numbers of cells ofeach subset in the LN of HU-treated mice and the corresponding numbers in PBS-treated mice at various intervals. The depletions are expressed as a percentage of control values (i.e. total cell numbers in LN of PBS-treated mice). A pool of three animals per experimental group was used. Similar results were observed in three independent experimenls.
Published in : Scandinavian Journal of Immunology (1994), vol. 39, pp. 216-274.
Status : Postprint (Author’s version)

DISCUSSION

The expansion of CD4+ T cells lacking Thy-1 is an intriguing feature of retrovirus-induced murine
immunodeficiency syndrome] 15]. The experiments reported here pun ide several new observations with regard
to the development of this cell subset in MAIDS.

(1) CD4+ Thy-1- T-cells are absent in the thymus of normal mice and display a delayed appearance in the thymus
of infected animals compared to peripheral lymphoid organs. Therefore, the expansion of CD4+ Thy-1- T-cells in
MAIDS is unlikely to result directly from a differentiation event involving immature T-cells of thymic origin.

(2) CD4+ Thy-1- T-cells in MAIDS display the same surface density of TCR α/β and CD3 than CD4+ Thy-1+ T-
cells. Furthermore these cells are not amplified in the liver of infected mice. These results contrast with the
extrathymic differentiation pathway of T-cells lacking Thy-1 described in other models [20, 31].

(3) The important CD4+ Thy-1- T-cell population normally present in the PP is only weakly modified during
MAIDS. Furthermore, the proportion of cycling cells is not higher in CD4+ Thy-1- than in CD4+ Thy-1+ T-cells
whatever the organ considered (PP, LN and SP). This could mean that the preferential amplification of the CD4+
Thy-1-phenotype does not result from the expansion of the preexisting Thy-1- pool due to a higher sensitivity to
retrovirus-dependent mitogenic signals.

(4) Compared to Thy-1+ T cells, CD4+ Thy-1- T-cells uniformly present a primed/memory CD44hi phenotype
even in the early stages of the infection.

(5) CD4+ Thy-1- and Thy-1+ T-cells of infected animals display similar persistence after arrest of cell production
by HU treatment, indicating comparable lifespans in both subsets. Together with the similarity in proliferating
fractions and the fact that invariably, the same ratio is reached between CD4+ Thy-1- and Thy-1+ T-cells in all
organs tested, these data indicate close relationships between both CD4+ subsets in MAIDS.

The results suggest that at least part of the expansion of the CD4' Thy-1- phenotype is due to differentiation of
Thy-1+ cells. Furthermore, the uniform CD44hi phenotype of CD4+ Thy-1- cells in MAIDS indicates that such a
differentiation could be associated with TCR triggering. In non-infected mice, it is very likely that most CD4+
Thy-1- cells derive from CD4+ Thy-1+ T-cells rather than from an extrathymic differentiation pathway since
CD4+ Thy-1- T-cells are absent in the PP and in the other lymphoid organs of nude mice [18]. Furthermore a
large proportion of PP CD4+ Thy-1+ T cells lose Thy-1 expression after in vitro activation with anti-CD3 MoAb
[18]. In the study described here several attempts to demonstrate the spontaneous loss of Thy-1 in vitro by sorted
Thy-1+ T-cells from infected animals were unsuccessful (data not shown). This may be due to the poor survival
of the lymphocytes from infected animals in cultures longer than 48-72 h.

The molecular mechanisms responsible for the loss of Thy-1 expression in MAIDS have yet to be defined.
Modulation of Thy-1 epitopes due to modified glycosylation patterns could be involved since glycosylation of
Thy-1 has been shown to change with T-cell differentiation [32]. The lack of Thy-1 expression might result also
from activation of phosphalidylinositol-specific phosopholipase C or defective synthesis of GPI-linked
membrane proteins. However, this is unlikely since Holmes et al. found a normal expression of Ly-6A/E,
another GPI-linked surface molecule on CD4+ Thy-1- T-cells in MAIDS [16], The uniform memory/activated
phenotype of CD4+ Thy-1- T-celts in MAIDS suggests a possible relationship with sustained polyclonal T-cell
activation observed in the syndrome. Interestingly. CD4+ Thy-1- T-cells have been observed in the LN germinal
centers of autoimmune NZB mice [33]. It remains to be established whether any chronic stimulation of T-cells in
vivo can result in the development of this phenotype or if abnormal signals occurring in MAIDS are specifically
involved. Kanagawa et al. showed recently that the Du5H-encoded superantigen expressed on infected B-cells
elicits different TCR-mediated signals than nominal antigens [34].

Appearance of immunodeficiency in RadLV-Rs infected mice occurred simultaneously with the emergence of
the CD4+ Thy-1- phenotype (data not shown). Since Thy-1 is associated with the p60fyn tyrosine kinase on T-
cells [17], it is possible that the loss of Thy-1 expression is associated with functional abnormalities of CD4+ T-
cells. It has been proposed that human CD7 is a functional homologue of murine Thy-1 135]. The emergence of
activated CD4+ CD57+ T-cells lacking CD7 expression has been described recently in patients infected with HIV
[36]. Interestingly, these cells are refractor) to TCR stimulation [36] and could participate in the dysregulation of
the TH1-TH2 cytokine network in AIDS (M. Debré et al. unpublished observations). As similar disorders of the
cylokine secretion patterns have been described in MAIDS [13], it is believed that the loss of Thy-1 by CD4+
cells could constitute a useful phenotypic marker for the study of retrovirus-induced functional disorders of T-
Published in : Scandinavian Journal of Immunology (1994), vol. 39, pp. 216-274.
Status : Postprint (Author’s version)

cell differentiation.

ACKNOWLEDGMENTS

The authors wish to acknowledge Ms Gaby Zeimersand Mrs Elizabeth Franzen-Detroz for their expert technical
assistance. Michael A. Bookman, Vincent Geenen, Marc Baudrihuye, Nicole Schaaf-Lafontaine and Marie-Paule
Defresne for their remarks and comments on the manuscript and Dr E. Legrand for providing the virus. This
work is supported in part by the Foundation for Scientific Medical Research (FRSM) and the Centre
Anticancéreux près l'Université de Liège. MM is supported by grants from Télévie and the Fonds National de la
Recherche Scientifique (FNRS). SC is supported by grants from the Institut pour l'encouragement de la
Recherche Scientifique dans l'Industrie et l'Agriculture (IRSIA), RG and MTM are supported by grants from
Télévie.

REFERENCES

1 Mistry PB, Duplan JF. Propriétés biologiques d'un virus isolé d'une radioleuccmte C57BL. I. Premiers passages du virus natif. Hull Cancer
1973;60:287-300.

2 Legrand L. Daculsi R, Duplan JF. Characteristics of the cell populations involved in extra-thymic lymphosarcoma induced in C57BL/6
mice by RadLV-Rs. Leukemia Res 1981;5:223-33.

3 Haas M. Resheef T. Non-thymic malignant lymphomas induced in C57BL/6 mice by cloned dualtropic viruses isolated from
hemalopoietic stromal cell lines. Eur J Cancer 1980;16:909-17.

4 Mosier DE, Yetter RA. Morse III HC. Retroviral induction of acute lymphoproliferative disease and profound immunosuppression in adult
C57/BL6 mice. J Exp Med 1985:161:766-84.

5 Morse III HC. Yetter RA. Via CS et al. Functional and phenotypic alterations in T cell subsets during the course of MAIDS, a marine
relrovirus-induced immunodeficiency syndrome. J Immunol 1989;143:844 50.

6 Cerny A. Hügin AW. Holmes K. Morse III HC. CD4+ T cells in murine acquired immunodeficiency syndrome: evidence for an intrinsic
defect in the proliferative response to soluble antigen. Eur J Immunol 1990:20:1577-81.

7 Fitzpatrick EA. Bryson JS, Rhoads C, Kaplan AM, Cohen DA. T-deficient transmembrane signaling in CD4+ T cells of retroviral-induced
immune-deficient mice. J Immunol 1992:148;3337-84.

8 Chattopadhyay SK, Morse III HC. Makino M. Ruscetti SK, Hartley JW. Defective relrovirus is associated with induction of murine
retrovirus-induced immunodeficiency syndrome. Proc Natl Acad Sci USA I989;86:3862-6

9 Aziz DC. Hanna Z. Jolicoeur P. Severe immunodeficiency induced by a defective murine leukemia virus. Nature 1989:338:505-8.

10 Huang M, Simard C, Jolicoeur P. Immunodeficiency and clonal growth of target cells induced by helper-free defective relrovirus.
Science 1989;246;1614-17.

11 Huang M, Simard C, Kay DG. Jolicoeur P. The majority of cells infected with the defective murine AIDS virus belong to the B-cell
lineage. J Virol 1991:65:6562-71.

12 Jolicoeur P. Murine acquired immunodeficiency syndrome (MAIDS): an animal model to study the AIDS pathogenesis. FASEB J
1991:5:2398-405.

13 Gazzinelli RT. Makino M, Chattopadhyay SK. Snapper CM, Sher A, Hügin AW. Morse III HC. CD4+ subset regulation in viral
infection. Preferential activation of Th2 cells during progression of retrovirus-induced immunodeficiency in mice. J Immunol 1992:148:182-
188.

14 Hügin AW. Vacchio MS. Morse III HC. A virus-encoded 'superantigen' in a retrovirus-induced immunodeficiency syndrome of mice.
Science 1991:252:424-6.

15 Kanugawa O, Nussrallah BA. Wiebanga ME, Murphy KM. Morse III HC. Carbone FR. Murine AIDS superantigen reactivity of the T
cells bearing Vβ5 T cell antigen receptor. J Immunol 1992;149:9-16.

16 Holmes KL, Morse III HC. Makino M. Hardy RR. Hayakawa K.. A unique subset of normal murine CD4+ T cells lacking Thy-1 is
expanded in a murine retrovirus-induced immunodeficiency syndrome. MAIDS. Eur J Immunol 1990;20:2783-7.

17 Thomas PM. Samelson LE. The glycophosphatidylinositolanchored Thy-1 molecule interacts with the p60fyn protein tyrosine kinase in
T-cells. J Biol Chem 1992;267:1231722.
Published in : Scandinavian Journal of Immunology (1994), vol. 39, pp. 216-274.
Status : Postprint (Author’s version)

18 Harriman GR. Lycke NY. Elwood LJ, Strober W. T lymphocytes that express CD4 and the αβ-T cell receptor but lack Thy-1.
Preferential localization in Peyer's patches. J Immunol 1990:145:2406-14.

19 Wadsworth SK. Yui K, Green I. Major histocompatibility complex class 1 specific cytolytic T cells derived form gld mice, kicking Thy-
1. CD4 and CD8. Proc Natl Acad Sci USA 1989:86:1018-22.

20 Ohteki T, Seki S. Abo T. Kumagai K. Liver is possible site for the proliferation of abnormal CD3+ 4- 8- double-negative lymphocytes in
autoimmune MRL-lpr/lpr mice. J Exp Med 1990;172:7-12.

21 Via CS, Morse III HC. Shearer GM. Altered immunoregulation and autoimmune aspects of HIV infection: relevant murine models,
Immunol Today 1990;11:250-5.

22 Budd RC, Cerottini J-C. Horvath C. Bron C, Pedrazzini T. Howe RC, MacDonald HR. Distinction of virgin and memory T lymphocytes.
Stable acquisition of the Pgp-1 glycoprotein concomitant with antigenie stimulation. J Immunol 1987:138:3120-9.

23 Watanabe H. Ohtsuka K. Kimura M. Ikarashi Y. Ohmori K. Kusumi A. Ohteki T. Seki S. Abo T. Details of an isolation method for
hepatic lymphocytes in mice. J Immunol Meth 1992:146:145-54.

24 Rowe WP, Pugh WE. Hartley JW. Plaque assay techniques for murine leukemia viruses. Virology 1970:42:1136-9.

25 Hardy RR. Purification and coupling of fluorescent proteins for use in flow cylometry In: Weir DM, Herzenberg LA, Blackwell CC, eds.
Handbook of Experimental Immunology 1986. Vol I. 4th edn. Oxford: Blackwell Scientific Publications. Ltd., 1986:31.1.

26 Vindelov LL. Flow microfluorimetric analysis of nuclear DNA in cells from solid tumors and cell suspensions. Virchows Arch (Cell
Pathol) 1977:24:227-45.

27 Hodgson GS, Bradley TR, Martin RE, Sumner S, Fry P. Recovery of proliferating haematopoietic progenitor cells after killing by
hydroxyurea. Cell tissue Kinet 1975:8:51-60.

28 Rocha B. Freitas AA. Coutinho AA. Population dynamics of T lymphocytes. Renewal rate and expansion in the peripheral lymphoid
organs. J Immunol 1983:131:2158-64.

29 Freitas AA. Rocha BB. Lymphocyte lifespans: homeostasis selection and competition, Immunol Today 1993;14:25-9.

30 Abo T, Ohteki T, Seki S. Koyamada N. Yoshikai Y. Masuda I. Rikiishi H, Kumagai K. The appearance of T cell receptor in the livers of
mice injected with bacteria. J Exp Med 1991:174:417-24.

31 Hiromaisu K. Matsuzaki G, Tauchi Y. Yoshikai Y. Nomoto K. Sequential analysis of T cells in the liver during murine listerial infection.
J Immunol 1992;149:568-73.

32 Carlsson SR. Changes in glycan branching and sialylation of the Thy-1 antigen during normal differentiation of mouse T-lymphocytes.
Biochem J 1985;226:519-25.

33 Ermak TH. Steger HJ, Wofsy D. Treatment of murine lupus with monoclonal antibody to L3T4. II. Effects on immunohistology of
thymus. spleen and lymph node. Lab Invest 1989:61:447-56.

34 Kanagawa O, Wiebenga ME, Vaupel BA. Defective T cell receptor-mediated signaling and differential induction of T cell functions by
murine AIDS virus superantigen. J Immunol 1993:150:1865-72.

35 Schanberg LE, Fleenor DE. Kurtzberg J. Haynes BF. Kaufman RE. Isolation and characterization of the genomic human CD7 gene :
structural similarity with the murine Thy-1 gene. Proc Natl Acad Sci USA 1991;88:603-7.

36 Legac E, Autran B. Merle-Beral H. Katlama C. Debre P. CD4+ CD7- CD57+ T cells: a new T-lymphocyte subset expanded during human
immunodeficiency virus infection. Blood 1992:79:1746-53.
You can also read