Screening and verification of hub genes involved in osteoarthritis using bioinformatics
←
→
Page content transcription
If your browser does not render page correctly, please read the page content below
EXPERIMENTAL AND THERAPEUTIC MEDICINE 21: 330, 2021

                     Screening and verification of hub genes involved
                          in osteoarthritis using bioinformatics
            JUNXIONG XIE1,2*, ZHIQIN DENG1*, MURAD ALAHDAL1*, JIANQUAN LIU1, ZHE ZHAO1,
      XIAOQIANG CHEN1, GUANGHUI WANG1, XIAOTIAN HU1, LI DUAN1, DAPING WANG1,2 and WENCUI LI1

                1
                 Guangdong Provincial Research Center for Artificial Intelligence and Digital Orthopedic Technology,
                              Hand and Foot Surgery Department, Shenzhen Second People's Hospital
                       (The First Hospital Affiliated to Shenzhen University), Shenzhen, Guangdong 518000;
                  2
                    University of South China, School of Clinical Medicine, Hengyang, Hunan 421001, P.R. China

                                        Received May 29, 2020; Accepted October 16, 2020

                                                     DOI: 10.3892/etm.2021.9761

Abstract. Osteoarthritis (OA) is one of the most common               PCR analysis confirmed a significant reduction in the expres‑
causes of disability and its development is associated with           sion levels of FOSL2, CDKN1A and KTN1 in OA samples.
numerous factors. A major challenge in the treatment of OA is         These genes have the potential to become novel diagnostic and
the lack of early diagnosis. In the present study, a bioinformatics   therapeutic targets for OA.
method was employed to filter key genes that may be responsible
for the pathogenesis of OA. From the Gene Expression Omnibus          Introduction
database, the datasets GSE55457, GSE12021 and GSE55325
were downloaded, which comprised 59 samples. Of these,                Osteoarthritis (OA) is a chronic degenerative disease of the
30 samples were from patients diagnosed with osteoarthritis           joints, characterized by cartilage degeneration, chronic inflam‑
and 29 were normal. Differentially expressed genes (DEGs)             mation and decreased normal joint function (1). Its clinical
were obtained by downloading and analyzing the original data          manifestations are mainly local pain and limited activity of the
using bioinformatics. The Gene Ontology enrichment and                joint (2). OA commonly occurs in females over 55 and males
Kyoto Encyclopedia of Genes and Genomes pathways were                 over 65 years of age (3). With economic improvements and the
analyzed using the Database for Annotation, Visualization             aging of the population, an increasing number of patients are
and Integrated Discovery online database. Protein‑protein             diagnosed with OA, which is now the most common cause of
interaction network analysis was performed using the Search           disability worldwide. The number of patients with OA is esti‑
Tool for the Retrieval of Interacting Genes/proteins online           mated to be >47 million in the US and is forecast to increase
database. BSCL2 lipid droplet biogenesis associated, seipin,          to ~67 million in 2030 (25% of the adult population) (4). The
FOS‑like 2, activator protein‑1 transcription factor subunit          quality of life of patients with OA is significantly lower than
(FOSL2), cyclin‑dependent kinase inhibitor 1A (CDKN1A)                that of others and poses great physical, psychological and
and kinectin 1 (KTN1) genes were identified as key genes by           financial burdens.
using Cytoscape software. Functional enrichment revealed                  Although the pathogenesis of OA has received much clin‑
that the DEGs were mainly accumulated in the ErbB, MAPK               ical attention, genetic factors associated with the development
and PI3K‑Akt pathways. Reverse transcription‑quantitative             of this disease remain elusive (5). Previously, OA was thought
                                                                      to be a heritable disease, but later studies have not determined
                                                                      any clear hereditary factors in the pathogenesis of OA (6).
                                                                      However, bioinformatics has advanced the study of OA and
                                                                      has identified specific genes involved in disease severity (7).
Correspondence to: Professors Daping Wang or Wencui Li,               Similar advances have been made in the study of rheumatoid
Guangdong Provincial Research Center for Artificial Intelligence      arthritis (8,9). While hub genes involved in OA have been
and Digital Orthopedic Technology, Hand and Foot Surgery              identified as key genes in its pathogenesis, no comprehensive
Department, Shenzhen Second People's Hospital (The First Hospital     genetic analysis has yet been performed (10). Several studies
Affiliated to Shenzhen University), 3002 Sungang West Road,
                                                                      have performed gene expression profiling of OA samples and
Shenzhen, Guangdong 518000, P.R. China
E‑mail: dapingwang1963@qq.com
                                                                      screened thousands of differentially expressed genes (DEGs)
E‑mail: 13923750767@163.com                                           using high‑throughput sequencing technology and other
                                                                      advanced techniques (11,12). However, a comprehensive anal‑
*
    Contributed equally                                               ysis of all gene data collected is still missing. An integrated
                                                                      bioinformatics approach is able to predict and identify the hub
Key words: osteoarthritis, hub genes, bioinformatics, GEO database    genes involved in ОA.
                                                                          In the present study, three datasets, GSE12021 (13),
                                                                      GSE55457 (14) and GSE55235 (11), were analyzed. Screening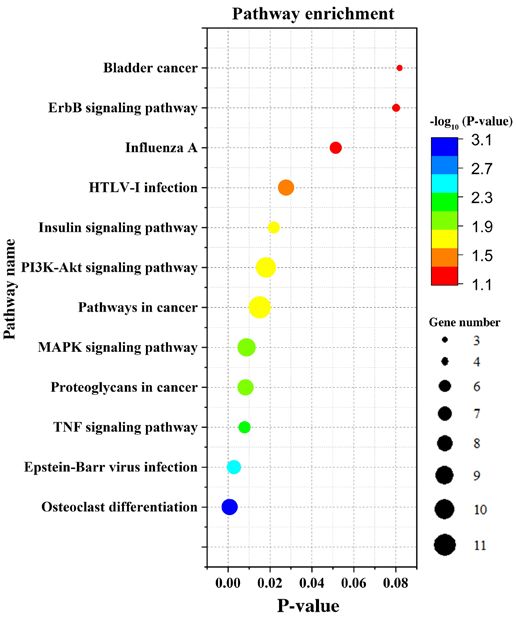
2                               XIE et al: SCREENING HUB GENES INVOLVED IN OSTEOARTHRITIS

of DEGs between OA patients and normal controls was                samples making a total volume of 10 µl. Amplification 2 min
performed. Gene Ontology (GO) and DEG pathway enrich‑              at 42˚C. Then at 4˚C, 4 µl 5X PrimeScript Buffer 2, 4 µl RNase
ment, protein‑protein interaction (PPI) network and functional     Free ddH2O, 1 µl 1PrimeScrip Enzyme Mix1 and 1 µl RT Prime
module analyses were then performed to explore the under‑          Mix was added to samples. Amplification 15 min at 37˚C and
lying molecular mechanisms of the pathogenesis of OA.              5 sec at 85˚C. A total of 20 µl cDNA was obtained by reverse
                                                                   transcription. Subsequently, 5 µl SYBR Premix Ex Taq II with
Materials and methods                                              3.5 µl dd H2O, 0.2 µl ROX, 0.5 µl cDNA, 0.4 µl PCR Forward
                                                                   Primer (10 µM) and 0.4 µl PCR Reverse Primer (10 µM) was
Microarray data. National Center for Biotechnology                 added 96‑well plates. The plates were run on the fluorescence
Information Gene Expression Omnibus (NCBI GEO) is a                quantitative PCR instrument, using the following cycling condi‑
public online repository for high‑throughput gene queries          tions: 95˚C for 30 sec, followed by 40 cycles at 95˚C for 5 sec,
and high‑throughput gene expression detection for the global       60˚C for 30 sec, 90˚C for 15 sec and 60˚C for 60 sec. The paired
research community (15). It was used in the present study          primers for the four key genes are listed in Table I. All samples
to obtain OA‑related genes and their expression values were        were compared with GAPDH. The 2‑ΔΔCq method was used to
downloaded for further analysis. The GSE12021, GSE55235            quantify the relative gene expression levels (17).
and GSE55457 gene expression profiles were downloaded
from the GEO database. Subsequently, three datasets from           Cell culture and immunofluorescence assays. The collec‑
OA patients and normal controls (GSE55235, GSE55457 and            tion and culturing of chondrocytes was performed as
GSE77298) were used for analysis; however, the data were           described in detail in previous studies by our group (18‑20).
downloaded without OA stage identification.                        Specimens of the knee joint and femoral head were collected
                                                                   from patients undergoing joint replacement surgery at the
Screening of DEGs by GEO2R. The GEO2R online database              Bone and Joint Department of Shenzhen Second People's
(https://www.ncbi.nlm.nih.gov/gds/) was used to identify           Hospital (Shenzhen, China) between December 2017 and
DEGs between OA samples and normal controls from three             October 2019. According to the patient's imageological diag‑
databases (GSE55235, GSE55457 and GSE77298); |log fold             nosis, all OA samples obtained were from patients with OA
change (FC)|>1 and P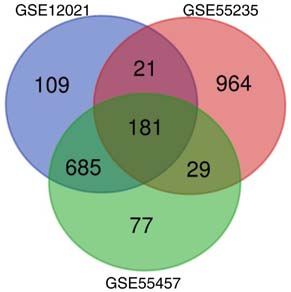
EXPERIMENTAL AND THERAPEUTIC MEDICINE 21: 330, 2021 3
Table I. Primer sequences for four hub genes (5'‑3').
Gene Forward primer Reverse primer
BSCL2 ATGGTCAACGACCCTCCAGTA GCTGACTGTCGGCATATAGGAA
FOSL2 CAGAAATTCCGGGTAGATATGCC GGTATGGGTTGGACATGGAGG
CDKN1A TGTCCGTCAGAACCCATGC AAAGTCGAAGTTCCATCGCTC
KTN1 AAATGTCTTCGTAGATGAACCCC TTTGTCAGTTTCGGTCTTCAGTT
GAPDH GGCACAGTCAAGGCTGAGAATG ATGGTGGTGAAGACGCCAGTA
BSCL2, BSCL2 lipid droplet biogenesis associated, seipin; FOSL2, FOS‑like 2, activator protein‑1 transcription factor subunit;
CDKN1A, cyclin‑dependent kinase inhibitor 1A; KTN1, kinectin 1.
antibody (rabbit anti‑Collagen II/FITC conjugated antibody;
cat. no. bs‑10589R‑FITC; BIOSS) at 4˚C overnight. As these
conjugated fluorescent dye primary antibodies demonstrated
a strong specificity, secondary antibodies were not required.
Subsequently, the cells were washed with 0.5% BSA six times
for 5 min each. Subsequently, the cells were washed by PBS six
times for 5 min each. DAPI (Thermo Fisher Scientific, Inc.) was
added for 5 min and cells were washed with PBS three times for
5 min each. Images of fluorescently labeled cells were acquired
with an LSM800 confocal microscope (Zeiss AG).
Statistical analysis. Prism 8 (GraphPad Software, Inc.) was
used to generate figures. Experimental data were statistically Figure 1. Common differentially expressed genes from three datasets. By
analyzed using SPSS 19.0 software (IBM Corp.). Student's analyzing the differential genes of GSE12021, GSE55235 and GSE55457
t‑test was used to assess differences between groups. P0.4 (Fig. 4A). By further analyzing the PPI networks, four
GO functional enrichment analysis. The functions of the modules were detected using the MCODE plugin in Cytoscape.
181 DEGs were classified using DAVID. In the GO category According to the MCODE score, key genes in four modules
MF, these DEGs were significantly enriched in protein‑DNA were screened, including BSCL2 lipid droplet biogenesis
binding, RNA binding and protein homodimerization associated, seipin (BSCL2), FOS‑like 2, activator protein‑1
activity. In addition, in the category CC, the DEGs were transcription factor subunit (FOSL2), cyclin‑dependent kinase
significantly enriched in the nucleoplasm, nucleus, cytoplasm inhibitor 1A (CDKN1A) and kinectin 1 (KTN1) (Fig. 4B‑D).
and plasma membrane. However, in the category BP, there
were fewer genes enriched compared with the other catego‑ Validation of key genes. To verify the results, the expression
ries (Fig. 2 and Table II). The upregulated DEGs were mainly levels of four key genes were determined in human articular
enriched in the extracellular space and plasma membrane. chondrocytes (Fig. 5). First, normal chondrocytes (Ctrl group)
The downregulated DEGs were significantly enriched in the and osteoarthritis chondrocytes (OA group) were obtained from
nucleoplasm, nucleus and cytoplasm, and were involved in patients undergoing joint replacement and subsequently, cells
protein binding. were cultured and stained with toluidine blue (Fig. 5A and B).
To further identify the two types of cells, immunofluorescence
KEGG signaling pathway analysis. DEGs were mainly was used to observe differences in the expression of type II
enriched in the MAPK and PI3K‑Akt signaling pathways collagen, which was decreased significantly in OA chondro‑
(Fig. 3) according to the KEGG analysis. The signaling cytes (Fig. 5C). Subsequently, the expression levels of the
pathways of downregulated DEGs were mainly enriched four key genes were determined by RT‑qPCR. The results
in osteoclast differentiation, MAPK signaling, TNF indicated that the expression level of BSCL2 in OA samples
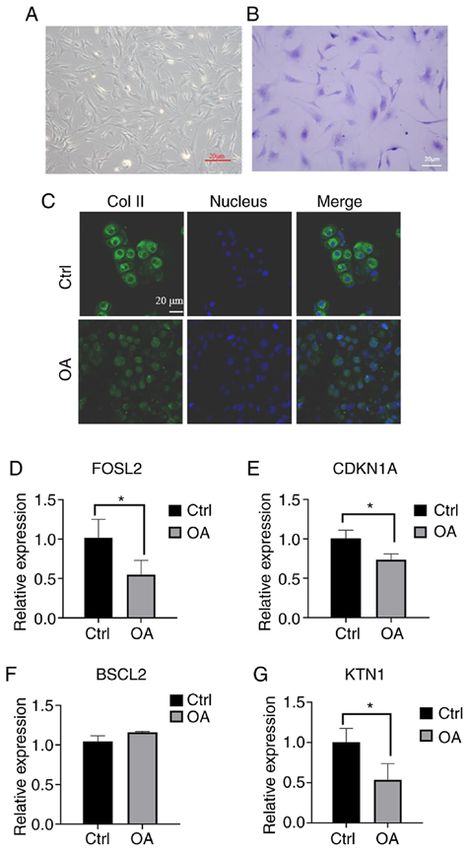
signaling, Epstein‑Barr virus infection and insulin signaling. was increased but with no significant difference (P>0.05, n=3;4 XIE et al: SCREENING HUB GENES INVOLVED IN OSTEOARTHRITIS Table II. Significant enrichment of DEGs in osteoarthritis. A, Downregulated DEGs Category Term Description Gene count P‑value BP GO:0071850 Mitotic cell cycle arrest 2 8.41x10‑2 BP GO:0045821 Positive regulation of glycolytic process 2 9.02x10‑2 BP GO:0010839 Negative regulation of keratinocyte proliferation 2 9.02x10‑2 BP GO:0070498 Interleukin‑1‑mediated signaling pathway 2 9.02x10‑2 BP GO:0097009 Energy homeostasis 2 9.64x10‑2 CC GO:0005654 Nucleoplasm 39 2.45x10‑6 CC GO:0005634 Nucleus 56 5.71x10‑5 CC GO:0005737 Cytoplasm 48 4.78x10‑3 CC GO:0005667 Transcription factor complex 5 3.59x10‑2 CC GO:0000790 Nuclear chromatin 5 3.59x10‑2 MF GO:0005515 Protein binding 80 3.11x10‑4 MF GO:0042803 Protein homodimerization activity 15 4.81x10‑4 MF GO:0044822 poly(A) RNA binding 19 6.78x10‑4 MF GO:0000166 Nucleotide binding 9 2.78x10‑3 MF GO:0003677 DNA binding 22 4.73x10‑3 B, Upregulated DEGs Category Term Description Gene count P‑value BP GO:0007155 Cell adhesion 6 4.97x10‑3 BP GO:0016525 Negative regulation of angiogenesis 3 1.00x10‑2 BP GO:0030336 Negative regulation of cell migration 3 2.25x10‑3 BP GO:0071257 Cellular response to electrical stimulus 2 2.89x10‑2 BP GO:0007399 Nervous system development 4 3.27x10‑2 CC GO:0005615 Extracellular space 11 6.34x10‑4 CC GO:0005578 Proteinaceous extracellular matrix 5 3.02x10‑3 CC GO:0005886 Plasma membrane 18 5.37x10‑3 CC GO:0005788 Endoplasmic reticulum lumen 4 9.15x10‑3 CC GO:0030133 Transport vesicle 3 1.93x10‑2 MF GO:0001786 Phosphatidylserine binding 3 2.97x10‑3 MF GO:0008201 Heparin binding 4 5.12x10‑3 BP, biological process; CC, cellular component; MF, molecular function; GO, Gene Ontology; DEG, differentially expressed gene. Fig. 5F), while the expression levels of FOSL2, CDKN1A and controls were analyzed by using GEO2R. Between the OA and KTN1 were significantly decreased. The differences between control groups, 181 DEGs were identified, including 48 upreg‑ OA and normal chondrocytes in the expression levels of the ulated and 133 downregulated genes. The upregulated DEGs four key genes were consistent with the analytical results of were mainly enriched in the extracellular space and plasma PCR (P
EXPERIMENTAL AND THERAPEUTIC MEDICINE 21: 330, 2021                                                               5

Table III. Kyoto Encyclopedia of Genes and Genomes analysis result of DEGs.

A, Downregulated DEGs

Term                                               Description                                         Gene count                                   P‑value

hsa04380                                Osteoclast differentiation                                           7                                     9.17x10‑4
hsa04010                                MAPK signaling pathway                                               9                                     1.46x10‑3
hsa04668                                TNF signaling pathway                                                6                                     2.30x10‑3
hsa05169                                Epstein‑Barr virus infection                                         6                                     4.05x10‑3
hsa04910                                Insulin signaling pathway                                            6                                     6.81x10‑3

B, Upregulated DEGs

Term                                               Description                                         Gene count                                   P‑value

hsa05164                                Influenza A                                                          3                                     8.21x10‑3

DEG, differentially expressed gene; hsa, Homo sapiens.

Figure 2. GO analysis results of hub genes. GO analysis classified the differ‑
entially expressed genes into three groups: Molecular function, biological
process and cellular component. GO, Gene Ontology.
                                                                                 Figure 3. Kyoto Encyclopedia of Genes and Genomes analysis results of
                                                                                 differentially expressed genes. The color gradient represents the P‑value; the
                                                                                 size of the dots represents the gene number.

in the development of OA. Further analysis indicated that
these DEGs were mainly enriched in the ErbB, MAPK and
PI3K‑Akt signaling pathways. These pathways are associated                       activates the Akt pathway. Apoptosis‑associated proteins are
with chondrocyte apoptosis in OA. MAPK modulates joint                           competitively inhibited by the Akt pathway. Thus, recruiting
inflammation and joint damage (27). The major pathological                       this gene may promote cell survival and inhibit cell apop‑
changes in OA are cartilage damage and poor healing (1), so                      tosis (29). There is a definite correlation between the degree of
the MAPK pathway is able to promote the aggravation of OA                        cartilage damage and chondrocyte apoptosis (26). Therefore,
or rheumatoid arthritis to exert an important role in the patho‑                 inhibiting chondrocyte apoptosis may be effective in regu‑
genesis of arthritis (26,28). Erb activates PI3K to generate                     lating cartilage degeneration during OA. Animal experiments
phosphatidylinositol‑3,4,5‑triphosphate that effectively                         have indicated that the use of MAPK inhibitors effectively
6 XIE et al: SCREENING HUB GENES INVOLVED IN OSTEOARTHRITIS Figure 4. PPI networks constructed by Search Tool for the Retrieval of Interacting Genes/proteins. (A) PPI network constructed with the upregulated and downregulated differentially expressed genes. Red nodes represent upregulated genes and blue nodes represent downregulated genes. The potential interaction networks of (B) cluster 1 containing 11 molecules and (C) cluster 2 containing 14 molecules and (D) cluster 3 containing 8 molecules identified from Molecular Complex Detection (MCODE). Three significant modules were obtained from the PPI network. PPI, protein‑protein interaction. improves inflammation and joint degeneration in mice with and inflammation during OA (32). The use of MAPK inhibi‑ OA (30), which demonstrates the potential of inhibiting MAPK tors reduces the pathological changes of OA (31). CDKN1A in OA treatment. The PI3K/Akt pathway is associated with is able to activate the AKT pathway and induce MAPK8 to TNF‑α‑induced activation of OA fibroblast‑like synoviocytes, participate in the inactivation of MAPK, further reducing which may be involved in OA pathogenesis (31). It promotes apoptosis (33,34). It has been reported that CDKN1A is signifi‑ cartilage degeneration, subchondral bone function damage cantly downregulated in the synovium of arthritis patients and
EXPERIMENTAL AND THERAPEUTIC MEDICINE 21: 330, 2021                                                   7

                                                                                physiology of chondrocytes, osteoblasts and osteoclasts (39).
                                                                                FOSL2 is the key regulator of leptin expression in fat cells (40)
                                                                                and its deficiency is able to promote obesity. In the present
                                                                                study, its low expression in OA samples was noted, which
                                                                                is consistent with obesity being a leading cause of OA (38).
                                                                                Recent studies have indicated that FOSL2 is suppressed in the
                                                                                early hypertrophy state of chondrocytes, suggesting that this
                                                                                gene is strongly associated with the early initiation of OA (41).
                                                                                Therefore, overexpressed BSCL2 and decreased expression of
                                                                                FOSL2 in OA samples promotes obesity in patients with OA,
                                                                                and their regulation may have a positive role in the prevention
                                                                                of OA. Furthermore, KTN1 is a receptor on the endoplasmic
                                                                                reticulum (42) that has an important part in adjusting protein
                                                                                biosynthesis in cells (43). A proteomics analysis of human
                                                                                mesenchymal stem cells undergoing inhibited chondrogenesis
                                                                                indicated reduced levels of KTN1 (44), suggesting an asso‑
                                                                                ciation of KTN1 with chondrogenesis enhancement. Thus,
                                                                                enhancing KTN1 may induce chondrocyte proliferation.
                                                                                    Of note, the present study had a limitation: When NCBI
                                                                                GEO was used to obtain the microarray data, the informa‑
                                                                                tion on the OA stage was unclear or the diagnosis of the OA
                                                                                classification by different doctors was biased. Therefore, it
                                                                                is difficult to ensure that all patients whose data were down‑
                                                                                loaded had the same OA classification. In order to confirm
                                                                                certain key genes that regulate the occurrence of osteoarthritis
                                                                                identified in bioinformatics screenings, more data and further
                                                                                experimental verification are still required.
                                                                                    A limitation of the present study was that cells were prepared
                                                                                using collagenase II. Further experiments are therefore required
                                                                                to determine whether this may have affected results.
                                                                                    In conclusion, bioinformatics and experimental data
                                                                                suggested that BSCL2, FOSL2, CDKN1A and KTN1 are key
                                                                                DEGs in OA compared with normal samples. Therapeutic
                                                                                targeting of these genes may positively contribute to the
                                                                                treatment and prevention of OA and consequent disability.
Figure 5. RT‑qPCR results of four key genes. (A and B) Growth of normal         One limitation of the present study is the limited amount of
chondrocytes (A) under a normal microscope and (B) staining with toluidine      collected data. Further analyses and experiments are required
blue (passage number of the cells is P1; scale bar, 20 µm). (C) Difference      prior to performing some potential targets.
in expression of collagen II (green) between normal chondrocytes and OA
chondrocytes under confocal microscopy (scale bar, 20 µm). (D‑G) Validation
of the differential expression of four hub genes between the OA group and the   Acknowledgements
normal group by RT‑qPCR. (D) FOSL2, (E) CDKN1A, (F) BSCL2 and
(G) KTN1. All samples were normalized to the expression of GAPDH and            Not applicable.
the relative expression levels of each gene were analyzed using the 2‑ΔΔCq
method. *P
8 XIE et al: SCREENING HUB GENES INVOLVED IN OSTEOARTHRITIS
Authors' contributions 12. Broeren MG, de Vries M, Bennink MB, van Lent PL,
van der Kraan PM, Koenders MI, Thurlings RM and van de Loo FA:
Functional tissue analysis reveals successful cryopreservation of
WL and DW conceived and designed the current study. JX, human osteoarthritic synovium. PLoS One 11: e0167076, 2016.
ZD and MA drafted the manuscript. JX, ZD and MA created 13. Huber R, Hummert C, Gausmann U, Pohlers D, Koczan D, Guthke R
and Kinne RW: Identification of intra‑group, inter‑individual, and
the schematic. JL, MA, ZZ, XC, GW, XH and LD interpreted gene‑specific variances in mRNA expression profiles in the rheuma‑
the data and revised the manuscript critically for important toid arthritis synovial membrane. Arthritis Res Ther 10: R98, 2008.
intellectual content. JX performed the bioinformatics analysis 14. Ye Y, Bao C and Fan W: Overexpression of miR‑101 May target
DUSP1 to promote the cartilage degradation in rheumatoid
and laboratory experiments. All authors read and approved the arthritis. J Comput Biol 26: 1067‑1079, 2019.
final version of the manuscript. 15. Barrett T, Wilhite SE, Ledoux P, Evangelista C, Kim IF,
Tomashevsky M, Marshall KA, Phillippy KH, Sherman PM,
Holko M, et al: NCBI GEO: Archive for functional genomics
Ethics approval and consent to participate data sets‑update. Nucleic Acids Res 41: D991‑D995, 2013.
16. Ashburner M, Ball CA, Blake JA, Botstein D, Butler H,
The study was reviewed and approved by the First Affiliated Cherry JM, Davis AP, Dolinski K, Dwight SS, Eppig JT, et al:
Gene ontology: Tool for the unification of biology. The gene
Hospital of Shenzhen University Health Science Center ontology consortium. Nat Genet 25: 25‑29, 2000.
Research Ethics Committee (Shenzhen, China). All patients 17. Livak KJ and Schmittgen TD: Analysis of relative gene expres‑
provided written informed consent for publication. sion data using real‑time quantitative PCR and the 2(‑Delta Delta
C(T)) method. Methods 25: 402‑408, 2001.
18. Jia Z, Zhu F, Li X, Liang Q, Zhuo Z, Huang J, Duan L, Xiong J
Patient consent for publication and Wang D: Repair of osteochondral defects using injectable
chitosan‑based hydrogel encapsulated synovial fluid‑derived
mesenchymal stem cells in a rabbit model. Mater Sci Eng C
Not applicable. Mater Biol Appl 99: 541‑551, 2019.
19. Liang Y, Duan L, Xiong J, Zhu W, Liu Q, Wang D, Liu W, Li Z
Competing interests and Wang D: E2 regulates MMP‑13 via targeting miR‑140 in
IL‑1β‑induced extracellular matrix degradation in human chon‑
drocytes. Arthritis Res Ther 18: 105, 2016.
The authors declare that they have no competing interests. 20. Duan L, Liang Y, Ma B, Zhu W and Wang D: Epigenetic regu‑
lation in chondrocyte phenotype maintenance for cell‑based
cartilage repair. Am J Transl Res 7: 2127‑2140, 2015.
References 21. Kohn MD, Sassoon AA and Fernando ND: Classifications in
Brief: Kellgren‑Lawrence classification of osteoarthritis. Clin
Orthop Related Res 474: 1886‑1893, 2016.
1. Kraus VB, Blanco FJ, Englund M, Karsdal MA and 22. Zhai KF, Duan H, Khan GJ, Xu H, Han FK, Cao WG, Gao GZ,
Lohmander LS: Call for standardized definitions of osteoar‑ Shan LL and Wei ZJ: Salicin from Alangium Chinense amelio‑
thritis and risk stratification for clinical trials and clinical use. rates rheumatoid arthritis by modulating the Nrf2‑HO‑1‑ROS
Osteoarthritis Cartilage 23: 1233‑1241, 2015. pathways. J Agric Food Chem 66: 6073‑6082, 2018.
2. Winter AR, Collins JE and Katz JN: The likelihood of total 23. Zhai KF, Duan H, Chen Y, Khan GJ Cao WG, Gao GZ, Shan LL
knee arthroplasty following arthroscopic surgery for osteoar‑ and Wei ZJ: Apoptosis effects of imperatorin on synoviocytes
thritis: A systematic review. BMC Musculoskelet Disord 18: in rheumatoid arthritis through mitochondrial/caspase‑mediated
408, 2017. pathways. Food Funct 9: 2070‑2079, 2018.
3. Jimenez G, Cobo‑Molinos J, Antich C and Lopez‑Ruiz E: 24. Wight L, Owen D, Goldbloom D and Knupp M: Pure ankle
Osteoarthritis: Trauma vs. disease. Adv Exp Med Biol 1059: dislocation: A systematic review of the literature and estimation
63‑83, 2018. of incidence. Injury 48: 2027‑2034, 2017.
4. Hootman JM and Helmick CG: Projections of US prevalence of 25. Fassbender HG: Role of chondrocytes in the development of
arthritis and associated activity limitations. Arthritis Rheum 54: osteoarthritis. Am J Med 83: 17‑24, 1987.
226‑229, 2006. 26. Hwang HS and Kim HA: Chondrocyte apoptosis in the pathogenesis
5. MacGregor AJ, Antoniades L, Matson M, Andrew T and of osteoarthritis. Int J Mol Sci 16: 26035‑26054, 2015.
Spector TD: The genetic contribution to radiographic hip osteo‑ 27. Sundarrajan M, Boyle DL, Chabaud‑Riou M, Hammaker D and
arthritis in women: Results of a classic twin study. Arthritis Firestein GS: Expression of the MAPK kinases MKK‑4 and
Rheum 43: 2410‑2416, 2000. MKK‑7 in rheumatoid arthritis and their role as key regulators of
6. MacGregor AJ, Li Q, Spector TD and Williams FM: The genetic JNK. Arthritis Rheum 48: 2450‑2460, 2003.
influence on radiographic osteoarthritis is site specific at the 28. Zhai KF, Duan H, Cui CY, Cao YY, Si JL, Yang HJ, Wang YC,
hand, hip and knee. Rheumatology (Oxford) 48: 277‑280, 2009. Cao WG, Gao GZ and Wei ZJ: Liquiritin from Glycyrrhiza
7. Moazedi‑Fuerst FC, Hofner M, Gruber G, Weinhaeusel A, uralensis attenuating rheumatoid arthritis via reducing inflamma‑
Stradner MH, Angerer H, Peischler D, Lohberger B, Glehr M, tion, suppressing angiogenesis, and inhibiting MAPK signaling
Leithner A, et al: Epigenetic differences in human cartilage pathway. J Agric Food Chem 67: 2856‑2864, 2019.
between mild and severe OA. J Orthop Res 32: 1636‑1645, 29. Park HK, Kim IH, Kim J and Nam TJ: Induction of apoptosis and
2014. the regulation of ErbB signaling by laminarin in HT‑29 human
8. Lu W and Li G: Identification of key genes and pathways in colon cancer cells. Int J Mol Med 32: 291‑295, 2013.
rheumatoid arthritis gene expression profile by bioinformatics. 30. Maudens P, Seemayer CA, Pfefferle F, Jordan O and Allemann E:
Acta Reumatol Port 43: 109‑131, 2018. Nanocrystals of a potent p38 MAPK inhibitor embedded in micropar‑
9. Duan H, Zhai KF, Khan GJ, Zhou J, Cao TY, Wu YQ, Zhou YR, ticles: Therapeutic effects in inflammatory and mechanistic murine
Cao WG, Gao GZ and Shan LL: Revealing the synergistic mech‑ models of osteoarthritis. J Control Release 276: 102‑112, 2018.
anism of multiple components in compound fengshiding capsule 31. Liu S, Cao C, Zhang Y, Liu G, Ren W, Ye Y and Sun T: PI3K/Akt
for rheumatoid arthritis therapeutics by network pharmacology. inhibitor partly decreases TNF‑ α‑induced activation of fibro‑
Curr Mol Med 19: 303‑314, 2019. blast‑like synoviocytes in osteoarthritis. J Orthop Surg Res 14:
10. Li H, Bai B, Wang J, Xu Z, Yan S and Liu G: Identification of key 425, 2019.
mRNAs and microRNAs in the pathogenesis and progression 32. Sun K, Luo J, Guo J, Yao X, Jing X and Guo F: The
of osteoarthritis using microarray analysis. Mol Med Rep 16: PI3K/AKT/mTOR signaling pathway in osteoarthritis: A narra‑
5659‑5666, 2017. tive review. Osteoarthritis Cartilage 28: 400‑409, 2020.
11. Woetzel D, Huber R, Kupfer P, Pohlers D, Pfaff M, Driesch D, 33. Kleinsimon S, Longmuss E, Rolff J, Jäger S, Eggert A,
Häupl T, Koczan D, Stiehl P, Guthke R and Kinne RW: Delebinski C and Seifert G: GADD45A and CDKN1A are
Identification of rheumatoid arthritis and osteoarthritis patients involved in apoptosis and cell cycle modulatory effects of
by transcriptome‑based rule set generation. Arthritis Res viscumTT with further inactivation of the STAT3 pathway. Sci
Ther 16: R84, 2014. Rep 8: 5750, 2018.EXPERIMENTAL AND THERAPEUTIC MEDICINE 21: 330, 2021 9
34. Yarushkin AA, Mazin ME, Yunusova AY, Korchagina KV, 40. Wrann CD, Eguchi J, Bozec A, Xu Z, Mikkelsen T, Gimble J,
Pustylnyak YA, Prokopyeva EA and Pustylnyak VO: CAR‑mediated Nave H, Wagner EF, Ong SE and Rosen ED: FOSL2 promotes
repression of Cdkn1a(p21) is accompanied by the Akt activation. leptin gene expression in human and mouse adipocytes. J Clin
Biochem Biophys Res Commun 504: 361‑366, 2018. Invest 122: 1010‑1021, 2012.
35. Gang X, Xu H, Si L, Zhu X, Yu T, Jiang Z and Wang Y: Treatment 41. He X, Ohba S, Hojo H and McMahon AP: AP‑1 family
effect of CDKN1A on rheumatoid arthritis by mediating prolif‑ members act with Sox9 to promote chondrocyte hypertrophy.
eration and invasion of fibroblast‑like synoviocytes cells. Clin Development 143: 3012‑3023, 2016.
Exp Immunol 194: 220‑230, 2018. 42. Abe E, Okawa S, Sugawara M, Watanabe S and Toyoshima I:
36. Mori E, Fujikura J, Noguchi M, Nakao K, Matsubara M, Sone M, Identification of ER membrane targeting signal of kinectin.
Taura D, Kusakabe T, Ebihara K, Tanaka T, et al: Impaired Neurosci Lett 413: 238‑240, 2007.
adipogenic capacity in induced pluripotent stem cells from 43. Ong LL, Lin PC, Zhang X, Chia SM and Yu H: Kinectin‑dependent
lipodystrophic patients with BSCL2 mutations. Metabolism 65: assembly of translation elongation factor‑1 complex on endo‑
543‑556, 2016. plasmic reticulum regulates protein synthesis. J Biol Chem 281:
37. McIlroy GD, Mitchell SE, Han W, Delibegovic M and 33621‑33634, 2006.
Rochford JJ: Female adipose tissue‑specific Bscl2 knockout mice 44. Martínez Sánchez AH, Omidi M, Wurlitzer M, Wurlitzer M,
develop only moderate metabolic dysfunction when housed at Fuh MM, Feyerabend F, Schlüter H, Willumeit‑Römer R and
thermoneutrality and fed a high‑fat diet. Sci Rep 8: 17863, 2018. Luthringer BJ: Proteome analysis of human mesenchymal stem
38. Francisco V, Perez T, Pino J, López V, Franco E, Alonso A, cells undergoing chondrogenesis when exposed to the products
Gonzalez‑Gay MA, Mera A, Lago F, Gómez R and Gualillo O: of various magnesium‑based materials degradation. Bioact
Biomechanics, obesity, and osteoarthritis. The role of adipokines: Mater 4: 168‑188, 2019.
When the levee breaks. J Orthop Res 36: 594‑604, 2018.
39. Bozec A, Bakiri L, Jimenez M, Schinke T, Amling M and This work is licensed under a Creative Commons
Wagner EF: Fra‑2/AP‑1 controls bone formation by regulating Attribution-NonCommercial-NoDerivatives 4.0
osteoblast differentiation and collagen production. J Cell International (CC BY-NC-ND 4.0) License.
Biol 190: 1093‑1106, 2010.You can also read