Proteome Analysis and Epitope Mapping in a Commercial Reduced-Gluten Wheat Product
←
→
Page content transcription
If your browser does not render page correctly, please read the page content below
ORIGINAL RESEARCH
                                                                                                                                                 published: 11 August 2021
                                                                                                                                            doi: 10.3389/fnut.2021.705822

                                               Proteome Analysis and Epitope
                                               Mapping in a Commercial
                                               Reduced-Gluten Wheat Product
                                               Mitchell G. Nye-Wood 1,2 , Angéla Juhász 1,2 , Utpal Bose 1,2,3 and Michelle L. Colgrave 1,2,3*
                                               1
                                                 School of Science, Edith Cowan University, Perth, WA, Australia, 2 Australian Research Council Centre of Excellence for
                                               Innovations in Peptide and Protein Science, Perth, WA, Australia, 3 Commonwealth Scientific and Industrial Research
                                               Organisation (CSIRO) Agriculture and Food, St Lucia, QLD, Australia

                                               Gluten related disorders, such as coeliac disease, wheat allergy and baker’s asthma
                                               are triggered by proteins present in food products made from wheat and related cereal
                         Edited by:            species. The only treatment of these medical illnesses is a strict gluten-free diet; however,
                      Anil K. Verma,           gluten-free products that are currently available in the market can have lower nutritional
   Marche Polytechnic University, Italy
                                               quality and are more expensive than traditional gluten containing cereal products. These
                        Reviewed by:
                      Francisco Barro,         constraints have led to the development of gluten-free or gluten-reduced ingredients. In
           Spanish National Research           this vein, a non-GMO wheat flour that purports to contain “65% less allergenic gluten”
                         Council, Spain
                    Knut E. A. Lundin,
                                               was recently brought to market. The present study aims to understand the alteration
           University of Oslo, Norway          of the proteome profile of this wheat flour material. Liquid chromatography-mass
                   Gianluca Picariello,        spectrometry was used to investigate the proteome profile of the novel wheat flour,
National Research Council (CNR), Italy
              Katharina Anne Scherf,           which was contrasted to a wheat flour control. Using both trypsin and chymotrypsin
     Karlsruhe Institute of Technology         digests and a combined database search, 564 unique proteins were identified with
                        (KIT), Germany
                                               99% confidence. These proteins and the specific peptides used to identify them were
                  *Correspondence:
                  Michelle L. Colgrave
                                               mapped to the wheat genome to reveal the associated chromosomal regions in the
               m.colgrave@ecu.edu.au           novel wheat flour and the mixed wheat control. Of note, several ω- and γ-gliadins,
                                               and low-molecular weight glutenins mapping to the short arm of chromosome 1, as
                    Specialty section:
                                               well as α-gliadins from the chromosome 6 short arm were absent or expressed at
          This article was submitted to
                        Food Chemistry,        lower levels in the novel wheat variety. In contrast, the high-molecular weight glutenins
                a section of the journal       and α-amylase/trypsin inhibitors were notably more abundant in this variety. A targeted
                    Frontiers in Nutrition
                                               quantitation experiment was developed using multiple reaction monitoring assays to
            Received: 06 May 2021
            Accepted: 16 July 2021
                                               quantify 359 tryptic and chymotryptic peptides from gluten and related allergenic proteins
          Published: 11 August 2021            revealing a 33% decrease of gluten protein content in the novel wheat flour sample in
                             Citation:         comparison to mixed wheat control. However, additional mapping of known allergenic
   Nye-Wood MG, Juhász A, Bose U
                                               epitopes showed the presence of 53% higher allergenic peptides. Overall, the current
   and Colgrave ML (2021) Proteome
   Analysis and Epitope Mapping in a           study highlights the importance of proteomic analyses especially when complemented
  Commercial Reduced-Gluten Wheat              by sequence analysis and epitope mapping for monitoring immunostimulatory proteins.
      Product. Front. Nutr. 8:705822.
      doi: 10.3389/fnut.2021.705822            Keywords: gluten, wheat, celiac disease, allergy, food safety, proteomics, mass spectrometry

Frontiers in Nutrition | www.frontiersin.org                                          1                                            August 2021 | Volume 8 | Article 705822
Nye-Wood et al.                                                                                                    Gluten Detection by Proteomics

INTRODUCTION                                                              exhibit a large immune response directly (25), or that conduct
                                                                          epigenetic regulation of downstream gluten protein genes (26),
Wheat products account for some 20% of dietary calories and               and have also made use of natural null-allele variants (27),
protein ingested globally (1). However, in susceptible people             CRISPR-Cas9 (28), and RNAi (29). A common phenotype is that
wheat proteins can elicit a range of health disorders including           downregulation of one or a subset of gluten protein encoding
coeliac disease (CD), wheat allergy (WA), and non-coeliac                 genes is accompanied by the compensatory upregulation of
wheat sensitivity (NCWS). The allergenic wheat proteins that              alternate storage proteins (30–34), with a change in technological
cause these adverse immune reactions have been mapped to                  properties (35). However, technology to characterize gluten
specific genes by The International Wheat Genome Sequencing               in wheat products is the subject of ongoing research (36),
Consortium (IWGSC) and collaborators (2, 3). CD is caused                 as is the targeted removal of CD reactive epitopes from
when dietary gluten reaches the small intestine of genetically            wheat (37).
predisposed individuals and stimulates an autoimmune response                 Recently, a reduced gluten product was released that claims
leading to localized damage and subsequent symptoms (4).                  to be a non-GMO wheat variety which contains “65% less
WA, as well as baker’s asthma (BA) and wheat-dependent                    allergenic gluten than traditional flour.” It is clarified that the
exercise induced anaphylaxis (WDEIA), involve an IgE-mediated             product is “developed for those with sensitive stomachs who
immune response to wheat proteins that are either ingested                don’t have gluten or wheat allergies, but who want to reduce
as food or occur via skin contact or inhalation. While these              the amount of gluten in their diets” (38) and was developed
disorders can be triggered by gluten proteins, BA typically has           using wheat prolamin box binding factor (PBF) mutants (21,
a non-gluten protein trigger (5, 6). NCWS is diagnosed when               US patents 9,150,839, 10,412,909, and 10,750,690). There are no
symptoms develop in response to cereal grain consumption, but             reports of the proteome and overall characteristics of proteins
serological testing is negative for both an autoimmune response           present in the reduced gluten flour in comparison to commercial
and the IgE-mediated allergic response, which contraindicates             wheat varieties.
CD and WA, respectively (4, 7). While the term “non-celiac                    Wheat has more than 800 genes with potentially allergenic
gluten sensitivity” has a history of use (8), NCWS better                 domains, and some 356 genes encoding reference food allergens
reflects the non-gluten wheat proteins (9) or non-protein wheat           are included in the “IWGSC v1.0 reference allergen map” (3).
components like FODMAPs (10) that elicit similar symptoms (7).            This includes gliadins (including α-, β-, γ-, and ω-subtypes) and
CD is estimated to afflict ∼0.7–1.4% of the global population             glutenins (including low molecular weight (LMW) glutenins and
(11, 12), WA some 0.33–0.75% in adults (13–15), and NCWS                  high molecular weight (HMW) glutenin subunits), as well as
being more variable but with prevalence estimated between 0.5             avenin-like proteins (ALPs), α-amylase/trypsin inhibitors (ATIs),
and 13% (16, 17). While gluten proteins are established antigens          and lipid transfer proteins (LTPs) (3). The gluten proteins contain
to those with CD and also contribute to various allergies, non-           specific epitopes that are deamidated, recognized, and presented
gluten wheat proteins are potential allergens and antigens capable        by MHC-II antigen presenting cells in the gastrointestinal
of causing WA, BA, NCWS, as well as CD (3, 6, 18).                        tract, in doing so initiating the autoimmune response that
    The only effective treatment for these wheat-related immune           characterizes CD (39). The canonical gluten proteins, the gliadins
disorders is the exclusion of wheat and related crop species from         and glutenins, together make up some 80% of the protein content
the diet. This adds to demand for “gluten free” foodstuffs that           in the wheat endosperm, and the most potent contributors to CD
resemble traditional wheat products, however wheat is replaced            toxicity are the chromosome 6D α-gliadins and chromosome 1D
by substitute ingredients that contribute starch but without              ω-gliadins (ω 1,2 sub-type), followed by the LMW glutenins and
gluten or other cereal proteins. The absence of gluten proteins,          γ-gliadin (40). It is therefore important to precisely characterize
however, can affect the consistency, texture, or taste of gluten-         protein groups and epitopes when quantifying “allergenic gluten”
free products, and the substitute ingredients typically come at a         in new products. This present study aimed to understand the
higher cost and require recipe alterations (19).                          alterations to the proteome in this reduced gluten wheat product
    Several approaches have aimed at reducing the gluten content          using LC-MS/MS in comparison to a mixed wheat control.
while retaining the health benefits of whole grains or maintaining
the unique functionality of cereal grains. One approach is to use
ethyl methanesulfonate (EMS) mutagenesis to produce random
                                                                          MATERIALS AND METHODS
mutations in genetic material by nucleotide substitution. EMS is          Sample Preparation
often used as the technology base for “Targeting Induced Local            GoodWheatTM (GW) white bread wheat flour was purchased
Lesions in Genomes” (TILLING) which has proven effective at               directly from Arcadia Bioscience (Davis, CA, USA). Replicates
targeting key wheat enzymes to improve starch composition                 of GW and of a mixed-wheat (MW) control flour sample
(20). It has been applied to wheat gluten genes (21), but is              were weighed out in quadruplicate. The MW control consisted
challenged by the sheer number of potential allergens and the             of equal parts of flour from wheat cultivars: Alsen, Xiayan,
fact that even low levels of expressed gliadins can elicit CD (22).       Pastor, Westonia, Baxter, Chara, Yitpi, AC Barrie, and Volcania;
In barley, ultra-low gluten levels (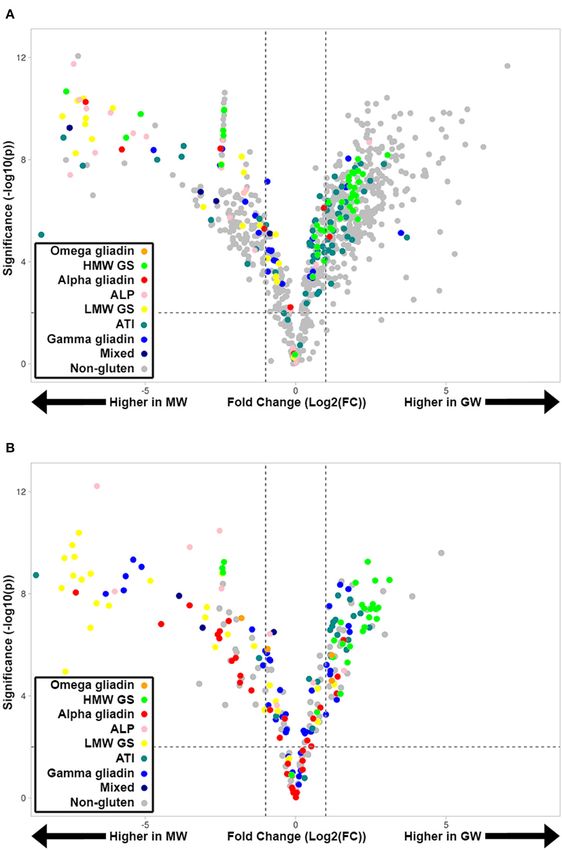
Nye-Wood et al.                                                                                                     Gluten Detection by Proteomics

was added with vortex mixing until the flour was thoroughly              system (SCIEX) and analyzed on a 6,500+ QTRAP mass
combined with the solvent. The tubes were then sonicated                 spectrometer (SCIEX). Data acquisition was achieved using
for 5 min at room temperature and incubated in a thermo-                 scheduled multiple reaction monitoring (sMRM) scanning
mixer (400 rpm, 30 min, 50◦ C). The tubes were centrifuged               experiments using a 60 s detection window for each MRM
for 15 min at 20,800 ×g. The solutions were centrifuged for              transition and a 0.3 s cycle time.
15 min at 20,800 ×g. Protein extracts (100 µL) were added                   To build the MRM method, a FASTA file containing all
to 10 kDa molecular weight cut off filters (Merck, Bayswater,            identified proteins was imported into Skyline (42), all fully
Australia). The protein on the filter was washed twice with a            tryptic peptides sized between 6 and 30 amino acids were
buffer consisting of 8 M urea in 0.1 M Tris-HCl (pH 8.5) with            selected, and repeated peptides removed. All fully chymotryptic
centrifugation for 15 min at 20,800 ×g. Iodoacetamide (25 mM;            peptides between 6 and 30 amino acids were selected in
100µL) prepared in 8 M urea and 100 mM Tris-HCl was added                independent experiments. Initially, five transitions were selected
to the filters for cysteine alkylation with incubation in the dark       per peptide in an unscheduled MRM assay and assessed on
for 20 min prior to centrifugation for 10 min at 20,800 ×g. The          both GW and MW samples. Those peptides where at least
buffer was exchanged with 100 mM ammonium bicarbonate (pH                three transitions reproducibly co-eluted at the expected retention
8.0) by two consecutive wash/centrifugation steps. The filters           time (RT) without interference were then selected for inclusion
were transferred to fresh collection tubes and digestion enzyme,         in scheduled MRM assays. These were divided across several
either trypsin or chymotrypsin (Promega, NSW, Australia),                separate transition lists, such that all data was recorded with a 60 s
was prepared as 10 µg/mL in 100 mM ammonium bicarbonate,                 detection window and maximum cycle time of 0.3 s. Precursor
50 mM calcium chloride and 200 µL was added to each filter               ions where three or more transitions had consistent RT, intensity
with incubation for 16 h at 37◦ C. The filters were centrifuged          over 1,000 cps, and a signal to noise ratio (S/N) >5 were kept and
for 15 min at 20,800 ×g. The filters were washed with 200 µL             the three most intense transitions were selected for subsequent
of 100 mM ammonium bicarbonate, and the combined filtrates               quantitative experiments. In this way, a total of 768 tryptic and
were subsequently lyophilized.                                           175 chymotryptic peptides that were unique to one protein were
                                                                         monitored, as well as 263 tryptic and 109 chymotryptic peptides
Discovery Proteomics                                                     that were present in more than one protein. Data was collected on
The digested samples were reconstituted in 100 µL of 1% formic           four technical replicates of GW and MW. Peptide peak area data
acid and the peptides (1 µL) were chromatographically separated          was exported from Skyline and analyzed (Graphpad Prism v8).
on an Ekspert nanoLC415 (Eksigent, Dublin, CA, USA) coupled                 To quantify the relative abundance of individual gluten
to a TripleTOF 6600MS (SCIEX, Redwood City, CA, USA). The                protein groups, peak areas of both unique and non-unique
peptides were desalted for 5 min on a ChromXP C18 (3 µm,                 peptides were summed. Proteins were mapped to the wheat
120 Å, 10 × 0.3 mm) trap column at a flow rate of 10 µL/min              genome using the tBLASTn function of CLC Main Workbench
of 0.1% formic acid and separated on a ChromXP C18 (3 µm,                v20.0.4 (Qiagen, Denmark), and multiple proteins mapping
120 Å, 150 × 0.3 mm) column at a flow rate of 5 µL/min. The              to the same gene were interpreted as different alleles of the
solvents used were (A) 5% DMSO, 0.1% formic acid, 94.9% water            same gene. Quantified MRM peptides were then allocated
and (B) 5% DMSO, 0.1% formic acid, 90% acetonitrile, 4.9%                to protein groups according to the proteins in which they
water. A linear gradient from 3 to 25% solvent B over 68 min             were found. Peptides occurring in proteins from multiple
was employed followed by 25–35% B over 5 min, an increase                groups were labeled Multiple/Mixed. The significance and fold
to 80% B over 2 min, a 2 min hold at 90% B, return to 3%                 change of these protein groups were graphed using VolcaNoseR
B over 1 min, and 8 min of re-equilibration. The eluent from             software (43).
the HPLC was directly coupled to the DuoSpray source of the                 A high sequence similarity between gluten proteins meant
TripleTOF 6600 MS. The ionspray voltage was set to 5,500 V; the          many peptides were observed that were common to multiple
curtain gas was set to 138 kPa (20 psi), and the ion source gas          gluten proteins, making it impossible quantify all proteins using
1 and 2 (GS1 and GS2) were set to 103 and 138 kPa (15 and                unique peptides. To overcome this, peptides quantified via MRM
20 psi). The heated interface was set to 150◦ C. The discovery           were allocated to gluten protein groups that were quantified
data files of individual technical replicates of either trypsin or       using unique peptides for GW and MW, revealing the relative
chymotrypsin digested GW and MW samples were searched                    abundance of protein groups in these samples. To do this, all
using ProteinPilot v5.0.3 with Paragon Algorithm (SCIEX)                 peptides quantified were mapped to the wheat genome (2),
against a FASTA file consisting of Triticeae tribe proteins from         and using a combination of sequence alignments, the presence
UniProt-KB [accessed 02/2021 supplemented with additional                of Pfam domains (PF13016, PF03157, PF00234), and manual
translated gene models from the IWGSC RefSeq v1 Assembly (2),            checking of the matching proteins were allocated to one of
as well as those listed on the common Repository of Adventitious         the following protein groups: α-gliadins, ALPs, ATIs, γ-gliadin,
Proteins (thegpm.org/crap)]. The FASTA file contained 817,698            HMW-GSs, LMW-GSs, and ω-gliadins. Where the proteins had
protein sequences.                                                       two or more peptides from multiple protein groups they were
                                                                         defined as “mixed.” While the ATIs and ALPs are not canonical
Targeted Proteomics                                                      gluten proteins, several of the ALPs can function as nutrient
Reduced and alkylated tryptic and chymotryptic peptides were             reservoir proteins, and the ATIs exhibit some allergenicity
chromatographically separated on an Exion LC-40AD UHPLC                  making them relevant to this investigation.

Frontiers in Nutrition | www.frontiersin.org                         3                                      August 2021 | Volume 8 | Article 705822
Nye-Wood et al.                                                                                                            Gluten Detection by Proteomics

    To quantify protein groups, the monitored peptides were             TABLE 1 | Numbers of distinct proteins and of gluten and ATI proteins identified at
mapped to the identified gluten protein sequences and non-              99% confidence in trypsin and chymotrypsin data.

gluten protein families with immune-reactive properties using                                            Trypsin         Chymotrypsin          Combined
100% sequence matching in the Motif search algorithm in
CLC Genomic Workbench v21.0.3 (Qiagen, Denmark), and                    GW total                           285                139                  360
group specific peptides were identified. Quantitative data on           GW gluten                          76                  75                  126
all chymotryptic and tryptic peptides were combined, and the              α-gliadin                         6                  11                  15
abundance of each peptide in each replicate was normalized to             ATI                              24                  16                  29
the average seen across all replicates from both GW and MW.               Avenin-like protein              11                  5                   12
Graphs were generated in Graphpad Prism v8.                               γ-gliadin                        11                  8                   18
                                                                          HMW-GS                           13                  9                   17
Gene Enrichment Analysis                                                  LMW-GS                           11                  23                  32
GO enrichment analysis was performed to test for the                      ω-gliadin                         0                  3                    3
downregulation of certain classes of proteins in GW. Those              GW non-gluten                      209                 64                  234
proteins present in both GW and MW were excluded so that only           MW total                           360                151                  448
proteins unique to GW or MW were analyzed for enriched GO               MW gluten                          73                  93                  138
terms. GW- or MW-specific proteins were then mapped to the                α-gliadin                         6                  16                  19
wheat genome using CLC Genomic Workbench v21.0.3 (Qiagen,                 ATI                              27                  19                  36
Denmark), and lists of their corresponding wheat gene identifiers         Avenin-like protein               9                  6                   10
were pasted into g:Profiler (biit.cs.ut.ee/gprofiler/gost) for GO
                                                                          γ-gliadin                        10                  16                  23
overrepresentation analysis.
                                                                          HMW-GS                            9                  9                   13
                                                                          LMW-GS                           11                  23                  32
Epitope Mapping                                                           ω-gliadin                         1                  4                    5
The peptides identified at 1% FDR in discovery proteomics
                                                                        MW non-gluten                      287                 58                  310
were searched for known CD related T cell epitopes [Ludvig
                                                                        GW and MW combined                 440                179                  541
M (44)], baker’s asthma, and wheat allergy related epitopes
collected from the Immune Epitope Database and Analysis
Resource (www.iedb.org) using the Motif search algorithm in
CLC Genomic Workbench v21.0.3 (Qiagen, Aarhus, Denmark).
                                                                        readings were analyzed according to the kit manufacturer’s
Additionally, peptides recognized by commercial ELISA kits
                                                                        instructions using cubic polynomial regression for the standard
using R5 and G12 monoclonal antibodies were also mapped to
                                                                        curve. The data analyses were performed using Microsoft Excel.
the protein and peptide sequences. Hits with 100% sequence
identity were kept in the analysis. The peptides monitored in
MRM assays were also mapped to the same protein list, and the           RESULTS
overlap between CD epitopes and the monitored peptides were
determined. Monitored peptides that contained an entire epitope         Discovery Proteomics
in their sequence were selected and quantified in GW and MW to          To identify the proteins in the GW and MW samples, combined
give a relative measure of potential immune reactivity.                 database searches were performed on the discovery proteomics
                                                                        datasets. The numbers of distinct proteins identified at 1% global
Protein and ELISA Measurement                                           false discovery rate (FDR) excluding identifications against the
Protein estimations were performed using a Coomassie dye                common contaminants (cRAP database) are summarized in
binding protein assay using Bradford reagent (Sigma-Aldrich,            Table 1. This information is generated from the reports available
St Louis, USA) following the manufacturer’s instructions.               at https://doi.org/10.25919/fr8e-k267, processed with the Protein
Measurements were made at 595 nm using a Varioskan LUX                  Alignment Template v3.002 beta (SCIEX) and manual curation.
microplate reader (Thermo Scientific, Scoresby, Australia).                 Of the 541 proteins identified in both GW and MW (Table 1),
Bovine serum albumin (BSA) standard was used in the linear              more were identified in tryptic digests (440) than chymotryptic
range 0.125–1.5 mg/mL.                                                  digests (179). Greater representation of α- and γ-gliadins and
   Diluted wheat extracts were analyzed by sandwich ELISA               LMW-GS was achieved using chymotryptic digests, while more
using the Ridascreen Gliadin (R-Biopharm, Darmstadt,                    ATIs, ALP-derived, and non-gluten proteins were identified in
Germany). The analytical protocols provided by the kit                  tryptic digests (Table 1).
manufacturer were strictly followed. Each of the samples                    Considering trypsin and chymotrypsin data together enables
was extracted using the extraction Cocktail (R7006/R7016,               a more complete comparison of the GW and MW proteomes.
R-Biopharm) recommended by the manufacturer for optimal                 Together, there were 360 distinct proteins identified in GW and
gluten extraction and measured on the using Varioskan LUX               448 in MW, with an overlap of 267. The higher number in
microplate reader (Thermo Scientific) in duplicate on a single          MW reflects the genetic diversity of the multiple wheat varieties
ELISA plate alongside the supplied standards (representing a            that are present. In GW, 126 of identified proteins were gluten-
gluten concentration of 5–80 mg/kg). The results of absorbance          like proteins (35%) and in MW this number was 138 (31%).

Frontiers in Nutrition | www.frontiersin.org                        4                                              August 2021 | Volume 8 | Article 705822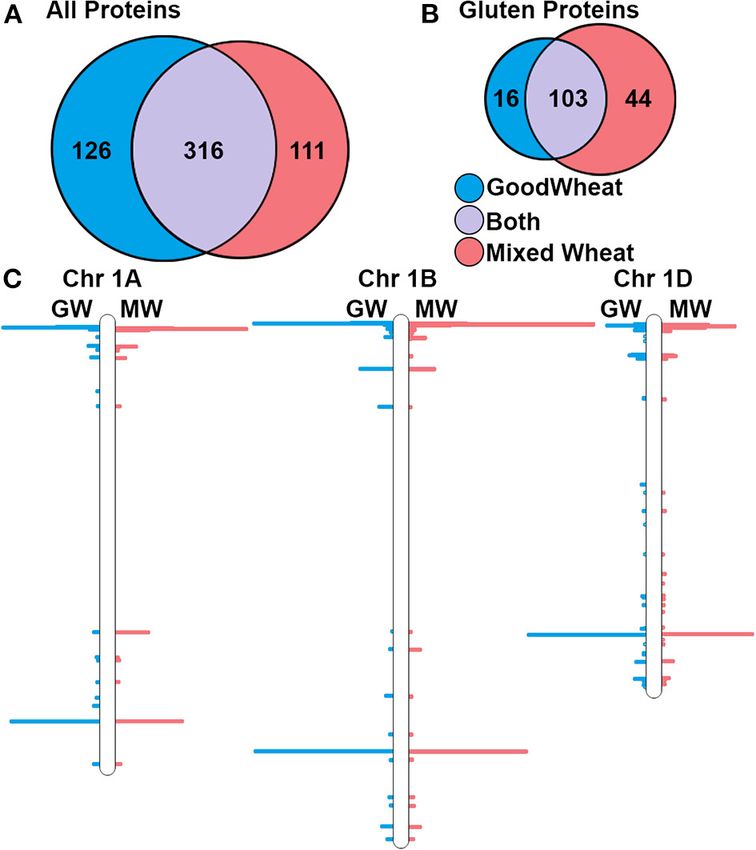
Nye-Wood et al. Gluten Detection by Proteomics
occur in multiple protein isoforms and therefore reflect the
relative abundance of more than one protein. While LC-MRM-
MS reveals peptide relative abundance, using this information
to quantify proteins by combining the constituent peptides is
confounded by both the presence of repeated peptides and
differential ionization efficiency of various peptides. We therefore
categorized peptides into groups that reflect the abundance of
major allergen types and did not quantify specific proteins. This
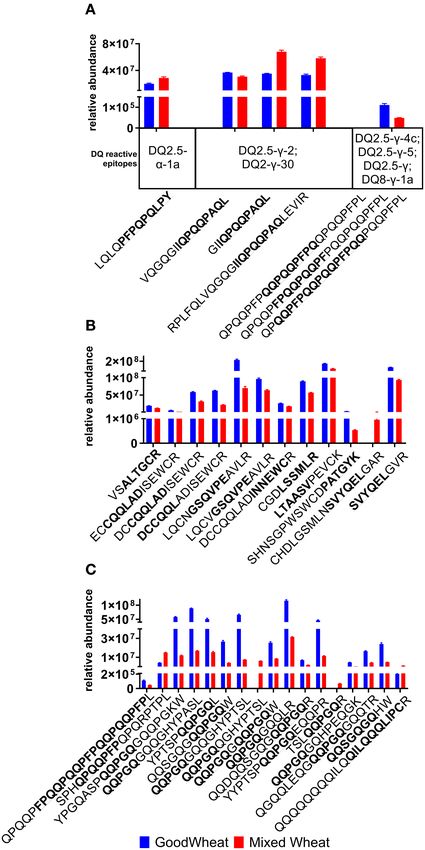
revealed the fold-change and significance of tryptic (Figure 2A)
and chymotryptic peptides (Figure 2B) peptides between GW
and MW. HMW-GS and ATI peptides tend to be higher in GW
than MW, and many tryptic “non-gluten” peptides are higher in
GW. Similarly, many LMW-GS, ALP, and α-gliadin peptides are
lower in GW than MW.
The normalized peak area for all peptides belonging to
each protein group were then summed to compare the overall
abundance of each protein group (Figure 3). Importantly, GW
showed significantly lower abundance of LMW-glutenins, α-
gliadins, and γ-gliadins, but showed an increase in HMW-
glutenins relative to MW. GW also showed significant decreases
in ALPs and increases in ATIs. Changes in net ω-gliadin
abundance were not significant. The net change in canonical
gluten content can be obtained by adding together the gliadins
and glutenins (LMW-GS, HMW-GS, α-, γ-, ω-gliadins), showing
FIGURE 1 | Summary of total and gluten-like proteins identifications at 1% that GW has 67% the relative gluten protein abundance as MW
FDR and their corresponding chromosomal locations. (A) Venn diagram
(Figure 3B).
showing the total number of proteins detected within the GW and MW
datasets. (B) Detected gluten proteins in MW and GW. (C) Locations of genes
for detected proteins on wheat chromosomes 1A, 1B, and 1D. Gene Set Enrichment Analysis
To understand the enrichment of protein classes within
the individual wheat samples, GO enrichment analysis was
performed using g:Profiler on those proteins detected with
Notably, the GW and MW proteomes share 99 (60%) of the a fold change ≥2 in MW and GW as shown in Figure 2.
165 detected gluten proteins. The numbers of proteins identified Proteins in MW showed predominant enrichment for nutrient
are compared in Figures 1A,B. To identify the chromosomal reservoir activity (GO:0045735, Figure 4A). GW proteins
position of these proteins within the wheat genome protein, showed enrichment of several classes of enzyme inhibitor and
sequences were mapped to the IWGSC wheat genome assembly regulators, as well as enrichment of proteins localizing to
version 1 (2), and the number of peptides observed per 1 million the Extracellular Region (GO:0005576) cellular compartment
base pairs (Mb) bins was determined. This revealed clusters indicating the compensation mechanism for the expression
of detected proteins in all known storage protein gene loci of non-gluten proteins. There was no enrichment of nutrient
regions of the genome, corresponding to γ- and ω-gliadins, reservoir activity (Figure 4B).
LMW-GS, and HMW-GS (3) on chromosome group 1 and α-
gliadins on chromosome group 6. Figure 1C shows the location Epitope Mapping
of the peptides detected superimposed on chromosomes 1A, To explore the potential immune reactive nature of proteins
B, and D, respectively. Though non-gluten proteins were also detected in GW compared to those in MW, peptides identified
detected across all wheat chromosomes, there were no large- in the discovery data that contained full-length immune reactive
scale chromosome region changes observed in GW and MW, epitopes were quantified (Figure 5). Known immunogenic
indicating the potential for gene expression of gluten proteins regions within quantitated MRM peptides are quantified,
in GW. including HLA-DQ T cell epitopes for CD patients (Figure 5A),
baker’s asthma epitopes (Figure 5B), and wheat allergy-related
Targeted Proteomics epitopes (Figure 5C). It should be noted that these represent
To investigate the quantitative changes across GW and MW a small subset of the known immune reactive epitopes. The
wheat samples, LC-MRM-MS-based quantitative assays were discovery analysis results (Supplementary Table 1) indicate the
developed for all peptides confidently identified in the discovery presence of additional epitopes that were not quantified with
proteomics experiment (Figure 2). A total of 189 tryptic peptides MRM. There were six complete HLA-DQ T cell epitope
and 170 chymotryptic were targeted. While 84 tryptic and 55 sequences observed in a total of 25 peptides, nine BA epitopes in
chymotryptic peptides were uniquely present, i.e., in only one 12 peptides, two WA epitopes in 16 peptides, and one WDEIA
protein isoform, many of the peptides monitored by MRM epitope in one peptide. Overall, HLA-DQ reactive epitopes in
Frontiers in Nutrition | www.frontiersin.org 5 August 2021 | Volume 8 | Article 705822Nye-Wood et al. Gluten Detection by Proteomics FIGURE 2 | Volcano plots showing quantified tryptic (A) and chymotryptic (B) peptides in GW and MW samples colored according to gluten group. A fold-change of 2 is indicated by the dashed vertical lines [Log2 (FC) = ±1]. Peptides above the horizontal dashed line have a significant change in abundance between GW and MW (p-value 2]. GW were present at 67% the relative abundance of MW. BA- The protein content of MW and GW were evaluated and reactive epitopes were also more abundant in GW at 180% that did not show a significant difference at 0.84 and 0.88 mg/mL, of MW.WA-reactive epitopes were also more abundant in GW at respectively. The gluten content was also evaluated by R5 ELISA 379% the level seen in MW. Only one wheat dependent exercise- and it was interesting to note that GW revealed a 39% higher induced anaphylaxis epitope was observed, which was notably gluten content than MW, an unexpected result given the overall lower in GW at 17.7% the level seen in MW. decrease in gluten peptides detected by LC-MS. Frontiers in Nutrition | www.frontiersin.org 6 August 2021 | Volume 8 | Article 705822
Nye-Wood et al.                                                                                                                         Gluten Detection by Proteomics

 FIGURE 3 | Relative abundance of different gluten or ATI protein groups (A). Quantitation was performed based on all detectable peptides from proteins classified to
 these groups. Error bars indicate SEM, and significant differences are indicated by asterisk. Adding together the LMW and HMW glutenins, and α-, γ-, ω-gliadins gives
 the net gliadin and glutenin content (B) which equated to GW having an estimated 67% of the gluten content of MW (dotted line).

 FIGURE 4 | GO enrichment analysis of proteins showing ≥2-fold increase in: MW (A); or GW (B).

DISCUSSION                                                                            gliadin and glutenin proteins were present in GW at 67% of the
                                                                                      abundance of the MW control, indicating an average decrease of
The current study used complementary high sensitivity LC-                             33% (Figure 3B). This is complemented by our analysis of intact
MS techniques to identify gluten proteins and to monitor the                          HLA-DQ reactive epitopes in the monitored peptides which
relative abundance of gluten and allergenic wheat proteins                            were 67.3% as abundant in GW as MW (Figure 5A). While this
in a recently developed wheat product (GoodWheat, GW) in                              may reduce but not remove the antigen content of GW, it is
comparison to a wheat sample mixed from equal amounts of                              accompanied by an increase in peptides known to be related to
nine commercial cultivars (Mixed wheat, MW). Peptides from                            Baker’s asthma and wheat allergy, at 180 and 379%, respectively.

Frontiers in Nutrition | www.frontiersin.org                                      7                                            August 2021 | Volume 8 | Article 705822
Nye-Wood et al. Gluten Detection by Proteomics
extraction buffers to understand more about changes in the GW
grain proteome.
In contrast to the MRM analysis that revealed an overall
lower gluten content in GW than MW (Figure 3), the R5 ELISA
estimate of gluten content revealed a gluten content ∼39% higher
in GW than MW. The slightly elevated protein content (5%)
in GW compared to MW would account for a minority of the
observed difference. The elevated ELISA measurement likely
reflects an overall increase in the ratio of R5 epitope per unit of
protein. The choice of reference material, in particular the ratio
of gliadin to glutenin, is known to affect measurements of gluten
by ELISA even in simple food matrices (45), and kits that use
different primary antibodies will yield different measurements
of gluten (46) because of the specificities and sensitivities of the
primary antibody (47). Future analyses should investigate the
gluten content of GW using alternative ELISA kits or gluten
protein quantitation employing fractionation (RP-HPLC or size-
exclusion chromatography) protocols.
Important trends were seen in specific gluten protein types
(Figures 2, 3), as the LMW-GSs, α-, and γ-gliadins are lower
in GW, while the HMW-GSs were significantly more abundant.
HMW glutenins contribute more to bread’s elastic properties
than other gluten proteins due to their relative size and ability
to form large polymers (48). Their higher relative abundance
in GW indicates that they in part compensate for the lower
abundance of gliadins and LMW glutenins (49). Additionally,
the level of immune response elucidated by HMW glutenins in
CD is significantly lower compared to the α-, γ-, and ω-gliadins
and LMW glutenins (40), making their increase less relevant
to CD, however it has important implications for WA and BA.
Along with ATIs, which were also significantly higher in GW,
the higher HMW glutenin content in GW brings more allergenic
epitopes related to WA and BA. This is reflected in Figure 5 as
the allergenic epitopes recognized by different B and T cell types
are increased by an overall 53.5%.
Interestingly, the ALPs were also present in significantly lower
amounts in GW than MW. While named for their resemblance
of oat avenins (50), these seed storage proteins share sequence
similarity and secondary function with γ-gliadins and LMW
glutenins (51). They contribute both to allergenicity (52) and
bread dough quality (53), and contain one or two gliadin
FIGURE 5 | Relative abundance of immune reactive epitopes in peptides (PF13016) domains. ALPs also contain CD-related B cell epitopes
quantified in MRM assays, reported as mean and standard error. Epitope (3), and their downregulation is important for CD toxicity.
sequences are highlighted in bold within the peptide sequence: (A) Coeliac The symmetry of the volcano plot (Figure 2) indicates the
disease HLA-DQ reactive epitopes; (B) Bakers’ asthma; (C) Wheat Allergy
net decrease in gluten protein and ALP content is accompanied
plus peptide QQQQQQQQILQQILQQQLIPCR which contains the epitope
QILQQQLIPC antigenic for wheat-dependent exercise induced anaphylaxis. by compensatory expression of other proteins within the grain.
When calculating the total, duplicate peptides where multiple epitopes were GO enrichment analysis of the GW proteome revealed enzyme
detected were only counted once. inhibitors and regulators that are enriched in GW which was also
confirmed by the gene set enrichment analysis showing cysteine-
rich proteins are overrepresented in the upregulated proteins in
GW. Most of these proteins have a defense related function and
The overlap between immunogenic DQ epitopes with peptides were upregulated in lieu of proteins with a canonical “nutrient
detected in discovery data, and quantified in MRM is presented reservoir activity” GO MF annotation (Figure 4).
in Supplementary Table 1. While the use of LC-MRM-MS in this Our proteogenomic analysis indicates that there is no evidence
work enabled the quantitation of gluten proteins and highlights of large-scale chromosome deletions or absence of storage
its utility in grain protein research with specific reference to protein gene clusters (Figures 1B,C) on chromosome group
gluten, future studies should focus on using complementary 1 and 6 in GW. While antibody-based assays or classical
Frontiers in Nutrition | www.frontiersin.org 8 August 2021 | Volume 8 | Article 705822Nye-Wood et al. Gluten Detection by Proteomics
Osborne fractionation were not performed and thus represents in comparison to MW. Additionally, the chromosomal level
a limitation of the present work, gluten proteins were present analysis of detected proteins showed no significant differences
in both GW and MW and simply expressed at different levels between GW and MW. Future studies focusing on integrating
(Figure 3). This would suggest the novel GW variety expresses LC-MS/MS results with clinical measurements would be needed
less gluten proteins due to gene regulation at a transcriptional or to investigate the nutritional benefits of GW. Overall, the current
post-transcriptional level. There are several known mechanisms study exemplifies the use of proteogenomic approaches as a tool
implicated in seed development and gluten protein expression to explore the safety and/or health benefits of wheat varieties
that may be at play. One is the LYS3 gene that encodes targeted toward consumers with wheat-related disorders.
the transcription factor Prolamin Binding Factor (PBF). PBF
is expressed early in seed development, and suppresses seed DATA AVAILABILITY STATEMENT
growth by reducing the expression of developmental and starch
metabolism genes (54). Wheat lys3 mutants have been reported The datasets presented in this study can be found in online
to contain lower levels of gliadins and LMW-GSs (21), which repositories. The names of the repository/repositories and
matches our results as shown in Figure 4. A barley variety accession number(s) can be found below: https://doi.org/10.
with lys3a mutation causing it to not express C-hordein (a 25919/fr8e-k267.
class of barley gluten) was used in a breeding program to
derive an “ultra-low gluten” barley variety (30, 55), showing AUTHOR CONTRIBUTIONS
it is compatible with selective breeding. These low-gluten PBF
mutant lines exhibit increased expression of lysine-rich genes MN-W: sample preparation, LC-MS data collection, data
that are otherwise related to developmental processes during analysis, and manuscript preparation. AJ and UB: data analysis
germination (30). While it is possible that GW uses lys3 and manuscript preparation. MC: project concept and design and
mechanisms to regulate gluten protein expression, using solely manuscript preparation. All authors contributed to the article
the proteomic information presented in this study we cannot and approved the submitted version.
conclusively determine the targeting of lys3 regulation.
In conclusion, the use of discovery and targeted proteomics- FUNDING
based experiments has enabled the detection and quantitation
of gluten and additional allergenic proteins present in the GW This study was partially supported by the ARC Centre
and MW samples. This study revealed a 33% decrease in gluten- of Excellence for Innovations in Peptide and Protein
like proteins in GW and the compensatory expression of non- Science (CE200100012).
gluten proteins within MW samples that tend to have enzyme
inhibitor or regulator activity GO terms. This study affirms that, SUPPLEMENTARY MATERIAL
as stated by the manufacturer, GW is not compatible with a
gluten-free diet. Epitope mapping revealed a reduction in gluten The Supplementary Material for this article can be found
protein-specific epitopes; however, there was an increase in online at: https://www.frontiersin.org/articles/10.3389/fnut.2021.
epitopes related to baker’s asthma and wheat allergy in GW wheat 705822/full#supplementary-material
REFERENCES 7. Schuppan D, Pickert G, Ashfaq-Khan M, Zevallos V. Non-celiac wheat
sensitivity: differential diagnosis, triggers and implications. Best Pract Res Clin
1. Shiferaw B, Smale M, Braun H-J, Duveiller E, Reynolds M, Muricho G. Gastroenterol. (2015) 29:469–76. doi: 10.1016/j.bpg.2015.04.002
Crops that feed the world 10. Past successes and future challenges to the 8. Ellis A, Linaker B. Non-coeliac gluten sensitivity? Lancet. (1978) 311:1358–
role played by wheat in global food security. Food Security. (2013) 5:291– 9. doi: 10.1016/S0140-6736(78)92427-3
317. doi: 10.1007/s12571-013-0263-y 9. Gibson PR, Skodje GI, Lundin KE. Non-coeliac gluten sensitivity. J
2. IWGSC, Appels R, Eversole K, Stein N, Feuillet C, Keller B, et al. Gastroenterol Hepatol. (2017) 32:86–9. doi: 10.1111/jgh.13705
Shifting the limits in wheat research and breeding using a fully annotated 10. Skodje GI, Sarna VK, Minelle IH, Rolfsen KL, Muir JG, Gibson PR,
reference genome. Science. (2018) 361:eaar7191. doi: 10.1126/science.a et al. Fructan, rather than gluten, induces symptoms in patients with self-
ar7191 reported non-celiac gluten sensitivity. Gastroenterology. (2018) 154:529–
3. Juhász A, Belova T, Florides CG, Maulis C, Fischer I, Gell G, et al. Genome 39. doi: 10.1053/j.gastro.2017.10.040
mapping of seed-borne allergens and immunoresponsive proteins in wheat. 11. Kang J, Kang A, Green A, Gwee K, Ho K. Systematic review: worldwide
Sci Adv. (2018) 4:eaar8602. doi: 10.1126/sciadv.aar8602 variation in the frequency of coeliac disease and changes over time. Aliment
4. Ludvigsson JF, Leffler DA, Bai JC, Biagi F, Fasano A, Green PHR, et al. Pharmacol Ther. (2013) 38:226–45. doi: 10.1111/apt.12373
The Oslo definitions for coeliac disease and related terms. Gut. (2013) 12. Singh P, Arora A, Strand TA, Leffler DA, Catassi C, Green PH, et al.
62:43. doi: 10.1136/gutjnl-2011-301346 Global prevalence of celiac disease: systematic review and meta-analysis. Clin
5. Cabanillas B. Gluten-related disorders: celiac disease, wheat allergy, and Gastroenterol Hepatol. (2018) 16:823–36. doi: 10.1016/j.cgh.2017.06.037
nonceliac gluten sensitivity. Crit Rev Food Sci Nutr. (2020) 60:2606– 13. Cabrera-Chávez F, Dezar GV, Islas-Zamorano AP, Espinoza-Alderete JG,
21. doi: 10.1080/10408398.2019.1651689 Vergara-Jiménez MJ, Magaña-Ordorica D, et al. Prevalence of self-reported
6. Salcedo G, Quirce S, Diaz-Perales A. Wheat allergens associated with Baker’s gluten sensitivity and adherence to a gluten-free diet in argentinian adult
asthma. J Investig Allergol Clin Immunol. (2011) 21:81–92. population. Nutrients. (2017) 9:81. doi: 10.3390/nu9010081
Frontiers in Nutrition | www.frontiersin.org 9 August 2021 | Volume 8 | Article 705822Nye-Wood et al. Gluten Detection by Proteomics
14. Ontiveros N, López-Gallardo JA, Vergara-Jiménez MJ, Cabrera-Chávez F. 32. Gil-Humanes J, Pistón F, Rosell CM, Barro F. Significant down-regulation
Self-reported prevalence of symptomatic adverse reactions to gluten and of γ-gliadins has minor effect on gluten and starch properties of
adherence to gluten-free diet in an adult Mexican population. Nutrients. bread wheat. J Cereal Sci. (2012) 56:161–70. doi: 10.1016/j.jcs.2012.
(2015) 7:6000–15. doi: 10.3390/nu7075267 02.009
15. Ontiveros N, Rodríguez-Bellegarrigue CI, Galicia-Rodríguez G, Vergara- 33. Gil-Humanes J, Pistón F, Tollefsen S, Sollid LM, Barro F. Effective
Jiménez MDJ, Zepeda-Gómez EM, Arámburo-Galvez JG, et al. Prevalence shutdown in the expression of celiac disease-related wheat gliadin T-cell
of self-reported gluten-related disorders and adherence to a gluten-free diet epitopes by RNA interference. Proc Natl Acad Sci USA. (2010) 107:17023–
in Salvadoran adult population. Int J Environ Res Public Health. (2018) 8. doi: 10.1073/pnas.1007773107
15:786. doi: 10.3390/ijerph15040786 34. Schmidt D, Gaziola SA, Boaretto LF, Azevedo RA. Proteomic analysis of
16. Catassi C, Bai JC, Bonaz B, Bouma G, Calabrò A, Carroccio A, et al. Non- mature barley grains from C-hordein antisense lines. Phytochemistry. (2016)
celiac gluten sensitivity: the new frontier of gluten related disorders. Nutrients. 125:14–26. doi: 10.1016/j.phytochem.2016.03.001
(2013) 5:3839–53. doi: 10.3390/nu5103839 35. van den Broeck HC, van Herpen TW, Schuit C, Salentijn EM, Dekking
17. Fasano A, Sapone A, Zevallos V, Schuppan D. Nonceliac gluten sensitivity. L, Bosch D, et al. Removing celiac disease-related gluten proteins from
Gastroenterology. (2015) 148:1195–204. doi: 10.1053/j.gastro.2014. bread wheat while retaining technological properties: a study with Chinese
12.049 Spring deletion lines. BMC Plant Biol. (2009) 9:1–12. doi: 10.1186/1471-2
18. Larre C, Lupi R, Gombaud G, Brossard C, Branlard G, Moneret- 229-9-41
Vautrin D, et al. Assessment of allergenicity of diploid and hexaploid 36. Jouanin A, Borm T, Boyd LA, Cockram J, Leigh F, Santos BA, et al.
wheat genotypes: identification of allergens in the albumin/globulin Development of the GlutEnSeq capture system for sequencing gluten
fraction. J Proteomics. (2011) 74:1279–89. doi: 10.1016/j.jprot.2011. gene families in hexaploid bread wheat with deletions or mutations
03.014 induced by γ-irradiation or CRISPR/Cas9. J Cereal Sci. (2019) 88:157–
19. Fry L, Madden A, Fallaize R. An investigation into the nutritional composition 66. doi: 10.1016/j.jcs.2019.04.008
and cost of gluten-free versus regular food products in the UK. J Human Nutr 37. Jouanin A, Schaart JG, Boyd LA, Cockram J, Leigh FJ, Bates R, et al. Outlook
Diet. (2018) 31:108–20. doi: 10.1111/jhn.12502 for coeliac disease patients: towards bread wheat with hypoimmunogenic
20. Sestili F, Botticella E, Lafiandra D. TILLING for improved starch gluten by gene editing of α-and γ-gliadin gene families. BMC Plant Biol. (2019)
composition in wheat. In: Tuberosa R, Graner A, Frison E, editors. 19:1–16. doi: 10.1186/s12870-019-1889-5
Genomics of Plant Genetic Resources: Volume 2. Crop Productivity, Food 38. Arcadia Biosciences. GoodWheatTM . (2021). Available online at: https://
Security and Nutritional Quality. Dordrecht: Springer (2014). p. 467– arcadiabio.com/products/goodwheat/ (accessed July 26, 2021).
87. doi: 10.1007/978-94-007-7575-6_20 39. Sollid LM. The roles of MHC class II genes and post-translational
21. Moehs CP, Austill WJ, Holm A, Large TA, Loeffler D, Mullenberg J, modification in celiac disease. Immunogenetics. (2017) 69:605–
et al. Development of decreased-gluten wheat enabled by determination 16. doi: 10.1007/s00251-017-0985-7
of the genetic basis of lys3a barley. Plant Physiol. (2019) 179:1692– 40. Tye-Din JA, Stewart JA, Dromey JA, Beissbarth T, van Heel
703. doi: 10.1104/pp.18.00771 DA, Tatham A, et al. Comprehensive, quantitative mapping of T
22. Frisoni M, Corazza GR, Lafiandra D, De Ambrogio E, Filipponi C, Bonvicini cell epitopes in gluten in celiac disease. Sci Transl Med. (2010)
F, et al. Wheat deficient in gliadins: promising tool for treatment of coeliac 2:41ra51. doi: 10.1126/scitranslmed.3001012
disease. Gut. (1995) 36:375. doi: 10.1136/gut.36.3.375 41. Bose U, Broadbent JA, Byrne K, Hasan S, Howitt CA, Colgrave ML.
23. Doll H, Køie B, Eggum BO. Induced high lysine mutants in barley. Radiat Bot. Optimisation of protein extraction for in-depth profiling of the cereal
(1974) 14:73–80. doi: 10.1016/S0033-7560(74)90179-3 grain proteome. J Proteomics. (2019) 197:23–33. doi: 10.1016/j.jprot.2019.
24. Tanner GJ, Blundell MJ, Colgrave ML, Howitt CA. Creation of the first ultra- 02.009
low gluten barley (Hordeum vulgare L.) for coeliac and gluten-intolerant 42. MacLean B, Tomazela DM, Shulman N, Chambers M, Finney GL, Frewen
populations. Plant Biotechnol J. (2016) 14:1139–50. doi: 10.1111/pbi. B, et al. Skyline: an open source document editor for creating and
12482 analyzing targeted proteomics experiments. Bioinformatics. (2010) 26:966–
25. Sánchez-León S, Gil-Humanes J, Ozuna CV, Giménez MJ, Sousa C, Voytas DF, 8. doi: 10.1093/bioinformatics/btq054
et al. Low-gluten, nontransgenic wheat engineered with CRISPR/Cas9. Plant 43. Goedhart J, Luijsterburg MS. VolcaNoseR is a web app for creating,
Biotechnol J. (2018) 16:902–10. doi: 10.1111/pbi.12837 exploring, labeling and sharing volcano plots. Sci Rep. (2020)
26. Wen S, Wen N, Pang J, Langen G, Brew-Appiah RAT, Mejias JH, et al. 10:20560. doi: 10.1038/s41598-020-76603-3
Structural genes of wheat and barley 5-methylcytosine DNA glycosylases and 44. Sollid LM, Tye-Din JA, Qiao S-W, Anderson RP, Gianfrani C, Koning F.
their potential applications for human health. Proc Natl Acad Sci USA. (2012) Update 2020: nomenclature and listing of celiac disease–relevant gluten
109:20543–8. doi: 10.1073/pnas.1217927109 epitopes recognized by CD4+ T cells. Immunogenetics. (2020) 72:85–
27. Carroccio A, Di Prima L, Noto D, Fayer F, Ambrosiano G, Villanacci V, 8. doi: 10.1007/s00251-019-01141-w
et al. Searching for wheat plants with low toxicity in celiac disease: between 45. Schalk K, Koehler P, Scherf KA. Targeted liquid chromatography tandem
direct toxicity and immunologic activation. Digest Liver Dis. (2011) 43:34– mass spectrometry to quantitate wheat gluten using well-defined reference
9. doi: 10.1016/j.dld.2010.05.005 proteins. PLoS ONE. (2018) 13:e0192804. doi: 10.1371/journal.pone.0
28. Camerlengo F, Frittelli A, Sparks C, Doherty A, Martignago D, Larré C, et al. 192804
CRISPR-Cas9 multiplex editing of the α-amylase/trypsin inhibitor genes to 46. Thompson T, Méndez E. Commercial assays to assess gluten content of
reduce allergen proteins in durum wheat. Front Sustain Food Syst. (2020) gluten-free foods: why they are not created equal. J Am Diet Assoc. (2008)
4:104. doi: 10.3389/fsufs.2020.00104 108:1682–7. doi: 10.1016/j.jada.2008.07.012
29. Kalunke RM, Tundo S, Sestili F, Camerlengo F, Lafiandra D, Lupi R, 47. Scherf KA. Gluten analysis of wheat starches with seven commercial ELISA
et al. Reduction of allergenic potential in bread wheat RNAi transgenic test kits—Up to six different values. Food Anal Methods. (2017) 10:234–
lines silenced for CM3, CM16 and 0.28 ATI genes. Int J Mol Sci. (2020) 46. doi: 10.1007/s12161-016-0573-8
21:5817. doi: 10.3390/ijms21165817 48. Delcour JA, Joye IJ, Pareyt B, Wilderjans E, Brijs K, Lagrain
30. Bose U, Broadbent JA, Byrne K, Blundell MJ, Howitt CA, Colgrave ML. B. Wheat gluten functionality as a quality determinant in
Proteome analysis of hordein-null barley lines reveals storage protein cereal-based food products. Annu Rev Food Sci Technol. (2012)
synthesis and compensation mechanisms. J Agric Food Chem. (2020) 68:5763– 3:469–92. doi: 10.1146/annurev-food-022811-101303
75. doi: 10.1021/acs.jafc.0c01410 49. Gianibelli M, Larroque O, MacRitchie F, Wrigley C. Biochemical, genetic, and
31. García-Molina MD, Muccilli V, Saletti R, Foti S, Masci S, Barro F. molecular characterization of wheat endosperm proteins. Cereal Chem. (2001)
Comparative proteomic analysis of two transgenic low-gliadin wheat 78:635–46. doi: 10.1094/CCHEM.2001.78.6.635
lines and non-transgenic wheat control. J Proteomics. (2017) 165:102– 50. Kan Y, Wan Y, Beaudoin F, Leader DJ, Edwards K, Poole R, et al.
12. doi: 10.1016/j.jprot.2017.06.010 Transcriptome analysis reveals differentially expressed storage protein
Frontiers in Nutrition | www.frontiersin.org 10 August 2021 | Volume 8 | Article 705822Nye-Wood et al. Gluten Detection by Proteomics
transcripts in seeds of Aegilops and wheat. J Cereal Sci. (2006) 44:75– Conflict of Interest: The authors declare that the research was conducted in the
85. doi: 10.1016/j.jcs.2006.04.004 absence of any commercial or financial relationships that could be construed as a
51. Colgrave ML, Goswami H, Byrne K, Blundell M, Howitt CA, Tanner GJ. potential conflict of interest.
Proteomic profiling of 16 cereal grains and the application of targeted
proteomics to detect wheat contamination. J Proteome Res. (2015) 14:2659– The reviewer KS declared a past co-authorship with one of the authors, MC,
68. doi: 10.1021/acs.jproteome.5b00187 to the handling editor.
52. Zhang Y, Hu X, Juhasz A, Islam S, Yu Z, Zhao Y, et al. Characterising avenin-
like proteins (ALPs) from albumin/globulin fraction of wheat grains by RP- Publisher’s Note: All claims expressed in this article are solely those of the authors
HPLC, SDS-PAGE, and MS/MS peptides sequencing. BMC Plant Biol. (2020) and do not necessarily represent those of their affiliated organizations, or those of
20:45. doi: 10.1186/s12870-020-2259-z the publisher, the editors and the reviewers. Any product that may be evaluated in
53. Ma F, Li M, Li T, Liu W, Liu Y, Li Y, et al. Overexpression of avenin-like
this article, or claim that may be made by its manufacturer, is not guaranteed or
b proteins in bread wheat (Triticum aestivum L.) improves dough mixing
endorsed by the publisher.
properties by their incorporation into glutenin polymers. PLoS ONE. (2013)
8:e66758. doi: 10.1371/journal.pone.0066758 Copyright © 2021 Nye-Wood, Juhász, Bose and Colgrave. This is an open-access
54. Orman-Ligeza B, Borrill P, Chia T, Chirico M, DoleŽel J, Drea S, article distributed under the terms of the Creative Commons Attribution License (CC
et al. LYS3 encodes a prolamin-box-binding transcription factor that BY). The use, distribution or reproduction in other forums is permitted, provided
controls embryo growth in barley and wheat. J Cereal Sci. (2020) the original author(s) and the copyright owner(s) are credited and that the original
93:102965. doi: 10.1016/j.jcs.2020.102965 publication in this journal is cited, in accordance with accepted academic practice.
55. Howitt CA, Larkin PJ, Colgrave ML. Gluten reduction strategies for wheat and No use, distribution or reproduction is permitted which does not comply with these
barley. Cereal Food World. (2018) 65:184–7. doi: 10.1094/CFW-63-5-0184 terms.
Frontiers in Nutrition | www.frontiersin.org 11 August 2021 | Volume 8 | Article 705822You can also read