Reductions in sugar sales from soft drinks in the UK from 2015 to 2018
←
→
Page content transcription
If your browser does not render page correctly, please read the page content below
Bandy et al. BMC Medicine      (2020) 18:20
https://doi.org/10.1186/s12916-019-1477-4

 RESEARCH ARTICLE                                                                                                                               Open Access

Reductions in sugar sales from soft drinks
in the UK from 2015 to 2018
L. K. Bandy1* , P. Scarborough1, R. A. Harrington1, M. Rayner1 and S. A. Jebb2

  Abstract
  Background: The consumption of free sugars in the UK is more than double the guideline intake for adults and
  close to triple for children, with soft drinks representing a significant proportion. The aim of this study was to assess
  how individual soft drink companies and consumers have responded to calls to reduce sugar consumption,
  including the soft drink industry levy (SDIL), between 2015 and 2018.
  Methods: This was an annual cross-sectional study using nutrient composition data of 7377 products collected
  online, paired with volume sales data for 195 brands offered by 57 companies. The main outcome measures were
  sales volume, sugar content and volume of sugars sold by company and category, expressed in total and per capita
  per day terms.
  Results: Between 2015 and 2018, the volume of sugars sold per capita per day from soft drinks declined by 30%,
  equivalent to a reduction of 4.6 g per capita per day. The sales-weighted mean sugar content of soft drinks fell
  from 4.4 g/100 ml in 2015 to 2.9 g/100 ml in 2018. The total volume sales of soft drinks that are subject to the SDIL
  (i.e. contain more than 5 g/100 ml of sugar) fell by 50%, while volume sales of low- and zero-sugar (< 5 g/100 ml)
  drinks rose by 40%.
  Conclusion: Action by the soft drinks industry to reduce sugar in products and change their product portfolios,
  coupled with changes in consumer purchasing, has led to a significant reduction in the total volume and per capita
  sales of sugars sold in soft drinks in the UK. The rate of change accelerated between 2017 and 2018, which also
  implies that the implementation of the SDIL acted as an extra incentive for companies to reformulate above and
  beyond what was already being done as part of voluntary commitments to reformulation, or changes in sales
  driven by consumer preferences.
  Keywords: Public health policy, Sugar reduction, Reformulation, Industry, Soft drinks

Introduction                                                                         Government challenged the food industry to reduce the
National surveys show that the consumption of free                                   sugar content of foods by 20% by 2020 [4]. Furthermore,
sugars in the UK is more than double the guideline in-                               in March 2016, it announced a three-tiered levy on
take for adults and close to triple for children aged 4–10                           sugar-sweetened soft drinks, which was implemented in
and 11–18 years [1]. Soft drinks have been a major                                   April 2018 and is the first soft drink tax in the world to
source of free sugars for many years [2] and currently                               have multiple tiers designed to drive reformulation [5].
account for 21% (57 g/day) and 33% (67 g/day) of the                                 Products that contain more than 8 g sugar per 100 ml
total free sugar intake in adults and children, respectively                         are now taxed at 24 pence per litre and products that
[1]. Following a report from the Scientific Advisory                                 contain 5–8 g/100 ml are taxed at 18 pence per litre.
Committee on Nutrition which recommended a lower                                     Products with less than 5 g sugar per 100 ml are not sub-
target of 5% dietary energy from free sugars [3], the UK                             ject to the tax [5]. Pure, unsweetened fruit juice and fla-
                                                                                     voured milk drinks (amongst other smaller categories)
* Correspondence: lauren.bandy@ndph.ox.ac.uk                                         are excluded from the levy. The challenge to the food in-
1
 Centre on Population Approaches for NCD Prevention, Nuffield Department             dustry to reformulate their products and the introduc-
of Population Health, University of Oxford, BDI Building, Old Road Campus,
Oxford OX3 7FZ, UK                                                                   tion of the tax have been accompanied by a large public
Full list of author information is available at the end of the article

                                       © The Author(s). 2020 Open Access This article is distributed under the terms of the Creative Commons Attribution 4.0
                                       International License (http://creativecommons.org/licenses/by/4.0/), which permits unrestricted use, distribution, and
                                       reproduction in any medium, provided you give appropriate credit to the original author(s) and the source, provide a link to
                                       the Creative Commons license, and indicate if changes were made. The Creative Commons Public Domain Dedication waiver
                                       (http://creativecommons.org/publicdomain/zero/1.0/) applies to the data made available in this article, unless otherwise stated.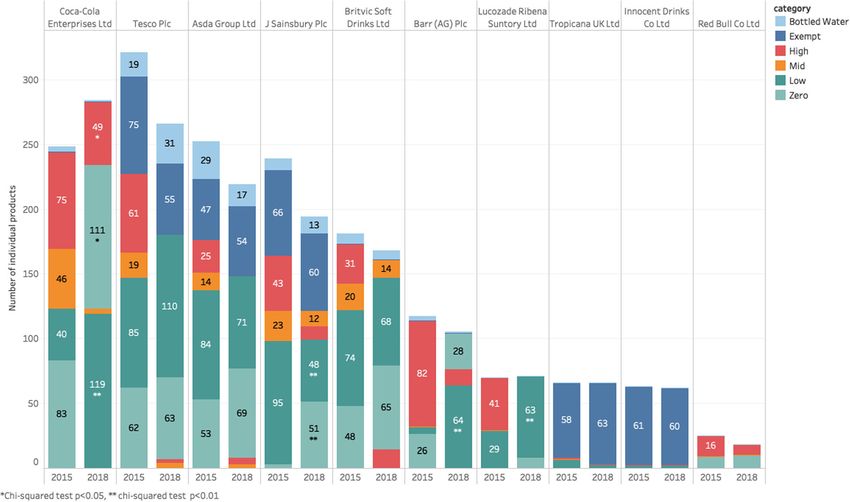
Bandy et al. BMC Medicine   (2020) 18:20                                                                     Page 2 of 10

awareness campaign, particularly as part of an initiative       The product-level nutrient composition data of indi-
called Change4Life [6] as well as increased attention to      vidual soft drinks were provided by Brand View, a
sugar-related harm in the mass media [7].                     private analytics company that collects product informa-
  We aimed to assess the sugar content of soft drinks,        tion, including nutrient composition data, by scraping
both at the aggregate category and company level. Using       from websites of the three leading UK retailers: Asda,
a novel method that links nutrient composition data and       Sainsbury’s and Tesco. These data were scraped on the
volume sales of soft drinks, we have analysed how shifts      same date (13 December) for four consecutive years
in consumer demand and changes made by individual             (2015, 2016, 2017 and 2018).
soft drink companies have impacted on the total volume
and per capita volume sugar sales from soft drinks. We
                                                              Matching the sales data and composition data
focus on the period from 2015 to 2018 which spans a
                                                              To estimate the sales-weighted mean sugar content of
period of growing action on soft drinks, including
                                                              soft drinks in the UK market and to calculate the total
changes in consumer awareness and behaviour, volun-
                                                              amount of sugars sold by each company, we matched
tary reformulation characterised by public pledges from
                                                              the Euromonitor brand-level data with the Brand View
some companies, the announcement of a soft drinks in-
                                                              product-level data. When one brand had multiple vari-
dustry levy (SDIL) in March 2016 and its implementa-
                                                              ants, the mean sugar content for the variants was calcu-
tion in April 2018.
                                                              lated and paired with the sales data. For example, the
                                                              2018 volume sales data for the brand Lipton were
Methods                                                       matched with the mean nutrient information collected
We estimated the total contribution of sugar to the food      from five individual products with different flavours
supply for all of the companies in the soft drinks sector     and/or sizes.
by pairing brand-level sales data with individual                Corresponding nutrient composition data could not be
product-level nutrient composition data on an annual          found for 23 brands in the sales database. For 12 of these
basis for four consecutive years from 2015 to 2018.           brands, it was because they were not sold in the super-
                                                              markets included in the Brand View database. For these
                                                              brands, the nutrient composition data were sourced on-
Data types and sources
                                                              line from the brand website in early 2019, and this data
We identified soft drink manufacturers in the market in
                                                              was used for all four years. The remaining 11 brands
2018, including retailers who manufacture their own-
                                                              (constituting < 1% of total volume sales) did not have
label products, using data obtained from Euromonitor.
                                                              matching composition data in the given time period and
Euromonitor is a private research company that provides
                                                              were removed from the dataset. Euromonitor classifies a
sales data collected from primary and secondary data
                                                              number of small and local brands under the umbrella of
sources, including store audits, interviews with compan-
                                                              “others”, and these products, representing 21% of the
ies, publicly available statistics and company reports [8].
                                                              total volume sales of soft drinks, were excluded from all
Its coverage includes supermarkets, convenience stores,
                                                              analysis.
markets, vending machines, restaurants and fast food
outlets. We calculated the total annual sales for all
brands across eight types of soft drink, as defined by        Statistical analysis
Euromonitor: bottled water, carbonates, concentrates,         The total volume of sugars sold (tonnes per year) and
100% juice, juice drinks, energy drinks, sports drinks and    the sales-weighted mean sugar content were calculated
others. Bottled water and 100% juice were included, des-      for each company. Per capita results were calculated
pite being excluded from the tax, to provide a picture of     using annual population estimates from the Office for
how the market share of these products may have chan-         National Statistics (ONS) [9], and per day results were
ged compared to sugar-sweetened drinks. Milk and              calculated by dividing by 365.
milk-based drinks, hot drinks and drinks containing al-          Each of the products was categorised according to
cohol were excluded.                                          their sugar content in relation to the tax payable under
  A brand was defined as a set of products that have the      the SDIL. Products that are subject to the SDIL and con-
same name and are manufactured by one company. One            tain > 8 g/100 ml sugar were categorised as “high-sugar”
brand of soft drink may have multiple variants. For ex-       and those between 5 and 8 g/100 ml as “mid-sugar”.
ample, the company Britvic manufactures a number of           Products with less than 5 g of sugar and not subject to
different brands, including Pepsi, Pepsi Max, Lipton Ice      the SDIL were split into two discrete groups: “low-sugar”
Tea and Robinsons. Within a single brand, there may be        if they contained 0.1–5 g/100 ml sugar and “zero-sugar”
a number of different products, for example, Lipton Ice       if they contained < 0.1 g/100 ml sugar. Plain bottled
Tea with Peach and Lipton Ice Tea with Lemon.                 water was assigned its own category, “bottled water”.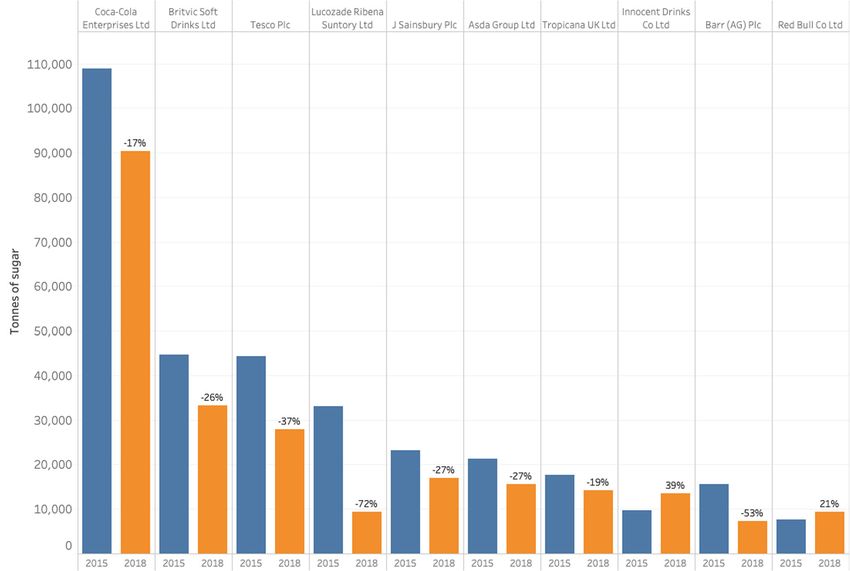
Bandy et al. BMC Medicine (2020) 18:20 Page 3 of 10
Fruit juices with no added sugar are excluded from the Very similar trends were found, when expressed per
tax and were categorised as “exempt”. capita per day, with the volume of sugars sold from soft
Neither the sales nor composition data were normally drinks falling from 15.5 g per person per day in 2015 to
distributed, so we calculated the mean and median sugar 10.8 g in 2018, a reduction of 30% (Table 3).
content and interquartile range. Chi-squared tests were The absolute mean sugar content of soft drinks fell
used to assess the differences in the number of products from 5.4 g/100 ml in 2015 to 3.9 g/100 ml in 2018, a re-
in different soft drink categories sold by individual com- duction of 28% (Table 4). The annual changes from
panies over time. A Kruskal-Wallis test was used to test 2015 to 18 were − 7, − 10 and − 13%. The mean sugar
for differences between the sales-weighted mean sugar content of the high- and mid-sugar drinks remained un-
contents of each soft drink category—here, we weighted changed, but for the low-sugar category, the mean sugar
the analysis so that each brand had influence propor- content rose from 0.9 g/100 ml (0.5–3.2 g/100 ml) to 4.2
tional to total sales, but the sum of the units of analysis g/100 ml (0.9–4.7 g/100 ml).
was equal to the number of brands. We calculated the Once adjusted for sales, the weighted mean sugar
absolute mass of sugar sold and the sales-weighted mean content of all soft drinks decreased significantly from
sugar content of drinks sold over time. 4.4 g/100 ml (IQR, 0.0–9.2 g/100 ml) to 2.9 g/100 ml
(0.0–4.3 g/100 ml), an overall reduction of 34%
(Table 5).
Results Energy drinks saw the greatest absolute reduction in
In 2015, 55 soft drink companies sold 195 brands sales-weighted mean sugar content (− 4.3 g/100 ml)
(Table 1). This rose to 57 companies and 199 brands in (Fig. 2). Juice drinks also saw a significant reduction
2018. The total volume sales of soft drinks in the UK in- in sales-weighted mean sugar content (− 3.2 g/100 ml).
creased by 7% from 2015 to 2018, reaching 8.9 billion li- The sales-weighted mean sugar content of carbonates,
tres. Once adjusted for changes in the population size the category with the largest volume sales, fell by
and expressed in per capita terms, the volume sales of 29%. Changes in 100% juice and sports drinks were
soft drinks rose by 5%, from 351 ml per person per day minimal.
to 367 ml per person per day. There was a decrease in the total volume sales of
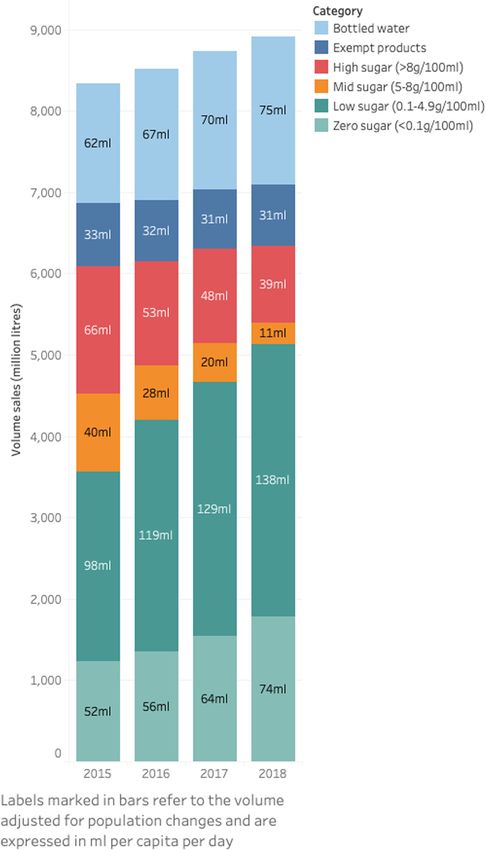
There have been marked shifts in the proportion of sugars for eight of the top ten companies (defined by
drinks sold by sugar content. The total volume sales of their total contribution to total volume sales of sugars)
high- and mid-sugar soft drinks included in the SDIL, (Fig. 3). The largest soft drinks company in terms of
with sugar content > 5 g/100 ml, fell from 31% in 2015 total volume sales of sugars in all four years was Coca-
to 15% in 2018, equivalent to 106 ml per person per day Cola; volume sales increased while the sugar content of
to 50 ml per person per day. The combined low- and products fell, leading to a 17% decrease in the total vol-
zero-sugar category increased from 43 to 48%, equiva- ume of sugars sold over time. Volume sales for Red Bull
lent to 150 ml per person per day in 2015 to 212 ml in and Innocent increased with little change in the mean
2018 (Fig. 1). The total volume sales of bottled water sugar content of their products, leading to increases in
and products exempt from the SDIL rose by 23%. This the volume sales of sugars for these two companies.
analysis was repeated without sales weighting (Add- There have been significant changes in the product
itional file 1: Fig. S1). portfolios of soft drink companies since 2015, including
The total volume of sugars sold from soft drinks de- the reformulation of existing products and the introduc-
creased by 29%, from 368,000 t in 2015 to 261,000 t in tion of new products. In 2015, eight of the top ten com-
2015 (Table 2). The proportion of sugars sold from panies manufactured high- and mid-sugar products that
products included in the SDIL (i.e. high- and mid-sugar are targeted by the SDIL, and two companies—Innocent
products) decreased from 63 to 44%, while the propor- and Tropicana—sold only exempt products (Fig. 4). Of
tion increased for low-sugar products from 16 to 28%. these eight, six reformulated or removed more than 50%
Table 1 Data points in the sales volume and nutrient composition databases, 2015–2018
Description 2015 2016 2017 2018
Number of individual products in nutrient composition database 1966 1851 1725 1735
Number of brands in sales volume database 195 195 198 199
Number of companies in sales volume database 54 55 57 57
Total volume sales of soft drinks (million litres) 8336 8519 8728 8910
Volume sales of soft drinks (per capita per day) 351 356 362 367Bandy et al. BMC Medicine (2020) 18:20 Page 4 of 10
Fig. 1 The volume sales of soft drinks by category, 2015–2018
of the high- and mid-sugar products from their portfo- 2015 and 2018, equivalent to a reduction in 4.6 g sugar
lios—leading to a 72% reduction in high- and mid-sugar per capita per day. The mean sugar content of soft
products by 2018. drinks declined by 34% throughout the period, with the
greatest decrease in 2017–2018, the year the SDIL was
Discussion implemented. There has been a 50% decrease in the vol-
This analysis shows that despite a 5% increase in the vol- ume sales of products that are subject to the SDIL. Six
ume sales of soft drinks in per capita terms, the sale of of the top ten companies have reformulated more than
sugars from these products decreased by 30% between half the products in their portfolio during this period.Bandy et al. BMC Medicine (2020) 18:20 Page 5 of 10
Table 2 The total volume of sugar sold from soft drinks, 2015–2018
Soft drink category Total sugars (tonnes) sold by soft drink category
2015 2016 2017 2018
Total volume of sugars sold (t) 367,965 (100%) 328,685 (100%) 305,732 (100%) 261,324 (100%)
High-sugar (> 8 g/100 ml) 170,541.0 (46%) 139,192.3 (42%) 127,580.80 (42%) 102,553.10 (39%)
Mid-sugar (5–8 g/100 ml) 61,273.2 (17%) 43,325.3 (13%) 30,712.40 (10%) 13,948.90 (5%)
Low-sugar (0.1–5 g/100 ml) 58,739.3 (16%) 72,330.8 (22%) 76,015.40 (25%) 72,894.40 (28%)
Zero-sugar (< 0.1 g/100 ml) 0 (0%) 0 (0%) 0 (0%) 0 (0%)
Exempt products 77,411.6 (21%) 73,836.4 (22%) 71,423.10 (23%) 71,927.7 (28%)
Bottled water 0 (0%) 0 (0%) 0 (0%) 0 (0%)
Strengths and weaknesses of this study suggests that our datasets included the majority of
We analysed the nutrient composition data of soft drink drinks available in the UK marketplace. The nutrition
products across the whole market. By pairing compos- information for brands that are not sold in the three
ition data with sales data, we were able to capture not supermarkets represented in the Brand View database
just what is available, but what is sold, and the net im- (n = 12) had to be collected manually from the brand
pact on total sugar sales. This provides novel insights website in 2019. This means that no historical change
into how both consumer demand for soft drinks and in- could be measured for these brands, other than changes
dividual companies have responded to sugar reduction in sales levels. These products make a small contribution
policies and the broader debate about sugar and soft to overall sales (2% in 2018), and re-running the analysis
drinks in the UK, and provides proof-of-concept for a to exclude these 12 brands made no substantive differ-
method that could be used to monitor sugar reduction ence to the main results.
in other key food categories. There are two main advantages to using sales data, as
The nutrient composition data were collected from opposed to the national dietary survey data. Firstly, it
three supermarket websites (Asda, Sainsbury’s and avoids the reliance on individual recall of consumption,
Tesco) at single time points in the four years included in and secondly, the datasets include greater detail about
the analysis. The number of unique products included in individual brands. Euromonitor data has a wide cover-
this study is likely to be an underestimate of the total age, including hypermarkets, supermarkets, convenience
number of products on the market for two reasons. First, stores, vending machines and fast food outlets. These
we have not included soft drinks that are only available advantages, combined with the fact that it is an
for purchase outside of the three included supermarkets. industry-accepted source of sales data, means that it is
Second, taking our data from single time points means particularly suited to studying changes at a company and
that we have not captured the churn of soft drink prod- brand level. However, as with other possible data sources
ucts over the year (e.g. products leaving the marketplace [11], there are limitations. The authors have no control
and being replaced by new drinks, and seasonal fluctua- over the data collection process and there is limited
tions). Comparison of our dataset against other datasets transparency in the methods of data collection or the re-
used in the NIHR-funded SDIL Evaluation project [10] liability of the sources [11]. Euromonitor also classifies
Table 3 The volume of sugars sold by soft drink category, per capita per day, 2015–2018
Soft drink category Volume of soft drink and sugars sold per capita per day
2015 2016 2017 2018
Volume of sugars sold from soft drinks (g/person/day) 15.5 13.7 12.7 10.8
High-sugar (> 8 g/100 ml) 7.2 (46%) 5.8 (42%) 5.3 (42%) 4.2 (39%)
Mid-sugar (5–8 g/100 ml) 2.6 (17%) 1.8 (13%) 1.3 (10%) 0.6 (5%)
Low-sugar (0.1–5 g/100 ml) 2.5 (16%) 3.0 (22%) 3.2 (25%) 3.0 (28%)
Zero-sugar (< 0.1 g/100 ml) 0.0 0.0 0.0 0.0
Exempt products 3.3 (21%) 3.1 (22%) 3.0 (23%) 3.0 (28%)
Bottled water 0.0 0.0 0.0 0.0Bandy et al. BMC Medicine (2020) 18:20 Page 6 of 10
Table 4 The average sugar content of soft drink products by category, 2015–2018
Soft drink category Mean sugar content (g/100 ml) and IQR (Q2, Q1–Q3)
2015 2016 2017 2018 p value
Total soft drinks (g/100 ml) 5.4 (5.0, 0.2–10.0) 5.0 (4.3, 0.0–9.5) 4.5 (4.1, 0.0–8.9) 3.9 (3.8, 0.0–7.1) < 0.01
High-sugar (> 8 g/100 ml) 10.8 (10.8, 10.0–11.8) 10.6 (10.6, 9.6–11.3) 10.6 (10.6, 9.9–11.0) 10.6 (10.6, 10.0–11.0) 0.18
Mid-sugar (5–8 g/100 ml) 6.7 (6, 6.0–7.3) 6.8 (6.8, 6.0–7.3) 6.7 (6.7, 5.9–7.2) 7.0 (7.0, 5.8–7.3) 0.94
Low-sugar (0.1–5 g/100 ml) 0.9 (0.9, 0.5–3.2) 1.1 (1.1, 0.5–3.8) 3.1 (3.1, 0.7–4.5) 4.2 (4.2, 0.9–4.7) < 0.01
Zero-sugar (< 0.1 g/100 ml) 0.0 (0.0–0.0) 0.0 (0.0–0.0) 0.0 (0.0–0.0) 0.0 (0.0–0.0) 0.99
Exempt (g/100 ml) 10.0 (10.0, 8.7–11.0) 9.8 (9.8, 8.6–11.0) 9.8 (9.8, 8.6–11.0) 9.7 (9.7, 8.7–11.0) 0.21
Bottled water 0.0 (0.0–0.0) 0.0 (0.0–0.0) 0.0 (0.0–0.0) 0.0 (0.0–0.0) 0.99
small and local brands under the umbrella term “others”. changes were due to the reformulation of existing prod-
These brands represented 21% of total volume sales in ucts or the introduction of new low-sugar products to
2018 but were excluded from this study. Within the the market. The total UK population size was used to
Euromonitor dataset, the granularity by brand differed calculate the per capita figures. These results do not tell
from company to company. For example, sales figures us anything about the distribution of soft drink sales
were given for Diet Coca-Cola and regular Coca-Cola within the population and will include a large percentage
separately, but for Sprite, both diet and regular versions of zero consumers. This dataset, and other sources of
were combined. food sales data, would benefit from the inclusion of
When multiple products were available under a single population demographic factors in the future, including
sales figure, we used an average sugar level from all socioeconomic and geographic measures.
identified products in the Brand View datasets. To test This analysis does not provide an assessment of the
what impact this had on the results, we took the sales impact of the SDIL. Data were only available for four an-
and composition data of those brands that did have a nual time points and were insufficient to analyse how
volume stratified between diet and regular versions (n = sugar levels changed immediately before and after the
16), combined the sales data and then calculated the announcement or introduction of the SDIL, or to esti-
mean sugar levels in the same way as for products where mate the specific impact of the SDIL in comparison with
stratified sales data were not available. For these 16 the general trend of sugar reduction in soft drinks. Infer-
brands, the mean sugar content was 30% lower overall ences about the effect of the SDIL based on the in-
when compared to the sales-weighted mean sugar con- creased rate of change coincident with the introduction
tent, with much heterogeneity by individual brand. This of the SDIL should therefore be considered as tentative.
suggests that this limitation may bias the results pre-
sented here. Comparisons with other studies
The lack of granularity in the sales data also meant This is the first study to report on the impact of calls to
that the changes in the sugar content of companies’ reduce sugar in the UK by individual companies. There
product portfolios provide only an overall picture, and is a global interest in benchmarking food company’s
we were not able to distinguish what proportion of the changes towards nutrition-related goals. Two such
Table 5 Sales-weighted average sugar content of soft drinks by sugar content category, 2015–2018
Soft drink category Mean sugar content (g per 100 ml) and IQR (Q2, Q1–Q3) p
value
2015 2016 2017 2018
Total soft drinks (g/100 ml) 4.4 (2.4, 0.0–9.2) 3.9 (1.8, 0.0–7.1) 3.5 (2.1, 0.0–6.1) 2.9 (1.2, 0.0–4.3) < 0.01
High-sugar (> 8 g/100 ml) 11.0 (10.6, 10.6–11.0) 11.0 (10.6, 10.6–11.0) 11.0 (10.6, 10.6–11.0) 10.8 (10.6, 10.6–11.0) 0.58
Mid-sugar (5–8 g/100 ml) 6.4 (6.1, 5.7–7.3) 6.4 (6.3, 6.2–6.8) 6.5 (6.5, 5.9–7.4) 5.4 (5.2, 5.0–5.7) 0.15
Low-sugar (< 0.1–5 g/100 ml) 2.5 (2.3, 2.0–3.6) 2.4 (1.9, 1.4–3.9) 2.4 (2.1, 1.5–3.9) 2.2 (1.8, 1.1–2.9) 0.85
Zero-sugar (< 0.1 g/100 ml) 0.0 (0.0–0.0) 0.0 (0.0–0.0) 0.0 (0.0–0.0) 0.0 (0.0–0.0) 0.99
Exempt (g/100 ml) 10.0 (9.9, 9.6–10.2) 10.0 (9.7, 9.3–10.0) 9.7 (9.9, 9.2–10.4) 9.5 (10.0, 9.2–10.1) 0.75
Bottled water 0.0 (0.0–0.0) 0.0 (0.0–0.0) 0.0 (0.0–0.0) 0.0 (0.0–0.0) 0.99Bandy et al. BMC Medicine (2020) 18:20 Page 7 of 10 Fig. 2 Sales-weighted mean sugar content of soft drinks by product type, 2015–2018 projects, the Access to Nutrition Index [12] and INFOR- on the data provided by Kantar, a household panel MAS (International Network for Food, Obesity/NCD re- survey [15]. We report a greater total volume of soft lated Research, Monitoring and Action Support) drink purchases (8.9 vs 3.9 billion litres in 2018) than Business Impact Assessment on Obesity tool [13], have PHE. The comparatively low volumes reported by used sales data from Euromonitor to estimate a “health- PHE could be due to the underreporting of purchases fulness score” for company’s portfolios using nutrient by panel participants [16] or to overestimates of sales profiling. However, these scores cover the full range of a in Euromonitor data due to their indirect approach to company’s products and actions and are not directly estimation. Nonetheless, despite differences in the comparable with our quantitative analysis specifically of data sources, the findings are remarkably consistent. the soft drink market. The average sales-weighted mean sugar content of The findings we report here are similar to the few soft drinks reported by PHE fell by 29% between other studies that have looked at the sugar content of 2015 and 2018 with a 10% increase in the total vol- soft drinks in the UK in recent years, though only one ume sales of soft drinks. other has reported on the change in sales. A study of the sugar content in a sample of energy Implications of this research drinks in 2017 compared to 2015 (excluding zero- This study shows a 30% reduction in the sales of sugar sugar products) reported a 10% decline (10.6 g/100 ml from soft drinks in the last 4 years, equivalent to 4.6 g in 2015 vs 9.5 g/100 ml) [14]. Once adjusted to per capita per day. In order to better differentiate be- exclude zero-sugar products, our data shows the tween the impact of changes in the sugar content of absolute mean content of energy drinks fell by 30% products and changes in purchasing behaviours, we re- over the same time period, while the sales-weighted peated the analysis but kept the sugar content at 2015 mean fell by 49% (9.6 g/100 ml in 2015 to 5.9 g/100 levels. In this scenario, the total volume of sugars fell by ml in 2017). only 4%. This suggests that the majority of the reduction Public Health England (PHE) has also published in sugar sales was due to reformulation. Overall, volume data on changes in sugar from 2015 to 2018, based sales have increased while the sugar content has
Bandy et al. BMC Medicine      (2020) 18:20                                                                          Page 8 of 10

 Fig. 3 The total volume of sugars sold by top ten UK soft drink companies, 2015 and 2018

declined, which highlights the opportunity for improve-                    The marked increase in the proportion of drinks in
ments in public health to be consistent with successful                  the market classified as low sugar is encouraging.
business practices—although we recognise that volume                     However, the volume of sugar sold from products
sales are only one indicator of a company’s success.                     classified as “low-sugar” has increased by 24% from
  The rates of change in both mean sugar content and                     2015 to 2018, and the sugar content of many of these
total sugar sales seem to have been accelerated by the                   products is close to the threshold for the levy. This
announcement of the SDIL in March 2016 and its im-                       suggests that reducing the amount of sugar that
plementation in April 2018, and the sales of low-sugar                   makes it permissible to classify as a low-sugar drink
products (< 5.0 g/100 ml) that are not subject to the                    (and therefore untaxed) may prompt further reduc-
levy have increased substantially. However, this paper                   tions. The proportion of sugar sold from tax-exempt
is not an evaluation of the SDIL, and further work                       products, e.g. 100% juices, has increased (although the
using a more granular time series is currently being                     total volume has declined by 7%). Consideration could
conducted [10]. We show that six of the top ten soft                     be given to including these products in the SDIL to
drinks companies have reformulated more than 50% of                      encourage reductions in the sugar content and to sig-
SDIL-eligible products by 2018. Some companies                           nal clearly to consumers that these are high-sugar
reformulated all products, while others chose to main-                   products.
tain the sugar content of key brands. There was no                         Applying this method of combining sales data with
change in the sugar content of brands excluded from                      the nutrient composition of products to other key
the SDIL. This evidence suggests that the implementa-                    food categories included in the sugar and calorie re-
tion of the levy acted as an extra incentive for compan-                 duction targets would provide policymakers with a
ies to reformulate above and beyond what was already                     comprehensive assessment of the rate of change in
being done as part of the voluntary or consumer-                         the sales of sugar. Providing greater transparency
driven reformulation.                                                    about individual company’s responses would also
Bandy et al. BMC Medicine           (2020) 18:20                                                                                                 Page 9 of 10

  Fig. 4 The availability of soft drinks by company, 2015 and 2018. Chi-squared test: *p < 0.05, **p < 0.01

enable government, non-government organisations                                   Funding
and investors to benchmark companies, and highlight                               LKB and MR are funded by the Nuffield Department of Population Health,
                                                                                  University of Oxford. PS is funded by a BHF Intermediate Basic Science
those who are making the most, or least, change to-                               Research Fellowship (FS/15/34/31656). All authors are part of the National
wards public health nutrition goals.                                              Institute for Health Research (NIHR) Oxford Biomedical Research Centre (BRC).
                                                                                  SJ is also funded by the NIHR Collaboration for Leadership in Applied Health
                                                                                  Research and Care Oxford at Oxford Health NHS Foundation Trust and is an
Conclusion                                                                        NIHR senior investigator. PS, RAH and MR are co-applicants on an NIHR-
                                                                                  funded evaluation of the UK Soft Drinks Industry Levy (16/130/01).
This analysis provides strong evidence of reductions in
the sugar content of soft drinks, together with the
                                                                                  Availability of data and materials
changes in product portfolios and consumer purchasing                             The data that support the findings of this study are available from
patterns which have led to a substantial reduction in the                         Euromonitor International and Brand View, but restrictions apply to the
sales of sugar in soft drinks.                                                    availability of these data, which were used under licence for the current
                                                                                  study, and so are not publicly available. Data however are available from the
                                                                                  authors upon reasonable request and with permission from Euromonitor
Supplementary information                                                         International and Brand View.
Supplementary information accompanies this paper at https://doi.org/10.
1186/s12916-019-1477-4.                                                           Ethics approval and consent to participate
                                                                                  Not applicable
 Additional file 1: Figure S1. Number of individual soft drink products
 by category, 2015-2018.
                                                                                  Consent for publication
                                                                                  Not applicable
Authors’ contributions
The corresponding author attests that all listed authors meet the authorship      Competing interests
criteria and that no others meeting the criteria have been omitted. LKB acts      The authors declare that they have no competing interests.
as a guarantor; contributed to the study design, data analysis, figures and
tables and data interpretation; and wrote the first draft of the manuscript. PS   Author details
                                                                                  1
contributed to the study design, data analysis, data interpretation and            Centre on Population Approaches for NCD Prevention, Nuffield Department
manuscript preparation. RH and MR contributed to the study design and             of Population Health, University of Oxford, BDI Building, Old Road Campus,
manuscript preparation. SJ contributed to the study design, data                  Oxford OX3 7FZ, UK. 2Nuffield Department of Primary Health Care Sciences,
interpretation and manuscript preparation. All authors read and approved          Radcliffe Primary Care Building, Radcliffe Observatory Quarter, University of
the final manuscript.                                                             Oxford, Woodstock Road, Oxford OX2 6GG, UK.
Bandy et al. BMC Medicine (2020) 18:20 Page 10 of 10
Received: 23 July 2019 Accepted: 3 December 2019
References
1. Public Health England. NDNS: results from years 7 and 8 (combined). Results
of the National Diet and Nutrition Survey (NDNS) rolling programme for
2014 to 2015 and 2015 to 2016. 2018 [cited 2018 Apr 16]. Available from:
https://www.gov.uk/government/statistics/ndns-results-from-years-7-and-8-
combined
2. Ng SW, Ni Mhurchu C, Jebb SA, Popkin BM. Patterns and trends of beverage
consumption among children and adults in Great Britain, 1986-2009. Br J
Nutr. 2012;108(3):536–51 [cited 2017 Apr 26] Available from: http://www.
ncbi.nlm.nih.gov/pubmed/22186747.
3. Scientific Advisory Committee on Nutrition. SACN: Carbohydrates and
Health. 2015 [cited 2018 Apr 16]. Available from: https://assets.publishing.
service.gov.uk/government/uploads/system/uploads/attachment_data/
file/445503/SACN_Carbohydrates_and_Health.pdf
4. Tedstone A, Targett V, Owtram G, Pyne V, Allen R, Bathrellou K, et al. Sugar
reduction: achieving the 20% A technical report outlining progress to date,
guidelines for industry, 2015 baseline levels in key foods and next steps.
2017 [cited 2017 May 17]. Available from: www.gov.uk/phe
5. HM Revenue & Customs. Soft drinks industry levy - consultations - GOV.UK.
2016 [cited 2018 Apr 17]. Available from: https://www.gov.uk/government/
publications/soft-drinks-industry-levy/soft-drinks-industry-levy
6. NHS. Home | Change4Life. [cited 2019 Sep 19]. Available from: https://www.
nhs.uk/change4life#.
7. Elliott-Green A, Hyseni L, Lloyd-Williams F, Bromley H, Capewell S. Sugar-
sweetened beverages coverage in the British media: an analysis of public
health advocacy versus pro-industry messaging. BMJ Open. 2016;6:e011295.
https://doi.org/10.1136/bmjopen-2016-011295.
8. Euromonitor International. Passport soft drinks: Euromonitor International.
2017 [cited 2017 Sep 6]. Available from: http://www.euromonitor.com/
9. Office for National Statistics (ONS); United Kingdom population mid-year
estimate - Office for National Statistics. Population estimates times series
dataset. 2019 [cited 2019 Aug 23]. Available from: https://www.ons.gov.uk/
peoplepopulationandcommunity/populationandmigration/
populationestimates/timeseries/ukpop/pop
10. ISRCTN. I2017SRCTN18042742: Evaluation of the health impacts of the UK
Treasury Soft Drinks Industry Levy (SDIL). 2017 [cited 2019 Sep 24]. Available
from: http://www.isrctn.com/ISRCTN18042742
11. Bandy L, Adhikari V, Jebb S, Rayner M. The use of commercial food
purchase data for public health nutrition research: a systematic review. PLoS
One. 2019;14(1):e0210192. [cited 2019 Jan 29] Available from: http://dx.plos.
org/10.1371/journal.pone.0210192
12. ATNI. About the index | Access to Nutrition Index (ATNI). 2017 [cited 2017
Nov 19]. Available from: https://www.accesstonutrition.org/about-index
13. INFORMAS. BIA-Obesity | INFORMAS. INFORMAS - Benchmarking food
environments. 2018 [cited 2018 May 31]. Available from: http://www.
informas.org/bia-obesity/#BIAObesity%7C0
14. Hashem KM, He FJ, Jenner KH, MacGregor GA. Cross-sectional survey of the
amount of free sugars and calories in carbonated sugar-sweetened
beverages on sale in the UK. BMJ Open. 2016;6(11):e010874 [cited 2019 Jan
29] Available from: https://bmjopen.bmj.com/content/6/11/e010874#ref-31.
15. Public Health England; Sugar reduction: report on progress between 2015
and 2018 [Internet]. 2019 [cited 2019 Sep 27]. Available from: https://assets.
publishing.service.gov.uk/government/uploads/system/uploads/attachment_
data/file/832182/Sugar_reduction__Yr2_progress_report.pdf
16. Pechey R, Jebb SA, Kelly MP, Almiron-Roig E, Conde S, Nakamura R, et al.
Socioeconomic differences in purchases of more vs. less healthy foods and
beverages: analysis of over 25,000 British households in 2010. Soc Sci Med.
2013;92:22–6.
Publisher’s Note
Springer Nature remains neutral with regard to jurisdictional claims in
published maps and institutional affiliations.You can also read