REenergising Asia Assessing renewable electricity readiness among key Asian markets - CDP
←
→
Page content transcription
If your browser does not render page correctly, please read the page content below

REenergising Asia
Assessing renewable electricity readiness among
key Asian markets

                                          Supported by

October 2021
Stakeholder Contributors

    Anoop Chaudhry
    (Nomura Bank)

    Garzay Ahmedi and Sara La Sala
    (GO2 - Guarantees of Origin for New Renewable Energy)

    Gina Lisdiani
    (Allotrope Partners - Clean Energy Advisory Southeast Asia)

    Hang Dao (World Resources Institute) and Tung Ho (Allotrope
    Partners), representing Clean Energy Investment Accelerator,
    Vietnam

    Jules Chuang
    (Stonegate - Green Asset Management Asia)

    Mohamad Irwan Aman
    (Sarawak Energy, Malaysia – Utility)

    Alongside many other corporate contributors who wished to
    remain anonymous under Chatham House Rules.

2
TABLE OF CONTENTS

04   Executive Summary

06   Background and methodology

12   AREC-Index results for all 10 markets

     Qualitative summary of the RE market readiness
     of each market

     �    Mainland China
     �    Hong Kong
     �    India
     �    Indonesia
     �    Japan
     �. Malaysia
     �    Singapore
     �    South Korea
     �    Taiwan

34   Conclusion

35   Appendix
         a. About the methodology
         b. Glossary

51   References

                                                      3
EXECUTIVE SUMMARY

    Net-zero emissions cannot be reached without extensive decarbonisation of electricity.
    The International Energy Agency (IEA) estimates that this transformation would require
    renewables to rapidly expand from the current 29% to at least 90% of all electricity generation
    by 2050. How are markets in Asia rising to the challenge of optimal renewable electricity (RE)
    generation capacity? Are current market infrastructures enabling a conducive environment for
    RE generation, demand and supply? More importantly, how well placed are key Asian markets
    to meet the RE ambitions they have set for themselves to 2030 and beyond? To answer
    these questions, CDP puts the spotlight on ten RE markets in Asia to assess their transition
    towards renewables. The total annual electricity demand of these markets exceeds 11,000
    TWh, close to half of global electricity demand, making their transition central to our
    aspiration for global decarbonisation.
    This research is divided into two parts. The first involves CDP’s          The analysis suggests that, across Asian markets, there is a need
    proprietary index Asia Renewable Electricity Competitiveness Index         for robust renewable energy tracking mechanisms to establish
    (AREC-Index), to assess individual electricity markets and corporate RE    reliability and transparency in RE sourcing. Capacity building around
    sourcing practices. The results from the application of this methodology   corporate RE sourcing will remain a high priority requirement
    are intended for policymakers, financers, or corporate users of RE to      as companies on the ground remain unclear on the RE options
    understand the attractiveness of underlying RE markets based on            available to them. RE infrastructure in the identified markets needs
    the strengths and gaps in existing infrastructure. The AREC-Index          further streamlining of licensing regimes, financial incentives, and
    methodology pairs desktop research conducted by CDP with novel             aligning of provincial RE goals to national targets. Overall, markets
    use of CDP’s climate change corporate dataset of 1,170                     should consider pairing RE targets with a reduction in fossil fuel
    companies in the selected markets.              Indicators have been       subsidies to develop long-term strategies for renewables that
    developed. Twelve of these indicators explore a market’s RE policy         are aligned with Nationally Determined Contributions (NDCs).
    environment and macro-level performance, and six explore corporate
    RE sourcing behaviour.                                                     This research is an inaugural study by CDP with support from HSBC.
                                                                               CDP welcomes feedback on the AREC-Index methodology as it
    The second half of the report focuses on recommendations                   continues to expand and strengthen its market selection criteria,
    accumulated from 36 RE stakeholders in the underlying markets.             indicators and insights in subsequent research. CDP especially
    These stakeholders are participants from the energy industry, its          welcomes feedback from RE stakeholders, including policymakers
    financiers, corporate electricity consumers, and not-for-profits.          whose support is critical to CDP’s data-driven work.
    Qualitative recommendations gleaned from these participants
    primarily focus on areas of improvement they would like to see in
    market infrastructure to accelerate the growth of RE in Asia. Together
    with the AREC-Index, 10 detailed market-level assessments are
    presented. These link concrete, data-driven insights in each market
    with essential feedback from stakeholders.

4
5
BACKGROUND AND METHODOLOGY

    The scope of renewable energy discussed in this report includes all renewable energy supply
    technologies, including wind, solar, biomass, small and large hydroelectric, as well as emerging
    technologies which are produced from renewable energy sources. Power generation accounts
    for around 40% of energy-related CO21 and is a dominant contributor to adverse climate change.
    Renewables remain the energy of choice for generating electricity and reducing carbon dioxide
    and methane emissions, and play a fundamental role in reducing emissions across all economic
    sectors. A decarbonised power sector, dominated by electricity generated from renewable
    sources, is at the core of our transition to a sustainable future.

    Markets in Asia have increasingly made public announcements on RE ambitions up to 2030, some going farther and aiming for net-zero emissions
    by 2050. These goals have subsequently resulted in the development of policies that aim to provide a conducive growth environment for RE to
    play an increasingly dominant role in the overall electricity sector over the next two decades. RE progress across markets have, however, varied
    significantly across geographies. While in some markets there may be many RE supply and demand options available, in others it may be virtually
    impossible to generate or trade in RE.

    1. https://www.iea.org/reports/net-zero-by-2050
6
Anticipating upcoming policy changes, CDP observes that the                                     As the industrial and commercial sectors globally account for over
corporates are increasingly committing to procure RE and are                                    50% of total electricity consumption , trends in corporate generation,
voluntarily disclosing their RE generation and consumption patterns                             and buying and selling of RE, reveal fundamental behavioural change
through CDP’s platform. In 2019 and 2020, over 40% of new members                               effects transition. Analysing the factors that support or hinder the
joining the RE100 initiative (which commits its members to sourcing                             growth and use of RE by corporates in Asia is a crucial starting point
RE across their entire operations) were headquartered in Asia-Pacific.                          to our understanding of the ambition gaps that currently exist between
Despite these encouraging signs, it is, as yet, difficult to estimate which                     our determination and our ability to meet the goals of the 2015 Paris
market infrastructures are better positioned to meet corporate demand                           Agreement.
and supply for RE, the current infrastructure gaps that exist between
ambition and implementation, and areas where corporates are seeking
infrastructure support to further improve RE sourcing in the coming
decade.

Global corporate PPA volumes, 2010-2020
GW

Source: BloombergNEF.
                                                                                                                         23.7

                                                                                                                                APAC:9.3GW
                                                                                                                  20.1    2.9

Note: Data is through 2020, reported in MW DC                                                                      1.2
capacity. Onsite PPAs not included. Australia sleeved
PPAs are not included. Pre-market reform Mexico PPAs                                                               2.6          EMEA: 16GW
are not included. APAC number is an estimate. These                                                        13.6
figures are subject to change and may be updated as more                                                                  7.2
information is made available.
                                                                                                            2.3

                                                                                                            2.3
                                                                                                     6.2                        AMER: 51.6GW
                                                                                       4.7   4.1     1.3
                                                                                                     1.1
                                                                   1.0         2.3     0.8
                                                                                              1.1
                                       0.1       0.3        0.3          0.6
                                                                               1.5    3.4    2.3    3.9    9.1    16.3   13.6

                                      2010     2011        2012   2013         2014   2015   2016   2017   2018   2019   2020

                                                                                                                                                                         7
BACKGROUND AND
    METHODOLOGY

    In this inaugural study, CDP evaluates the interlinkages between
    policy, infrastructure and corporate RE sourcing patterns across
    10 key Asian markets. To action this research, CDP has developed
    a two-pronged approach to evaluate 10 markets in Asia to assess
    the current development of RE in the region, recognise leading RE
    markets, and establish the factors needed to catalyse the growth of RE
    in these markets. The first part of CDP’s market analysis focuses on
    the development of a competitive index, Asia Renewable Electricity
    Competitiveness Index (AREC-Index) , to analyse current ambitions,
    capacities and capabilities of the key Asian RE markets, which has
    been built on CDP’s own design principles of relevance, consistency,
    transparency, verifiability and repeatability.

    The second part of the RE market analysis involves a qualitative
    assessment with stakeholder-driven recommendations for each
    market to meet the current gaps in their RE infrastructure. This has
    involved seeking insights from 36 expert participants in the RE sector
    within each of the selected markets. Contributions and insights were
    identified through workshops and one-on-one follow-up interviews
    with utility companies, buyers and sellers of RE, consultants, and
    RE financiers, alongside not-for-profits.

    The market profiles in Section 5 highlight the recommendations, a
    to-do list of actions that each market needs to implement to
    accelerate RE implementation. Over subsequent iterations of this
    research, CDP will expand on our market selection criteria as a
    more holistic understanding of the RE market emerges across
    Asia. Crucially, CDP believes that insights from policymakers and
    their own recommendations to the non-state players in the RE
    industry will be an important extension of this in-depth market
    research that we aim to integrate into subsequent reports.

8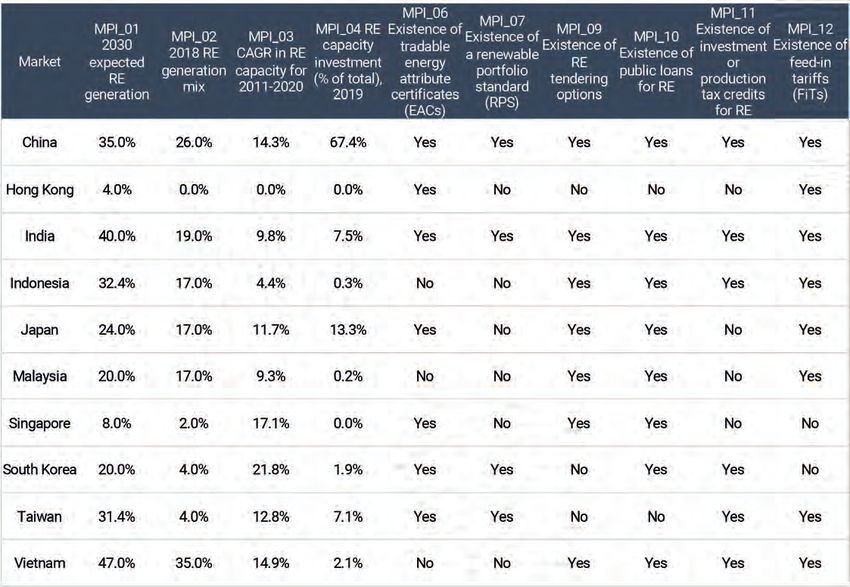
SUMMARY OF CDP’S METHODOLOGY

The ten selected markets for this report are a sample balanced between developed
and developing markets. These allow CDP to evaluate RE market progress and assess
which type of market is accelerating the fastest in terms of RE-installed capacities and the
policies needed to support them. The map in Figure 1 below shows the spread of selected
markets from East Asia, Southeast Asia, and South Asia, where RE is being developed to
replace fossil fuels by 2050 to achieve net-zero targets.

Figure 1. Selected Asian Markets

                                                                                               9
SUMMARY OF CDP’S METHODOLOGY

        Asia Renewable Electricity Competitiveness Index (AREC-Index)

        CDP’s proprietary AREC-Index puts the spotlight on the critical role that national climate/energy goals and policies play
        in energy transition and supporting the growth of corporate uptake of RE. As such, the AREC-Index is designed to “name
        and fame” markets for their current leadership in low carbon energy transition.

     Figure 2. The Nexus of Renewable Electricity Market Readiness

                                                                       Renewable
                                                                    Energy Resources

                       Key Theme
                                                                                                                    Key theme
                  Corporate Renewable                  Demand                             Policy
                       Electricity                                                                                Market & Policy

                                                                          Market
                                                                      Infrastructure

     Renewable electricity is shaped in a market by the collision of supply and demand, market
     infrastructure, and resources.
     To capture the complexity of the electricity markets and the transition    From a bottom-up perspective, we considered corporate RE sourcing
     towards RE, multiple indicators were included in the data analysis to      indicators to assess current corporate practices in each market
     provide a comprehensive sense of how electricity policy and market         based on 2020 data, as reported by 1,170 companies to CDP, the
     infrastructure supports development from both RE aggregate supply          source of the world’s largest database of primary corporate
     and demand sides. From a top-down perspective, market and policy           environmental and reporting data. These indicators track RE use
     indicators were analysed using publicly available 2019-2020 data to        across industries, voluntary RE consumption, generation-related
     provide an assessment of the market fundamentals within which the          commitments, and business models to source RE by industrial users.
     RE sector operates and are likely to develop going forward. These
     indicators combine information on national electricity and climate
     commitments; market structure with various incentives provided by
     policymakers to support renewable generation, increase its uptake of
     RE; and provide proxy macro-economic measures for each market’s
     performance.

10
Figure 3. The Renewable Electricity Market Readiness KPIs
Market and Policy Indicators (MPIs) Corporate Indicators (CIs)
� 1 2030 expected renewable electricity � 1 Total electricity consumption by
ageneration single-market corporates
� 2 2018 renewable electricity generation mix � 2 Single-market corporates’ renewable
share of total electricity consumption
� 3 CAGR in renewable electricity capacity over
2011-2020 � 3 Single-market corporates’ self-generated
renewable share of total electricity
� 4 Market investment in renewable electricity consumption
capacity in 2019
� 4 Sourcing deregulation score
� 5 Existence of renewable electricity targets
� 5 Prevalence of corporate renewable
� 6 Existence of tradable EACs electricity targets
� 7 Existence of a renewable portfolio standard � 6 Prevalence of technology type disclosure
(RPS) by single-market corporates
� 8 Existence of net metering
� 9 Existence of renewable electricity tendering
options
� 10 Existence of public loans for renewable
electricity
� 11 Existence of investment or production tax
credits for renewable electricity
� 12 Existence of feed-in tariffs (FiTs)
11AREC-INDEX
RESULTS FOR ALL
TEN MARKETS
The AREC-Index is a ranking of a
market’s performance against AREC-
Index’s component indicators. The AREC-
Index value for a market is its position
among its peers, and the AREC score
should be thought of as the tendency for
that market to be leading its peers across
the indicators.
12Table 2. AREC-Index and AREC Scores
AREC scores
India
China
Japan
Taiwan
Vietnam
South Korea
Sing apore
Indonesia
Malaysia
Hong Kong
0% 20% 40% 60% 80% 100%
The AREC-Index has two groups of component indicators: Market and Policy Indicators (MPIs),
and Corporate Indicators (CIs). Table 2 is a combination of current MPI and CI factors and reflects
the strength of market infrastructure and corporate sourcing behaviours in the identified markets.
Tables 3 and 4 show sub-rankings and sub-scores which only consider these groups of indicators.
The sub-scores are useful in developing market-specific narratives and show how the ‘nexus of
renewable electricity’ (Figure 2) takes shape in each market.
Table 3. MPI Index and MPI Scores
MPI scores
India
China
Vietnam
South Korea
Japan
Taiwan
Indonesia
Sing apore
Malaysia
Hong Kong
0% 20% 40% 60% 80% 100%
The MPI scores provide a comparative assessment of current institutional frameworks, fiscal
support mechanisms, and projected RE targets in underlying markets.
Table 4. CI-Index and CI Scores
CI scores
90%
80%
70%
60%
50%
40%
30%
20%
10%
0%
g
e
n
a
a
a
m
a
a
an
or
n
si
pa
si
re
in
di
na
Ko
ne
ay
Ch
Ko
iw
ap
In
Ja
et
al
do
Ta
g
ng
Vi
h
n
M
ut
In
Si
Ho
So
CI scores indicate corporate performance based on the data of 1,170 companies reporting to
CDP on factors such as share of RE in total electricity consumption by individual corporates, use
of RE sourcing options, RE self-generation and projected corporate RE targets.
The AREC-Index places India, Mainland China and Japan at the forefront of RE performance in
Asia. India and Mainland China dominate Asia RE if we assess per individual group, that is, MPIs
or CIs, or a combination of the two themes.
13PROFILING OF THE TOP THREE MARKETS
IN AREC-INDEX
India
AMBITIOUS RE POLICY IN TANDEM WITH CORPORATE ACTION
India is the only market in AREC-Index’s market sample to have implemented
all eight key policies studied in the MPIs. Policy continues to evolve, however.
#1
India intends to reform its electricity infrastructure over the next 10 years
to create business models at a retail level whereby off-takers can switch
suppliers to enable independent sourcing and storage, known as “shepherding,
carried and content”2. Bids from Indian utility companies are now expected to
AREC-Index position go beyond generation into battery storage plants to manage demand and
supply. Each state in India also has its own Renewable Portfolio Obligations
(RPOs), encouraging the establishment of RE targets at a state level.
86% Currently, in India, corporate consumers cannot switch suppliers easily because there is a
monopoly of state-owned distribution companies that supply power. Only a few states and cities
have private distribution companies, but it is not standard practice. The central government has
AREC Score moved ahead with hybrid wind and solar bid tariffs and bids for RE twinned with thermal power.
Foreign Direct Investment (FDI) is allowed with no official distinction between investing in foreign
and local companies. FDI flows into India are significant. Anyone can buy and sell RE in India, and
all companies pay the same energy taxes. At present, corporate consumers have an option to
source electricity via bilateral PPAs. Off-takers refer to PPA deals where the off-taker is the
company that receives RE and consumes it.
Table 5. Performance in the MPIs
14Table 6. Performance in the CIs
s
MARKET HIGHLIGHTS
� India is the only market which has
implemented all eight key policies
studied by AREC-Index.
� Second highest RE generation share
in 2030 in Asia, second only to
Vietnam.
� The Indian market is developing
corporate RE sourcing performance
facilitated through wide ranging
procurement methods and self-
generation.
CDP data also shows Indian companies leading in self-generation and
in their use of liberalized procurement methods like PPAs.
15PROFILING OF THE TOP THREE MARKETS
IN AREC-INDEX
Mainland China
RE INVESTMENT JUGGERNAUT WITH STRONG STATE-LED AMBITION
Solar energy is inexpensive in China because of a strong domestic
manufacturing industry in photovoltaics. The market is almost singlehandedly
#2
responsible for the precipitous drop in the levelised cost of energy generated
from photovoltaics in the past decade. In 2016 alone, China added more solar
capacity than the United States in the technology’s entire commercial history
until that point.
AREC-Index position
Generators also raise revenue from selling energy attribute certificates for their generation
(and can certify the same unit of generation under more than one certificate system). However,
81%
ringfenced investment funds are needed to create interest for companies working in China.
Moreover, if the Chinese economy were to open to RE FDI, there would be huge interest driven
by high local demand for electricity and the desire (at community, policymaker and foreign
investor levels) to reduce air pollution from legacy electricity generators. In addition, a new
AREC Score policy for National Renewable Energy Certificates (RECs) as opposed to provincial RECs, as is
the situation in 2021, would be an attractive revenue stream for investors.
China dominates global growth in RE, and this is reflected in its RE investment capacity, which,
as of 2019, is more than that of all key Asian markets combined.China is considered to be well
placed to gain technological competitive advantage from the transition to net-zero emissions3 .
Table 7. Performance in the MPIs
3. https://www.energy-transitions.org/publications/china-2050-a-fully-developed-rich-zero-carbon-economy/
16Table 8 Performance in the CIs
MARKET HIGHLIGHTS
� Dominates global investment in RE
capacity.
� High policy-led commitment to RE
generation, with a significant existing
renewable grid capacity.
� Corporates already procure a
significant amount of their electricity
renewably and are comfortable
Reporting corporate data shows the prevalence of strong RE targets setting targets to increase their
by companies to procure and consume RE. Page 34 identifies
recommendations in Section 5 from the RE industry on how these
renewable procurement.
ambitions can be further boosted with a focus on power purchase
agreements (PPAs) and transparency surrounding Energy Attribute
Certificates (EACs).
17PROFILING OF THE TOP THREE MARKETS
IN AREC-INDEX
Japan
LEADER IN CORPORATE RE PROCUREMENT
In Japan, self-generation and on-site PPAs are accessible. Off-site PPAs will
become accessible when the Feed-in-Premium starts in 2022. Japan started a
#3
deregulation process in 2000 and has long-standing Feed-in-Tariff (FiT)
schemes to promote and enable the growth of its local RE industry. According
to the Japanese government, deregulation of the electricity market has three
key aims:
AREC-Index position
1) Securing a stable energy supply,
2) Cutting electricity prices, and
67%
3) Expanding business opportunities for operators and the range of choices for
consumers.
AREC Score The liberalisation of the market will, in time, allow increased competition from many new market
entrants. Deregulation began by enabling extra-high voltage consumers to choose their electricity
suppliers, followed by deregulating high voltage customers to choose suppliers in 2004 and
2005.
In 2019, Japan had the second highest investment in installed RE capacity across key Asian
markets4 . Expanding on this ambition, in December 2020, Japan unveiled its 2050 low carbon
strategy which will see the share of renewables at 50-60% of electricity demand5 . Japan’s policy
rankings are lower in our estimate as compared to other markets such as Vietnam and South
Korea. This is due to absence of policies with respect to net metering, Renewable Portfolio
Standard (RPS) or tax incentives in relation to investment or production of RE.
Table 9. Performance in the MPIs
4. https://www.ren21.net/wp-content/uploads/2019/05/gsr_2020_full_report_en.pdf
5. https://asia.nikkei.com/Spotlight/Environment/Climate-Change/Japan-sets-sights-on-50-renewable-energy-by-2050
18Table 10. Performance in the CIs
MARKET HIGHLIGHTS
� Asia’s biggest corporate electricity
footprint reported to CDP.
� Second highest pool of RE
investments in AREC-Index.
� Corporates perform well generating
their own RE.
Japan has the biggest corporate RE footprint in Asia, as reported to CDP,
representing the largest potential demand signal for RE in AREC-Index’s
sample of markets. Japan also performs well in self-generation. While
the current share of RE in corporates’ overall electricity consumption
is not competitive in the index, corporates own much of their RE self-
generation (rooftop PV systems are commonplace). Japan is second
only to India in this regard. Japanese companies typically also have
good data availability regarding the energy technologies in the content
of their supplies and disclose this information to CDP.
19REFLECTIONS ON AREC-INDEX’S
METHODOLOGY AND RESULTS
Significance of What the rankings do not indicate
AREC-Index rankings
� The selected markets are ranked based � The index is mostly unaffected by market
on trends in electricity grids, size. This allows, for example, Vietnam,
investment into renewable electricity, with much smaller electricity demand
key policy, and reported corporate than India, China, or Japan, to perform
electricity sourcing behaviour. These relatively well for its progressive RE policy
dimensions have been selected as environment.
indicative of a market’s attractiveness
to investment in renewable electricity.
� The methodology is applicable to any
sample of markets and corporate
respondents.
� It is very easy to see how individual
indicators impact a market’s
position in the ranking because the
indicators are expressed in Limitations of the rankings
common units. It is easy therefore
to develop intuitive narratives and � CDP corporate disclosure data has been
recommendations for a market limited in its use because the data needed
based on its performance in the for certain indicators is not per-market.
indicators. For certain CIs, data from multinationals
cannot be considered because their data
is not collected per-market. This reduces
the sample size of respondents available
for CI assessments, and may mean that
REsourcing practices which are unique to
multinationals are not being reflected in
the Index.
� Some CIs are affected by impacts
unrelated to RE sourcing. For example,
in some markets, disclosure rates by
corporates may simply be lower.
20QUALITATIVE
SUMMARY
OF THE
RE MARKET
READINESS
OF EACH
MARKET
21QUALITATIVE SUMMARY OF THE RE
MARKET READINESS OF EACH MARKET
It is pertinent to note that no market in Asia received a perfect score across the indicators
identified under the AREC-Index. This is to be expected as markets are still enabling policies
that promote the development of the RE sector. In many of these markets, companies are yet
to fully grasp the implications of these current and upcoming regulations on the generation
and consumption of RE. Variances also exist between low carbon ambitions, RE targets and
implementation.
While AREC-Index presents data-driven results from desktop research and CDP data, its results should be complemented by evidence gathered
from actors in AREC-Index’s markets themselves. AREC-Index, for example, reveals where certain policies exist across the markets. Interviews with
actors in those markets support this knowledge with invaluable insight into how those policies are actually viewed in those markets.
Ten market summaries have been prepared as a result of these It is important to note that these industry recommendations focus on
interviews. The summaries give pragmatic recommendations from incremental improvements in RE infrastructure in the context of the
36 stakeholders for policymakers, and important information for targets that each market has set for itself. Over subsequent series of
prospective investors in each market. The summaries consider: this research, CDP would also like to incorporate views of policymakers
and areas of involvement and improvement that they would like to see
� AREC-Index’s results; and within their local RE industries.
� Input from local stakeholders against national targets for RE
acceleration, who provided their insights and recommendations Tables 1 and 2 present a subset of AREC-Index’s MPIs and CIs which
during the workshops and for some, supplemented in interviews. are particularly relevant to the stakeholder discussions. Further details
on these indicators are available in the Appendix from p.40.
Each market summary covers three elements. These are:
1. Policy ambition and key market strengths;
2. Current gaps in meeting ambition; and
3. Recommendations from stakeholders on how to bridge
the gaps
22Table 11. Selected market and policy indicators
For full data set on indicator findings of the AREC-Index, please refer to Page 35 in the Appendix.
Table 12. Selected corporate indicators
23MAINLAND CHINA
Policy ambition and key market strengths
China has pledged to increase the share of non-fossil fuels in its
primary energy consumption to 15% in 2020 from just 6.8% in 2005,
Recommendations from
with plans to increase it to 35-40% by 20306 . China aims to expand its stakeholders to bridge the gaps
total installed wind and solar capacity to 1,200 GW by 20307 . By the end
of 2020, China had 281.5 GW of wind generation capacity and 253.4 GW
of solar. Solar energy has the highest profitability because it is locally 1 China should overhaul its RE certification
produced. Asset holders may sell RE certificates to generate revenue systems. GECs should be issued exclusively
from the buyers of RE, providing an attractive RE income stream. so that no attribute aggregation is required
of GEC buyers. GECs should also be issued
to all generators rather than only those
Current gaps in meeting ambition that also receive FiTs. This could allow
CI 05 shows that over 20% of the 500+ companies in Mainland China their price to be set by market forces.
that report to CDP have RE targets. While these figures are encouraging,
CDP believes structural gaps exist which have the potential to slow
further target setting by corporates. 2 China should make PPAs more accessible.
Given the presence of multinationals, especially
Private companies operating in China find it difficult to arrange power
purchase agreements (PPAs) to procure RE directly because the
manufacturers, joint ventures with local
energy sector is highly regulated. players could make PPAs more attractive.
Although EACs are available through the Green Electricity Certificate
(GEC) system, several issues exist with their design. GECs cannot be 3 China should consider keeping FiTs for emerging
used to make credible claims of RE use because they may be one of technologies such as green hydrogen.
several certificates issued to a unit of generation (including greenhouse
gas offsets and other EAC systems available in China). This may lead
to potential double-counting of energy attributes. Buyers of GECs
must therefore hold all other attributes of generation in addition to the
GECs, in order to use GECs credibly.
GECs are also only issued to generators that receive Feed-in-Tariffs
(FiTs), government-led incentive programmes designed to promote
the uptake of renewable and low-carbon electricity generation
technologies. The GECs have a price floor equal to the FiT level and,
therefore, might not be available at their most competitive price.
However, FiTs are being phased out. While FiTs may no longer be
necessary for mature technologies, they could still be important for
emerging REs, such as hydrogen.
6. Reuters, 10 February 2021. China plans to raise minimum renewable power purchase to 40% by 2030
7. https://www.carbonbrief.org/analysis-chinas-new-2030-targets-promise-more-low-carbon-power-than-meets-the-eye
24HONG KONG
Policy ambition and key market strengths
Hong Kong considers itself, officially, to have modest RE potential and
policy ambition. These will likely increase as technologies develop. Recommendations from
Current technology could allow Hong Kong to generate 3-4% of its
electricity renewably from potential wind, solar and waste-to energy
stakeholders to bridge the gaps
resources that could be exploited between now and 20308 .
1 Hong Kong should streamline the permitting
There is good availability of feed-in tariffs in Hong Kong. Non-
governmental electricity consumers with who install distributed RE
process for land use and for electrical utility
systems at their premises with a generating capacity of up to 1 MW on-site licensing which, at present, can
are eligible for feed-in-tariffs (FiTs). These must come from either of take several months or more to achieve,
the two power companies (CLP or Hong Kong Electric) and the system
depending on the size of the project.
must be connected to that power company’s grid9. Larger systems are
also considered on a case-by-case basis. The two utility companies
have offered to issue EACs since 1 January 2019. Corporates can also
enter virtual PPAs (vPPAs) with Mainland China.
2 Hong Kong should join hands with corporates
in exploring floating solar facilities, offshore
Policymakers are developing long-term decarbonisation strategies, wind, land reclamation, and continue pursuing
such as the Clean Air Plan for Hong Kong 2035. In the Waste Blueprint
waste-to-energy technology12 . They are
for Hong Kong 2035, a plan to develop waste-to-energy technologies,
policymakers cite Hong Kong’s 2050 carbon neutrality target10. technically feasible13 and policymakers with
industry support can develop them at scale.
Current gaps in meeting ambition 3 Hong Kong should also explore newer
Hong Kong currently only generates around 1% of its electricity technologies that can overcome land
renewably.11 While offshore wind capacity is being developed, it is slowed constraints, including energy from ammonia
by lengthy permitting processes from current planning authorities. Utility
stakeholders have called for the permitting process to be streamlined.
and hydrogen.
The virtual PPAs (vPPAs) with China into which corporates in
Hong Kong can enter are equity investments in RE, but they do not
decarbonize Hong Kong’s grid itself.
8. https://www.info.gov.hk/gia/general/201910/23/P2019102300390.htm
9. https://www.gov.hk/en/residents/environment/renewable/feedintariff.htm
10. https://www.emsd.gov.hk/energyland/en/energy/energy_use/energy_scene.html
11. https://www.emsd.gov.hk/energyland/en/energy/energy_use/energy_scene.html.
12. https://re.emsd.gov.hk/english/energy/energy.html
13. https://www.tpark.hk/en/
25INDIA
Policy ambition and key market strengths
India is one of the largest FDI markets for RE investing14 and has a high
level of policy ambition, with a national target of 175 GW from RE by Recommendations from
2025 and 450 GW from RE by 203015. India’s total electricity generation
capacity stands at 383 GW (CEA, March 2021). Renewables account
stakeholders to bridge the gaps
for 37% of this capacity (25% if large hydro is excluded). The market
generated 1234 TWh of electricity in 2020-21 (April to March), of which 1 As a priority, India needs to address the
about 12% of generation is from renewable energy sources.16 financial health of DISCOMs through greater
operational efficiency and financial assistance.
Policy support and institutional frameworks are crucial in encouraging
investment in the renewable energy sector in India. This has resulted
in dedicated market institutions such as The Ministry of New and
Renewable Energy (MNRE) - a nodal agency of the Government of
2 Visibility for Open Access charges should
India; Solar Energy Corporation of India Limited (SECI) – a government- be provided for 5 - 10 years as frequent
owned enterprise that facilitates the implementation of renewable changes to Open Access charges creates
energy projects, including the National Solar Mission (NSM); and uncertainty in the RE market and discourages
The Indian Renewable Energy Development Agency (IREDA) – a
non-banking financial institution who work towards the promotion of long-term investment in new RE capacity.
renewable energy.
3 Individual states should set sub-national
Current gaps in meeting ambition targets in line with national ambitions for
Both the central government and state governments are responsible
a more cohesive roll-out of RE policies as
for policy for and regulation of the electricity sector. While this well as focus on ease of doing RE business
decentralisation between national and state regulations suits some by streamlining land acquisition and set-up
functions of energy policy, it can result in misalignment between
processes to remove inefficiency caused by
the two. It is particularly the case of inter-state open access (inter-
state PPAs), especially between non-utility buyers. Within the lengthy permitting and licensing for RE.
states, regulatory provisions like Open Access, which provide non-
discriminatory provision for the use of transmission lines/distribution
systems for corporate buyers to procure electricity under the
bilateral PPA, need streamlining. Open Access regulations must be
made more coherent for corporations to better use bilateral PPAs.
Electricity distribution companies (DISCOMs) are key stakeholders
in India’s RE sector. They are the key buyers of RE and also
facilitate bilateral transactions of RE through the open access
mechanism. The poor financial health of state-owned DISCOMs
is adversely impacting the RE sector as a whole. For example,
there are increasing delays in the payment to RE generators
by DISCOMs and in granting open access for bilateral PPAs.
The Electricity Act 2003 and the National Tariff Policy 2006
put Renewable Purchase Obligations (RPOs) on the DISCOMs
and Open Access customers (known as obligated entities). The
2020 national RPO was 20%, with a higher target expected to be
introduced. However, national RPOs have not translated well at
state level. State RPOs are defined according to the RE generation
potential of states. A RPO is also a consumption target, not a
generation target. States with low RE potential can have ambitious
RPO targets and meet them via procuring RE from RE-rich states.
However, at present, states with low RE potential have developed
less ambitious targets instead of innovating on RE trade practices
with other states. This has created less demand for RE. Further,
enforcement of RPO across states is also a key issue. State-owned
DISCOMs are debt-ridden and find it difficult to pay for RE to meet
their RPOs.
14. https://www.weforum.org/agenda/2020/01/india-new-hotspot-renewable-energy-investors/
15. https://www.investindia.gov.in/sector/renewable-energy
26INDONESIA
Policy ambition and key market strengths
Indonesia recently announced bold plans to increase the proportion
of its RE to at least 48% of overall power by 2030 . Simultaneously, Recommendations from
the market’s state-owned utility, Perusahaan Listrik Negara (PLN),
announced its intention to become carbon neutral by 2050, signalling stakeholders to bridge the gaps
the determination to move away from its current dependency on fossil
fuels . Indonesia currently uses less than 2% of its renewables’ potential 1 Indonesia should consider setting up a cross-
and, with its abundance of solar and tidal energy, remains uniquely well ministerial agency to establish a cohesive
placed, resource-wise, to meet its RE commitments.
RE policy that will demonstrate consistent
direction to implement its RE commitments.
Implementation plans should consider a
one-stop-shop licensing and monitoring
Current gaps in meeting ambition regime for PE projects as well as validate
While Indonesia has announced its commitments to RE, a lack of current and upcoming procurement options.
synchronised, stable RE regulation has stymied the growth for RE
funding and demand. Different ministries and administrative units
approach RE mandates from diverse perspectives, which does not 2 Currently, no corporate RE sourcing options
necessarily lead to a cohesive approach for RE uptake in the market.
Licensing of RE projects, procurement options and RE contracts are
are available other than off-grid and on-site
also at nascent stages as utility companies, financiers and corporates self-generation. Provisions for the bilateral
navigate a sometimes challenging RE policy landscape. transaction of electricity is recommended
through providing access to the electricity
grid and necessary supportive policy.
3 While the recommendations above may
take longer to streamline, as an intermediate
step, Indonesia should encourage stronger
collaboration between utilities such as PLN and
independent power producers (IPP). It should
also revisit the tariffs established in 2017-2018
to improve uptake of partnerships between
PLN-IPPs and revive the growth of IPPs in the
market.
27JAPAN
Policy ambition and key market strengths
Japan’s Green Growth Strategy provides for substantial expansion of
renewables, accounting for 50-60% of overall electricity demand by
Recommendations from
205017 . In the near term, this would mean renewable power to increase stakeholders to bridge the gaps
from 19% to 24% by 203018. One of the notable features of Japan’s
renewables’ strategy is its commitment to double the share of solar 1 Reconsider the grid connectivity rule that
and other RE sources in its power grid and reduce the share of coal to
less than half by 2030. The Japanese government has been actively
presently prioritises coal and nuclear over RE. If
reforming the electricity market since 2011, including the electricity bill it is not possible to deprioritise coal and nuclear,
in 2020 which aims to spur greater investments in transmission and CDP recommends that Japan consider RE on
distributed networks. an equal footing for grid access to improve
the competitiveness of RE in the market.
Current gaps in meeting ambition
2 CDP welcomes the focus on new technologies
Despite its large-scale deregulation reforms since 2000, Japan remains
such as hydrogen, as identified in the
dependent on fossil fuels as its primary energy supply19 . Structural
issues surrounding land use have also limited the uptake of RE. For Green Growth Strategy. In the interim, as
example, local governments have introduced new rules restricting these technologies evolve, stakeholders
large-scale solar power plants for environmental and scenery reasons. also recommend Japan’s utilities consider
Obtaining consensus and permission from the local communities will
investments in existing technologies that
also be an issue due to historic opposition to onshore wind projects
when the turbines are close to residential areas. provide a precise prediction of output for variable
renewables. The focus on these interim and long-
More importantly, however, Japan does not provide prioritised access term technology solutions may help alleviate
to the grid for RE. As per the Electricity Business Act, existing power
plants, for example, nuclear and coal-fired power plants, are given
some of the current issues limiting uptake of
priority in Japan (“first come basis”). This limits the opportunities RE, especially surrounding land use constraints.
for RE producers to grid access. On corporate RE sourcing, there
are options available for corporates such as self-generation, green
electricity products offered by electricity retailers and energy attribute 3 Currently, direct purchase of RE in Japan
certificates (through three systems, i.e., Non-Fossil Fuel Certificate, through power purchase agreements (PPAs)
Green Electricity Certificate and J-Credit for Renewables).
is only possible through tri-party contracts,
Non-Fossil Fuel Certificates (NFCs) are currently being issued for the i.e., generator, retailer and consumer. However,
RE generated from power plants connected to the grid and selling high wheeling costs – the amount charged by
power to utilities at Feed-in-Tariff (NFC FiT). The government is also
transmission owners for use of its systems –
in the process of issuing NFCs to non-FiT Renewables. Currently,
NFCs are not properly tracked from the point of generation to the make such contracts unviable. Through our
point of consumption. Energy Attribute Certificates (EACs) should consultation process with stakeholders, it was
be tracked electronically through a tracking system, which increases suggested that the Japanese government
robustness and enables credible RE usage claims by the users.
undertake a pilot project to explore ways to
reduce wheeling costs and determine operating
models that will result in more viable PPAs.
4 RE use claims must be substantiated by
attributes that have been reliably tracked
from a generator to a consumer. Therefore, it
is recommended that a nationwide tracking
system should be adopted in Japan for all RE
being generated and consumed.
17. IEA. 2021. https://iea.blob.core.windows.net/assets/3470b395-cfdd-44a9-9184-0537cf069c3d/Japan2021_EnergyPolicyReview.pdf
18. https://www.power-technology.com/comment/japan-power-2021-2030/
19. https://renewablesnow.com/news/japan-to-lift-2030-renewables-goal-to-36-38-cut-fossil-fuels-748374/
28MALAYSIA
Policy ambition and key market strengths
The Malaysian government has revised its initial 2025 target of 20% Recommendations from
installed capacity to 31%, further raising this to 40% by 2035. It also
estimated that solar would contribute to the majority of Malaysia’s stakeholders to bridge the gaps
RE mix and introduced the ambition to install battery energy storage
systems from 203020 . If these targets are achieved, carbon emissions 1 Capacity building for corporates to
in the power sector will be reduced by 60% from 2005 levels (see
understand options to source RE as well
footnote below:). Malaysia has historically run annual tenders to help
achieve renewable generation targets of 7 GWh by 2025. Electricity as the competitive advantages to access
tenders issued by the Malaysian Sustainable Energy Development RE over other power sources is key to
Authority for solar, biogas, and small hydropower projects have driven improving RE demand in Malaysia. The
the development of RE, in addition to providing fiscal incentives to
boost RE generation. 21
Joint Committee for Climate Change (JC3), a
cross-sector agency set up in Malaysia and
Current gaps in meeting ambition co-chaired by Securities Commission (SC)
and Bank Negara Malaysia (BNM), could be
Whilst national policies demonstrate the progress being made in
particularly instrumental in capacity building
market development, CDP’s data shows low uptake of RE in Malaysia
among corporates. Corporates also do not enter PPAs or self-generate as this would link with the many initiatives
RE, preferring instead RECs (Malaysia’s system for energy attribute that JC3 is already implementing locally for
certificates). Certification of RE generation is currently voluntary in corporates. This will also assist in promoting
Malaysia, so the quality of RECs depends on the diligence of issuers.
This raises concerns over possible double-counting RE generation or
a dialogue on RE financing.
consumption. Certain RE generators in Malaysia use palm oil biogas,
which, while inexpensive, has potentially adverse ecological impacts.
2 Stakeholders also recommend streamlining
licensing and permit processes to accelerate
RE demand, supply and increased grid
connectivity in the market. This would
also ensure RE options such as PPAs and
self-generation are used in addition to
unbundled energy attribute certificates (EAC).
3 RE generated from palm oil biogas has
ecological footprints characteristically
different in comparison to other RE sources. If
used, CDP recommends the energy attribute
certificates (EACs) clearly mention the RE
source and technology used so buyers
understand the type of RE they purchase.
20. https://www.mida.gov.my/mida-news/malaysia-aims-31-re-capacity-by-2025/
21. https://www.st.gov.my/contents/files/download/112/Energy_Malaysia_18_(Online).pdf
29SINGAPORE
Policy ambition and key market strengths
Singapore’s Green Plan charts ambitious targets over the next 10
years, strengthening previous commitments made under the UN’s
Recommendations from
2030 Sustainable Development Agenda and the 2015 Paris Agreement. stakeholders to bridge the gaps
The Green Plan will increase solar energy capacity to 1.5 GWp by
2025 and 2 GWp by 2030 (it was 352 MWp at the end of 2019). The
Singapore government is currently examining the use of hydrogen and Singapore remains one of the most challenging
carbon capture, utilisation, and storage technologies22 . Policymakers
markets for RE, given its land constraints.
recognise that new technology will play an important role in developing
Singapore’s RE capacity: current technologies’ land requirements put Speaking with stakeholders, we believe this
the market at a significant disadvantage. market is exploring possible short and long-
term avenues currently available to improve
its RE capacity.
Current gaps in meeting ambition
Renewable electricity is currently very expensive for corporates to 1 We agree on Singapore’s Green Plan focus
actively source. There is also a distinct supply shortage of EACs due to assess and prioritise emerging RE
to lack of sufficient installed RE generation capacity primarily related
technologies such as hydrogen, which are
to land constraints.
not limited in capacity by the available land.
Voluntary procurement of RE has significant constraints in Singapore
due to the unavailability of RE resources. Corporates are exploring
options to buy RE from neighbouring markets such as Malaysia. 2 For market-based reporting and reporting
However, due to the lack of harmonised electricity markets, corporates requirements of initiatives like RE100, the ability
do not have credible RE sourcing options to secure consumer claims
to demonstrate and claim use or delivery of RE
associated with direct RE usage.
on a shared electricity distribution network (grid)
is crucial. This can be achieved if Singapore
expands its market boundary by joining its
electricity market with other neighbouring
markets through a harmonised regulatory
framework, inter-market grid connectivity, and
recognition of each other’s market instruments.
3 Singapore is already in negotiations with
ASEAN on power integration projects with
greater access to RE. We recommend that
Singapore also considers the harmonised
ASEAN regulatory framework needed for a
single RE market to form.
30SOUTH KOREA
Policy ambition and key market strengths
South Korea aims to increase its RE capacity by 77.8 GW by 203423 .
This is nearly four times its existing RE capacity. South Korea’s recent
Recommendations from
Green New Deal has also made near-term targets more ambitious: a stakeholders to bridge the gaps
previous target of adding 29.9 GW24 in solar and wind power by 2025
has been increased to 42.7 GW . The market’s Hydrogen Economy Act,
which came into force in February 2021, is the first of its kind globally. 1 To improve RE technology options in South
It is already associated with significant private sector investment in Korea, we recommend the market consider
hydrogen25. buddying programmes between foreign and
local partners (through international chambers
In 2004, unsuccessful investments in solar energy led to changes in
the energy technologies considered for development by policymakers of commerce or joint ventures), which could
in South Korea. According to stakeholder interviews, the investment create opportunities for corporations to find
outlook for RE in South Korea26 has since improved. State-owned international finance and technology backing.
enterprises (SOEs) are viewed by financial stakeholders as good
business operators. This is not expected to change, meaning
deregulation of the electricity market is not expected or desired. While
2 South Korea should consider setting up
the pathway for foreign investment in RE is still unclear, private finance
is available from domestic financial institutions. standardised PPAs. This would also help
provide a better understanding of the trigger
Current gaps in meeting ambition events for defaults and compensation for the
interruption to an agreed supply. South Korea
South Korea’s geography limits its potential to develop onshore solar
and wind power. Changes to land use risk displacing farming. Foreign should also consider hedging mechanisms
direct investment in RE capacity remains a challenge in South Korea. for RE generators and consumers to better
adapt to changes in law and tax regimes.
Only 3% of South Korean companies that responded to CDP report
any sourcing of RE using PPAs. For those companies, most of their
electricity use still comes from other procurement methods. PPAs in
3 For RE generators to connect to the power
South Korea are not standardised or bankable, with high default rates.
Generators experience financial losses from hedging against prices grid, we recommend South Korea considers
and the changing tax landscape. the shallow allocation of connection costs.
This involves allocating expenses related to the
network connection required by the generator
and will assist in reducing the level of financial
risks that generators currently undertake.
23.http://taiyangnews.info/markets/south-korea-to-aim-for-42-re-share-by-2034/
24. https://www.rapidtransition.org/stories/building-back-better-south-korea-shows-the-challenge-and-opportunity-of-green-stimulus-spending-for-covid-recovery/
25.https://ihsmarkit.com/research-analysis/south-korean-conglomerates-to-invest-38-billion-to-boost-hydro.html
26. http://www.koreaherald.com/view.php?ud=20200412000143
31TAIWAN
Policy ambition and key market strengths
Taiwan has a target to generate 20% of its electricity renewably by 2025.
FiTs have been available since the 2009 Taiwan Renewable Energy Act. Recommendations from
They have added 2 to 3 GW in solar capacity, 400 MW of onshore wind stakeholders to bridge the gaps
capacity. 5 GW of offshore wind capacity is in development. As with
several other developed markets in the region, land use is constrained,
making offshore wind a focus for policy. While an overall renewable 1 Policy interventions in the past, for example, with
energy target does not exist past 2025, Taiwan plans to add 1.5 GW wind power, have shown that Taiwan can move
in offshore wind capacity per year between 2026 and 2035, for a total
fast to introduce different RE technologies.
capacity of 21 GW by 2035.27
Similarly, we recommend Taiwan considers
accelerating the administrative process to
provide a common agency for RE approvals as
Current gaps in meeting ambition approval responsibilities are currently spread
Policymakers are liberalising the energy market. It is now possible across numerous ministries and agencies.
for off-takers to source RE without ceilings to their volumes. Taiwan’s
market allows for foreign investment and, over time, has led to the
availability of well-trained human resources with strong technical 2 We recommend Taiwan considers mechanisms
capabilities. RE demand in Taiwan remains high due to mandatory to phase out subsidies such as FiTs for mature
demand created through RPS. The market also has a stable market
for voluntary RE demand. However, on the supply side, RE players face technologies, including wind and solar, to
a significant administrative burden. Similar to other markets such as encourage economic efficiency and competitive
India and Japan, land issues for the development of RE can be locally pricing, especially for PPAs and green tariffs.
challenging for large-scale development.
3 Over the long term, and considering technical
capabilities in the market, Taiwan may consider
becoming a hub for emerging technologies in
the region.
32VIETNAM
Policy ambition and key market strengths
Policymakers have plans to scale up RE, but electricity and environment
stakeholders look forward to greater ambitions. Wind and solar Recommendations from
capacity additions substantially exceeded their 2017-2019 targets.
Installed capacity for wind and solar is already more than 10 GW, driven
stakeholders to bridge the gaps
by utilities and rooftop solar. Policymakers did not predict this level of
growth, so the 2020-2030 target has lowered ambitions as Vietnam’s 1 Stakeholders recommend that Vietnam
transmission lines are at full capacity or overloaded28. The new wind addresses the issue of the high cost of capital
target is 18-19 GW by 2030, and 19-20 GW for solar.29
for RE projects. One area of consideration
With an inviting market for buying and selling RE, and a grid to support would be for Vietnam to set up a government-
these markets, stakeholders look forward to a well-designed roadmap backed fund for PPAs to improve bankability
for RE. There is support for corporate buyers to procure more RE, but and attract more efficient types of financing.
policymakers need to classify the different types of RE scales between
self-generation vs. utility level.
2 Considering its ambitious targets, one area
of consideration for Vietnam is establishing
Current gaps in meeting ambition Energy Attribute Certificates (EACs) and
developing a robust tracking system.
The state owns the national grid, making it a difficult environment for
independent power providers (IPPs) to operate in. The government is
piloting independent power producers, but state ownership and the
limited capacity of the grid curtails uptake of RE. The government is
3 Vietnam recently approved legislation to improve
announcing a new RE market purchasing scheme of direct PPAs from its grid capacity to accommodate renewables30.
the national grid. This is because “virtual PPAs” that dictate increases While expansion of transmission lines is a much-
in the electricity grid to overcome bottlenecks in wind and solar
needed solution to absorb RE, in the short term,
oversupply are not yet able to supply. However, stakeholders believe
that it may be possible to source offsite RE via direct PPA financing. we recommend Vietnam considers allowing
self-generation for corporates to maintain its
Bankability of PPAs in Vietnam is another challenge for RE participants RE targets.
as costs remain high due to governing laws, lack of international
arbitration and difficulties with accessing international finance.
28. US Energy Information Administration (EIA). https://www.eia.gov/todayinenergy/detail.php?id=48176
29. https://www.eco-business.com/news/renewables-are-booming-in-vietnam-will-the-upswing-last/
33You can also read