Electrochemical Determination of Hydrogen Entry to HSLA Steel during Pickling
←
→
Page content transcription
If your browser does not render page correctly, please read the page content below
Hindawi
Advances in Materials Science and Engineering
Volume 2018, Article ID 3676598, 7 pages
https://doi.org/10.1155/2018/3676598

Research Article
Electrochemical Determination of Hydrogen Entry to HSLA
Steel during Pickling

          Jari Aromaa , Antero Pehkonen, Sönke Schmachtel, Istvan Galfi, and Olof Forsén
          Department of Chemical Engineering and Metallurgy, School of Chemical Technology, Aalto University, P.O. Box 16200,
          Aalto 00076, Finland

          Correspondence should be addressed to Jari Aromaa; jari.aromaa@aalto.fi

          Received 3 November 2017; Accepted 23 January 2018; Published 7 March 2018

          Academic Editor: Jun Liu

          Copyright © 2018 Jari Aromaa et al. This is an open access article distributed under the Creative Commons Attribution License,
          which permits unrestricted use, distribution, and reproduction in any medium, provided the original work is properly cited.
          Pickling with hydrochloric acid is a standard method to clean steel surfaces before hot-dip galvanizing. When normal low strength
          steels are pickled, hydrogen formed in pickling reactions does not have any significant harmful effect on the mechanical properties
          of steel. However, in pickling of steels with higher strength, the penetration of hydrogen into the steel may cause severe damages.
          The effect of pickling of high-strength low-alloy (HSLA) steels was investigated using a cell construction based on the Devanathan-
          Stachurski method with modified anodic surface treatment and hydrogen production using acid. The penetration and the
          permeability of hydrogen were measured using an electrochemical cell with hydrochloric acid on the one side of the steel sample
          and a solution of NaOH on the other side. No protective coating, for example, palladium on the anodic side of the sample, is
          needed. The penetration rate of hydrogen into the steel and exit rate from the steel were lower for higher strength steel.

1. Introduction                                                         be absorbed in the steel during the pickling stage through
                                                                        contact with the hydrochloric acid which oxidizes the metal
The number and the applications of new high-strength low-               and forms adsorbed hydrogen that partly enters the metal
alloy (HSLA) steels with enhanced formability are constantly            lattice. After hot-dip galvanizing, the zinc layer prevents or
increasing. It is generally accepted that the transition from           delays the exit of the hydrogen from the steel [4]. Steels with
mild steel to HSLA steel occurs at yield strength of about              tensile strength at the level of 800–1000 MPa or higher are
300 MPa. These steels have the potential to introduce weight            considered to be the most susceptible ones to hydrogen
savings while improving performance. Depending on design,               embrittlement [5, 6]. The majority of steels have generally
the higher strength can evolve into better fatigue and crash            tensile strength in the range of 200–450 MPa, and they are
performance, while maintaining or even reducing required                apparently not subject to hydrogen embrittlement problems.
material thickness [1]. However, HSLA steels may also give              Special consideration must be given to high strength steels, if
rise to some risks. For example, under certain circumstances,           they are required to be pickled [3].
hydrogen introduced into steel during its manufacture,                       Inhibitors are used to prevent pitting of steel surface in
subsequent component fabrication, or in service may result in           case of overpickling. They also minimize the dissolution of
brittle failures at applied stresses far below the yield strength       iron, decrease the acid consumption, and lower the formation
or the nominal design stress for the materials [2].                     of harmful fumes. Normally, inhibitors provide good pro-
    In this paper, we have studied hydrogen intrusion to                tection against hydrogen absorption during acid cleaning. It is
HSLA steels during acid pickling to remove surface films                 known that inhibitors such as benzotriazole obstruct or de-
before hot-dip galvanizing. The electrolytically produced               crease the diffusion of atomic hydrogen into the steel. In
hydrogen that penetrates into metal lattice can originate               addition, some nitrogen bearing organic compounds such as
from corrosion, pickling, or electroplating [3]. In the pre-            imidazoline have been found to be highly effective inhibitors
treatment of the hot-dip galvanizing process, hydrogen may              of hydrogen penetration into low carbon steels [2, 7].
2                                                                                  Advances in Materials Science and Engineering

            Pt                  SCE                                         Pt                SCE

                     NaOH                            Empty                          NaOH                                 Acid

                                                                                                                   2H+ + 2e– = H2

                                                                                            H = H+ + e–            Hads diffusion

      Fe + 2OH– = Fe(OH)2 + 2e–                                         Fe + 2OH– = Fe(OH)2 + 2e–                  Fe = Fe2+ + 2e–
      3Fe(OH)2 = Fe3O4 + H2 + H2O                                       3Fe(OH)2 = Fe3O4 + H2 + H2O
           Anode                          Sample   Cathode                Anode                           Sample     Cathode
           compartment                             compartment            compartment                               compartment
                                    (a)                                                           (b)

Figure 1: Schematic setup of the test cell with anodic and cathodic reactions at passivation and permeation test stages. Pt is platinum
counterelectrode, and SCE is saturated calomel reference electrode. (a) During passivation. (b) During testing.

    The Devanathan-Stachurski method is the most fre-                hydrogen atoms could be incomplete due to the presence of
quently utilized technique to measure the hydrogen per-              an oxide film that could build up on a metal sample when
meation in metals. Hydrogen is produced on the cathodic side         anodically polarised in an alkaline medium. The oxide film
of the double cell using cathodic polarisation. Part of this         acts as a barrier against hydrogen release. According to
hydrogen diffuses through the sample, and on the anodic side         Manolatos et al. [11], without a palladium coating on the exit
exiting hydrogen atoms are oxidized by applying an anodic            side of the sample the surface phenomena are not controlling
current. Thickness of steel samples in hydrogen permeation           and the passive layer on the exit side changes with time
experiment is typically 0.3–1.0 mm. Galvanostatic current            preventing stabilization of the hydrogen concentration on the
to produce hydrogen has varied from 0.05 to 100 mA/cm2               exit side, and therefore stationary conditions cannot be ob-
[8–10]. The aim of this investigation was to measure the             tained. This is the reason why most of the investigations have
permeation of hydrogen through HSLA steels using the                 been carried out using palladium coating. The variation in
Devanathan-Stachurski method with modified anodic sur-               hydrogen concentration is observed as the nonsteady state of
face treatment and hydrogen production using acid. The               the charging current curve. However, it is possible to obtain
permeation is commonly studied using external polarisation           reproducible results by controlling the parameters related to
to produce the hydrogen, but we used the pickling acid as the        the formation of the passive layer [11]. Our approach was to
hydrogen source. The samples had no Pd coating on the exit           use long passivation times and subtract the steady passive
surface, but the exit surface was passivated potentiostatically      current from hydrogen oxidation transient currents.
using NaOH before permeation measurements. Passivation                   The charging of steel with hydrogen is usually done
was done to produce a steady background current on the steel.        electrolytically or in hydrogen-containing atmosphere (cf.
A schematic diagram on the reactions and phenomena during            [12]), and the gaseous charging and electrolytic charging are
the measurements is shown in Figure 1. In the anodic                 considered equivalent. Identical setup with freely corroding
compartment, steel is first dissolved and passivated at              charging side has been used, for example, in [13] to study the
a constant potential. The cathodic compartment is empty              effect of pickling inhibitors for hydrochloric acid and in
during the passivation stage. During the permeation tests in         [14, 15] to study corrosion of pipeline steels. In [13], the effect
the cathodic compartment, steel is corroded by acid at the free      of inhibitors on hydrogen permeation was calculated by
corrosion potential, and part of the produced hydrogen enters        comparing permeation current with and without inhibitor.
the steel diffusing to the exit surface in the anode compart-        In [14], the permeation current was used to evaluate the
ment. When hydrogen diffuses through the steel, hydrogen             effect of additives and corrosion films on hydrogen ab-
evolution begins on the anodic surface and this is detected as       sorption. In [15], the permeation current increased when the
current increase.                                                    H2S concentration in hydrogen entry environment in-
    Usually the anodic side of the steel sample is coated with       creased. These examples indicate that use of freely corroding
palladium to ensure a uniform surface and to minimize the            surface can be used to charge steel with hydrogen. In our
anodic dissolution of the metal during permeation current            work, the permeation of hydrogen was investigated using
measurements. Palladium film favours the kinetics of hy-             1–4 mm thick steel samples, and several analysis methods
drogen oxidation. Without Pd layer, the oxidation of                 were applied for estimating the diffusion coefficients.
Advances in Materials Science and Engineering 3
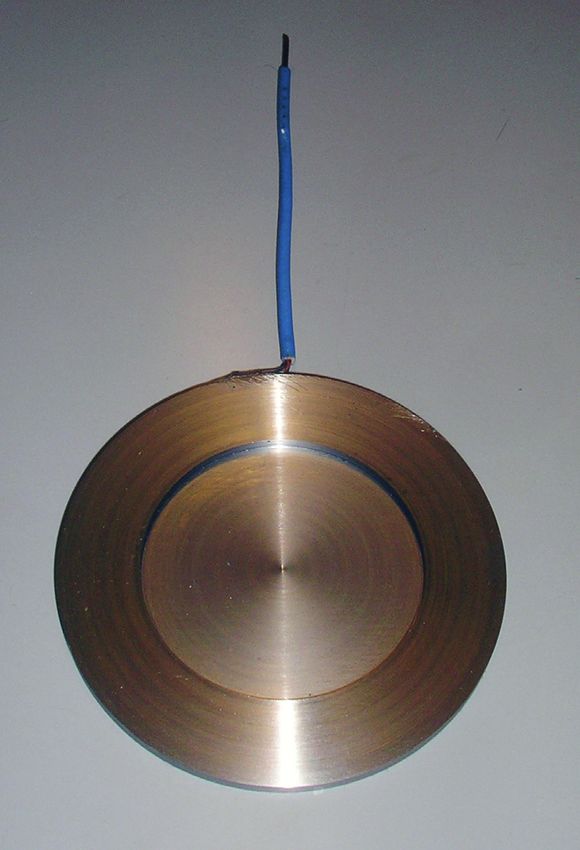
Figure 2: Test cell for permeation experiments, with compartment
with pickling solution on the right side and 0.2 M NaOH on the
left side.
Figure 3: Test sample after turning. The middle part is for hy-
drogen permeation and the machined side was in the hydrogen
evolving side.
Table 1: Chemical compositions of steels used in experiments.
Steel grade Cmax Simax Mnmax Pmax Smax Almin CEVmax
After thickness adjustment, the anodic surface of the
S355 0.12 0.50 1.50 0.025 0.020 0.015 0.39
S500 0.12 0.50 1.70 0.025 0.015 0.015 0.43
sample was ground with emery paper (grade 400) followed
S700 0.12 0.60 2.10 0.025 0.015 0.015 0.41 by washing in citric acid just before electrochemical ex-
S900 0.20 0.60 2.20 0.025 0.010 0.015 0.57 periments. No coating was used on the anodic side of the
S235 0.17 — 1.40 0.035 0.035 — 0.35 sample.
The anodic potential in potentiostatic permeation ex-
periments was determined by potentiodynamic polarisation
2. Experimental measurements for carbon steel S235 and S700 in 0.2 M
NaOH solution at room temperature. Anodic polarisation
A double-compartment test cell was constructed to measure curve from the open circuit was measured with a potential
the permeation of hydrogen through steel (Figure 2). Ma- sweep rate 100 mV/min.
terial of this double cell was Teflon, and the steel sample was Hydrochloric acid diluted to 16.5% (5.4 M) was used in
installed between the two separate cells. The electrochemical the permeation measurements to produce hydrogen on steel
tests were done using Autolab PGSTAT30 Potentiostat with surface. The acid was used both without dissolved iron and
Autolab Software 4.9. with Fe2+ concentrations 14 g/L (0.25 M) and 45 g/L (0.8 M)
Test materials were high-strength low-alloy (HSLA) steels to simulate a used pickling bath. Iron was added as
with yield strength of 355, 500, 700, and 900 MPa. Samples for FeCl2·4H2O. Temperature of the solution was 20°C. The
experiments were cut from rectangular hollow sections 50 mm sample was installed between the two compartments of
wide with 6 mm material thickness. The material in these the cell, and 1 L of 0.2 M NaOH solution was added into the
hollow sections is hardened, hot-rolled steel, and corresponding anodic side of the test cell. Thereafter, sample was polarised
grade carbon steel S235 was used as a reference material. The to a potential of 0 mV versus SCE to form a passive layer on
tensile strength of this steel is 235 MPa. Chemical compositions the surface, and the current was measured up to steady state
of test materials are shown in Table 1. CEV (carbon equivalent situation (about 15 h). The passive film in alkaline solution is
for estimation of steel weldability) values calculated using usually magnetite [16, 17]. The passivation procedure causes
CEV � C + Mn/6 + (Cr + Mo + V)/5 + (Ni + Cu)/15 were taken initially an increase in the current due to the corrosion of the
for small material thicknesses used in this study. The ana- steel when the oxide layer is formed, and this current de-
lyses and material properties were supplied by the manu- creases with time as the passive film reaches a steady state. In
facturer and referred to general product qualities. the passive state, steel dissolves, but at a low and constant
The surface area of the sample that was in contact with rate. When the passive film had reached a steady state,
solution was 19.6 cm2. The thickness of the sample area hydrochloric acid (1 L) was introduced in the cathodic
exposed to the solutions was reduced by turning (Figure 3). compartment. When hydrogen started to diffuse to the exit
The thickness of exposed sample area varied from 1 to 4 mm. side a current increase was seen. When the current reached
4                                                                                               Advances in Materials Science and Engineering

             102                                                                        8

             101                                                                        6

                                                                           i (μA/cm2)
i (µA/cm2)

             100                                                                        4                         HCI removal

                                                                                                          HCI addition
             10–1                                                                       2

             10–2                                                                       0
                    –400   –200   0     200     400    600   800   1000                     0        10         20          30       40
                                   E (mV versus SCE)                                                              t (h)

Figure 4: The polarisation curve of carbon steel S253 in 0.2 M            Figure 5: A typical current density versus time curve measurement
NaOH at 20°C.                                                             in passivation and permeation experiment in 16.5% HCl for
                                                                          steel S355.

a steady maximum level, the acid was removed through the
bottom valve, and after some time, a decrease of the anodic                    A typical current density versus time curve in an ex-
current was observed. During the whole measurement, the                   periment on steel S355 is shown in Figure 5. The current is
anodic side of the sample was kept at constant potential. In              related only to the reaction rates on the steel surface in the
the beginning of the test, the current was due to anodic                  anodic compartment containing NaOH. A high current
oxidation and passivation of steel. Oxidation of hydrogen                 density is observed at the beginning of the experiment, when
that had diffused to exit side was seen as current increase.              the steel surface is still in active state, and much lower
When hydrogen was stopped by removing the acid, current                   current density of about 0.3 µA/cm2 was reached when the
started to decrease and reached finally the same passive                  steel passivates. Hydrochloric acid was added on the ca-
current level as before the introduction of acid. This                    thodic side of the cell after 18 h when the anodic surface had
background current is subtracted from the current measured                reached the passive state. After a delay of over two hours, an
during the permeation measurements. Thus, the effect of                   increase in the current was seen in the anodic compartment.
only hydrogen diffusion on the current could be observed.                 This current increase is due to hydrogen that had diffused
    To increase the uptake of hydrogen into the metal, re-                through the steel and was oxidized on the anodic side. A
combination poisons such as arsenic, hydrogen sulphide,                   steady maximum was observed after about 5 h from the acid
and thiourea can be used [18]. These elements block ad-                   addition indicating steady flux of hydrogen through the steel
sorption sites on electrode surface diminishing the coverage              sample. At this point, the hydrochloric acid was removed
by adsorbed hydrogen. The adsorbed H is an intermediate                   from the cathodic side of the cell. The anodic current density
resulting from discharge of H+, and its recombination                     started to decrease as no more hydrogen was produced on
produces H2 in the cathodic hydrogen evolution. No tests                  the acid side, and hydrogen charged into the steel was
were done with hydrogen poisons as they are not used in                   consumed. At the end of the test, the current was approx-
pickling baths. The use of recombination poisons was not                  imately same passive current as before acid addition.
found to be necessary as detectable amount of hydrogen was                     Results for hydrogen permeation experiments for high
generated from the concentrated hydrogen chloride solu-                   strength steel are shown in Figure 6. The curves show only
tions used in this work.                                                  the part after adding HCl in the cathodic compartment. The
                                                                          hydrogen penetration time through the sample is similar for
3. Results and Discussion                                                 all steels with similar thickness, as shown in Figure 6. This is
                                                                          seen as an increase in the current density after HCl addition.
The open circuit potential of carbon steel S253 was −490 mV               The maximum current density is lowest for the steel S900
versus SCE and a wide passive range up to the potential of                and highest for steel S500. The grade of the steel does not
+400 mV versus SCE was found in 0.2 M NaOH solution                       have direct correlation with the maximum current. The
(Figure 4). Based on these results, the potential of 0 mV                 maximum current density gives the maximum penetration
versus SCE was chosen for the permeation measurements.                    rate of hydrogen through the steel. Theoretically, integration
The selected potential is on the passive range of tested steels,          of current versus time curve gives the amount of hydrogen
and it is higher than the equilibrium potential of H+/H2                  penetrated through the sample.
reaction so oxidation of diffused hydrogen was guaranteed.                     Introduction of iron into the pickling acid has only
The current density at this potential is less than 0.1 µA/cm2.            a minor effect on the current versus time curve (Figure 7). As
The dissolution rate of steel is at very low level, approxi-              an example, the influence of ferrous ion concentrations
mately 1 μm/year.                                                         0 g/L, 14 g/L, and 45 g/L on hydrogen entry for S700 steel is
Advances in Materials Science and Engineering 5
4
jss
3
Slope = 1/tD
Current density
0.63jss
i (μA/cm2)
0.5jss
2
1
tb
0 t0.5 tL Time
0 5 10 15 20 25 30
t (h) Figure 8: Determination of characteristic times for calculation of
Steel grade diffusion coefficients: time lag tD, breakthrough time tb, half-rise
time t0.5, and decay time constant tD.
S355 S700
S500 S900
The analysis methods are based on the solution of the
Figure 6: Permeation of hydrogen in 16.5% HCl for different steel
diffusion equation with constant concentration boundary
grades with sample thickness 1 mm.
conditions. The solution for the charging transient, derived
by separation of variables, is shown in the following
4 equation:
∞
−Dn2 π2 t
1 + 2 ∑ (−1) exp
,
c1 n
I nFAD (1)
L n 1 L2
3
and for the decay transient (both ends at zero concentration
and linear initial condition), the following solution is
i (μA/cm2)
2
obtained:
∞
−Dn2 π2 t
2 ∑ (−1)n+1 exp
.
c1
I nFAD (2)
L n 1 L2
1
Figure 8 shows the principles for determination of
characteristic times for calculation of diffusion coefficients.
In the time lag method, analysis is done by integrating
0
0 5 10 15 20 25 30
the rising curve to calculate the quantity of hydrogen, which
has permeated through the sample as a function of time. An
t (h)
extrapolation of the plot of quantity against time gives the
Iron concentration time lag tL which is related to the diffusion constant by
0 g/L
14 g/L
1 L2
DL · 2 . (3)
45 g/L 6 π · tL
Figure 7: The influence of iron content of the HCl on the per- The tL in (3) can be obtained by determining the time at
meation in steel S700. which the rate of permeation is 0.63 times the steady-state
value described by current density jss [19].
In the breakthrough time method, the time tb is obtained
shown in Figure 7. Dissolved iron had only a minor effect on by drawing tangent in the rising part of the curve. The
the permeation of hydrogen in the studied steels. tangent crosses the time axis at point tb [19]:
The hydrogen diffusion coefficient was calculated by L2
using four different methods given in [19, 20]: DB 0.5 · (4)
π2· tb
(1) The time lag method
In the half-rise time method, the characteristic time t0.5
(2) Breakthrough time
corresponds to the current density that is 0.5 times the
(3) Half-rise time current density at steady-state situation jss. Diffusion co-
(4) Analysis of the beginning decay transient efficient can then be calculated as follows [19]:
6                                                                                    Advances in Materials Science and Engineering

Table 2: Average values of diffusion coefficients (cm2/s) for test             To evaluate a concrete problem case, the here obtained
materials calculated using the four methods.                            diffusion coefficients can be used to simulate the penetration
Method/steel     355 MPa     500 MPa            700 MPa     900 MPa     of hydrogen during pickling and the release of it during the
                                                                        time between pickling and hot dip galvanizing. This, how-
D0.5             1.82·10−7    1.6·10−7          1.61·10–7    2.5·10−7
DL               1.16·10−7   8.78·10−8           3.2·10−8   2.54·10−8   ever, is very much depending on the dimensions of the steel
DB               1.96·10−7   1.49·10−7          1.73·10−7   1.93·10−7   product and on the degree of deformation within that
DD               1.76·10−7   1.81·10−7          9.76·10−8   1.26·10−7   product. All this we leave for future investigations.

                                       L2
                                                                        4. Conclusions
                      D0.5 � 0.138 ·        .                    (5)
                                       t0.5                             The purpose of this paper was to study the intrusion of
                                                                        hydrogen during pickling of steel. Hydrogen permeation can
    In the decay transient analysis, a characteristic time              be caused by pickling acid, such as HCl, instead of cathodic
constant tD is determined using the slope of current decay              hydrogen production that is mainly used in investigations
after the steady state. The obtained current versus time is             found in the literature.
corrected for offsets and divided by its maximum value at                    No protective coating, for example, palladium on the
the steady state. Taking the logarithm of the obtained                  anodic side of the sample, is required. Permeation mea-
normalized current, one obtains for the beginning decay                 surement needs to be carried out after passivation of steel,
transient a linear section from which the slope is the inverse          and this low background current is to be subtracted from the
decay time constant [20]:                                               measured current before the calculation of the diffusion
                                 1 L2                                   coefficient.
                         DD �         .                          (6)        The permeation rate of hydrogen into the steel and
                                tD π2
                                                                        desorption rate from the steel are slightly lower for higher
    When the sample thickness increases, the diffusion                   strength steel. This means that if these steels are plated soon
coefficient value in replicate tests seems to become more                 after pickling, for example in hot-dip galvanizing, hydrogen
reproducible. At sample thicknesses of 1 mm, the diffusion               has no time to leave steel and hydrogen-induced failures
coefficient values were from 10−9 to 10−6 cm2/s. When the                 may occur.
sample thickness was 1.5–2 mm, the range was from 10−8 to                   Iron dissolved in pickling acid has no essential effect on
10−6 cm2/s and with sample thicknesses of 4 mm from 10−7                the permeation of hydrogen.
to 10−6 cm2/s. This effect was clearer with 500 MPa and
700 MPa samples. This effect agrees with the finding of
Charca et al. [21] by using Armco iron. It is generally easier
                                                                        Conflicts of Interest
to attain solubility limits with thinner metallic samples than          The authors declare that they have no conflicts of interest.
thicker ones, which contain more material defects and hence
trapping sites.
                                                                        References
    The diffusion coefficient was not dependent on the
analysis method. The coefficient decreased slightly with                   [1] D. Schaeffler, “Introduction to advanced high-strength
increasing strength. The results presented in Table 2 show                   steels–Part I,” Stamping Journal, vol. 16, pp. 22–28, 2004.
that both charging and discharging transients have similar               [2] T. P. Groeneveld, E. E. Fletcher, and A. R. Elsea, “A study of
diffusion coefficients. This is important for the argumen-                      hydrogen embrittlement of various alloys, National Aero-
tation, whether deep traps are significantly involved and                     nautics and Space Administration Report,”Annual Summary
filled during the charging.                                                   Report, p. 40, NASA, Washington, DC, USA, 1966, https://ntrs.
                                                                             nasa.gov/archive/nasa/casi.ntrs.nasa.gov/19660025404.pdf.
    Filling of traps would lead to an internal accumulation of
                                                                         [3] AZoM, Galvanised Steel–Embrittlement Due to Hot Dip
hydrogen, and this hydrogen cannot be detected in the                        Galvanising, AZoM, Sydney, Australia, 2002, https://www.
charging transient anymore. Since deep traps are prefer-                     azom.com/article.aspx?ArticleID�1407.
entially filled before the hydrogen can diffuse on, the pen-               [4] A. El Hajjami, M. Gigandet, M. De Petris-Wery et al., “Hy-
etration of the hydrogen is delayed, which would show up in                  drogen permeation inhibition by zinc–nickel alloy plating
the analysis as changed diffusion coefficients. For the decay                   on steel XC68,” Applied Surface Science, vol. 255, no. 5,
transient, when all the deep traps were already filled, the                   pp. 1654–1660, 2008.
diffusion of the hydrogen would proceed normally. Thus,                   [5] E. Hörnlund, J. K. T. Fossen, S. Hauger, C. Haugen, T. Havn,
whenever there would be deep traps present, this should be                   and T. Hemmingsen, “Hydrogen diffusivities and concen-
visible as a significant difference in the diffusion coefficient                  trations in 520 M carbon steel under cathodic protection in
determination methods for charging (3–5) compared to the                     0.5 M NaCl and the effect of added sulphite, dithionite,
                                                                             thiosulphate, and sulphide,” International Journal of Elec-
discharge method (6). That the diffusion coefficients ob-
                                                                             trochemical Science, vol. 2, pp. 82–92, 2007.
tained from the decay transient are similar to the other                 [6] J. Ćwiek and K. Nikiforov, “Hydrogen degradation of high-
method shows, thus, that an involvement of traps for the                     strength weldable steels in seawater,” Materials Science,
tested steels can be neglected. That iron-based samples do                   vol. 40, no. 6, pp. 831–835, 2004.
not have a significant number of traps has been already                   [7] N. Amokrane, C. Gabrielli, G. Maurin, and L. Mirkova, “Effect
mentioned in [22].                                                           of organic additives on hydrogen permeation into an iron
Advances in Materials Science and Engineering                              7

       membrane studied by frequency analysis techniques,” Elec-
       trochimica Acta, vol. 53, no. 4, pp. 1962–1978, 2007.
 [8]   J. O’M Bockris and P. K. Subramanyan, “Hydrogen embrit-
       tlement and hydrogen traps,” Journal of the Electrochemical
       Society, vol. 118, no. 7, pp. 1114–1119, 1971.
 [9]   R.-H. Sang, S. Pyun Il, and R. A. Oriani, “Hydrogen per-
       meation through the passivation film on iron by time-lag
       method,” Journal of the Electrochemical Society, vol. 137, no. 6,
       pp. 1703–1706, 1990.
[10]   M. A. V. Devanathan and Z. Stachurski, “The adsorption and
       diffusion of electrolytic hydrogen in palladium,” Proceedings
       of the Royal Society London, Series A Mathematical and
       Physical Sciences, vol. 270, no. 1240, pp. 90–102, 1962.
[11]   P. Manolatos, M. Jerome, C. Duret-Thuali, and J. Le Coze,
       “The electrochemical permeation of hydrogen in steels
       without palladium coating. Part I: interpretation difficulties,”
       Corrosion Science, vol. 37, no. 11, pp. 1773–1783, 1995.
[12]   Q. Liu and A. Atrens, “A critical review of the influence of
       hydrogen on the mechanical properties of medium-strength
       steels,” Corrosion Reviews, vol. 31, no. 3–6, pp. 85–103, 2013.
[13]   B. Ramesh Babu and R. Holze, “Corrosion and hydrogen
       permeation inhibition for mild steel in HCl by isomers of
       organic compounds,” British Corrosion Journal, vol. 35, no. 3,
       pp. 204–209, 2000.
[14]   Y. Cheng, L. Yang, and F. King, “Analysis of hydrogen perme-
       ation through pipeline steel in near-neutral pH SCC environ-
       ments,” in Proceedings of 2000 International Pipeline Conference,
       vol. 2, pp. 1479–1485, Alberta, Canada, October 2000.
[15]   J. Yang, L. Zhang, L. Xu, and M. Lu, “Influence of H2S and
       CO2 corrosion scales on hydrogen permeation in X65 steel,”
       Corrosion, vol. 08412, p. 8, 2008.
[16]   R. O. Rihan and S. Nesic, “Erosion–corrosion of mild steel in
       hot caustic. Part I: NaOH solution,” Corrosion Science, vol. 48,
       no. 9, pp. 2633–2659, 2006.
[17]   T. D. Burleigh, P. Schmuki, and S. Virtanen, “Properties of the
       nanoporous anodic oxide electrochemically grown on steel in
       hot 50% NaOH,” Journal of the Electrochemical Society,
       vol. 156, pp. C45–C53, 2009.
[18]   S. Y. Qian, B. E. Conway, and G. Jerkiewicz, “Kinetic
       rationalization of catalyst poison effects on cathodic H
       sorption into metals: relation of enhancement and inhibition
       to H coverage,” Journal of the Chemical Society, Faraday
       Transactions, vol. 94, no. 19, pp. 2945–2954, 1998.
[19]   B. S. Chaudhari and T. P. Radhakrishnan, “Boundary con-
       ditions during the electropermeation of hydrogen through
       pure iron,” Corrosion Science, vol. 30, no. 12, pp. 1219–1234,
       1990.
[20]   J. O’M Bockris and M. A. V. Devanathan, “The determination
       of the coverage on nickel and steel during electrolytic hy-
       drogen evolution,” Tech. Rep. 4, Contract No. 551(22) NR036-
       028, Office of Naval Research, p. 41, Arlington, VL, USA, 1961,
       http://www.dtic.mil/docs/citations/AD0254474.
[21]   S. Charca, O. Uwakweh, B. Shafiq, and V. Agarwala,
       “Characterization of hydrogen permeation in armco-fe dur-
       ing cathodic polarization in aqueous electrolytic media,”
       Journal of Materials Engineering and Performance, vol. 17,
       no. 1, pp. 127–133, 2008.
[22]   C. Gabrielli, G. Maurin, L. Mirkova, H. Perrot, and
       B. Tribollet, “Transfer function analysis of hydrogen perme-
       ation through a metallic membrane in a Devanathan cell. I.
       Theory,” Journal of Electroanalytical Chemistry, vol. 590, no. 1,
       pp. 1–14, 2006.
Nanomaterial
                                                                                        Nanomaterials
                                                                                                 Journal of

The Scientific                                 Journal of                                                                                                              International Journal of
World Journal
Hindawi Publishing Corporation
                                               Applied Chemistry
                                               Hindawi                                  Hindawi
                                                                                                                                 Scientifica
                                                                                                                                 Hindawi
                                                                                                                                                                       Polymer Science
                                                                                                                                                                       Hindawi
http://www.hindawi.com
www.hindawi.com                  Volume 2018
                                        2013   www.hindawi.com            Volume 2018   www.hindawi.com           Volume 2018    www.hindawi.com         Volume 2018   www.hindawi.com              Volume 2018

Advances in                                                                                                                                                            Advances in
Chemistry
Hindawi
                                                                                                                                                                       Physical Chemistry
                                                                                                                                                                       Hindawi
www.hindawi.com                  Volume 2018                                                                                                                           www.hindawi.com              Volume 2018

                                                                          Submit your manuscripts at
                                                                             www.hindawi.com

International Journal of                                                                                                                                               Advances in
Analytical Chemistry                                                                                                                                                   Condensed Matter Physics
Hindawi                                                                                                                                                                Hindawi
www.hindawi.com                  Volume 2018                                                                                                                           www.hindawi.com              Volume 2018

                                                                                                                                 Engineering
                                                                                                                                            Journal of
Journal of                                     International Journal of                 Advances in                                                                    Journal of
Chemistry
Hindawi
                                               Biomaterials
                                               Hindawi
                                                                                        High Energy Physics
                                                                                        Hindawi                                  Hindawi
                                                                                                                                                                       Nanotechnology
                                                                                                                                                                       Hindawi
www.hindawi.com                  Volume 2018   www.hindawi.com            Volume 2018   www.hindawi.com            Volume 2018   www.hindawi.com         Volume 2018   www.hindawi.com              Volume 2018

International Journal of                       Journal of                               BioMed                                   Advances in                           Advances in
Corrosion
Hindawi
                                               Materials
                                               Hindawi
                                                                                        Research International
                                                                                        Hindawi
                                                                                                                                 Tribology
                                                                                                                                 Hindawi
                                                                                                                                                                       Materials Science and Engineering
                                                                                                                                                                       Hindawi
www.hindawi.com                  Volume 2018   www.hindawi.com            Volume 2018   www.hindawi.com            Volume 2018   www.hindawi.com         Volume 2018   www.hindawi.com                Volume 2018

You can also read