SAFETY & SEA SURVIVAL - Weather Supplementary - Australian Sailing Accrediated Centre and Course - Ocean ...
←
→
Page content transcription
If your browser does not render page correctly, please read the page content below
SAFETY & SEA SURVIVAL
OCEAN RACING CLUB OF VICTORIA

 Weather Supplementary

         Australian Sailing Accrediated Centre and Course
Notes to accompany SSSC course Racing and Weather Presentation
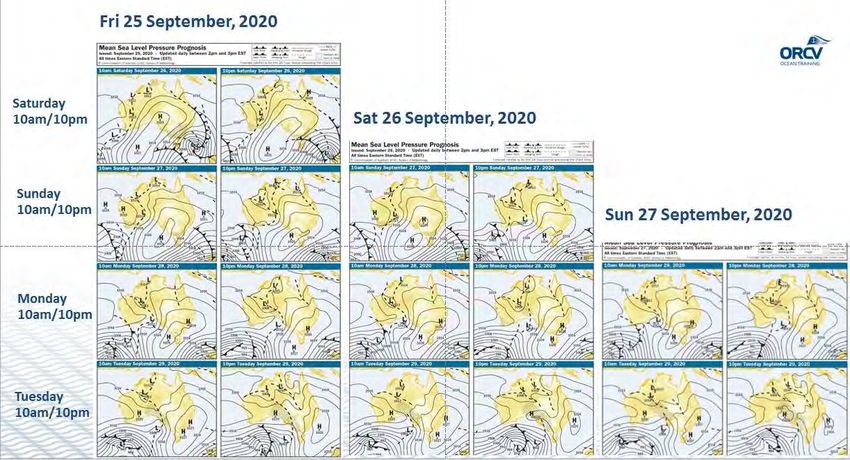
The Ocean Racing Club of Victoria is based in Melbourne, capital city of the state of Victoria Australia.
The club conducts yachting events in Port Phillip Bay and offshore from Victoria mainly along the coast
in Bass Strait and to locations in the island state of Tasmania, it’s western coast and the capital city,
Hobart. This incorporates an area from Melbourne at latitude 37ᴼ 48.8’ S to 44ᴼS and from longitude
141ᴼ 36E and 151ᴼ E. In addition, the club holds long distance events to Vanuatu in the Pacific and the
longest South to North race to Osaka in Japan, Northern Hemisphere lat. 34ᴼ N. Many of the members
also sail along the east coast of Australia to regattas in the Whitsundays lat 20ᴼ S in the winter months.
The course is arranged for the Southern Hemisphere mid
latitudes particularly but is also applicable to the Northern
Hemisphere with some adjustments and is modelled
according to the guidelines of World Sailing. Australia is a
maritime continent as distinct from the continental climates
in the largely land massed Northern Hemisphere. The north
of Australia is subject to monsoonal seasons and the eastern
coast much influenced by the warm East Australian Current
as part of the South Pacific basin gyre. In addition the relationship with South America bringing the El
Nino and La Nina events are considerations for Australia’s diverse climates. Southern Australia is
adjacent to the ‘Roaring Forties and ‘Furious Fifties’ and experiences generally larger seas than more
northerly latitudes.
As sailors we are very concerned with weather. Fortunately, the science and technology of forecasting
has been improving significantly and new research by the various world-wide Bureaus of Meteorology
have made significant progress with forecasts and now achieve remarkable accuracy especially out to
© Ocean Racing Club of Victoria Inc 1
4 days, also 7 days (free), 10 and even 20 days for some providers (mostly at a cost). In our courses in
2015, we outlined a new technology and advised students to be aware and watch for it. Today that
technology is available on the internet and published weekly. The advent and increasing use of mobile
smart-phones, sat-phones for offshore voyaging, coupled with easy to use graphics and lower data
hungry products is likely to spell cessation of official HF radio. In other countries volunteer groups, or
subscription services have continued HF services after government withdrawal. Vessel owners would
be well advised to equip with internet capability as an improvement when feasible.
Above all, we wish to engage boating safely and perform to our best whether racing or cruising. You
are encouraged to keep courses content and your personal notes in a safe and handy place for later
reference as being a recreational practitioner, the opportunities to experience the situations
presented are limited and it does take time to encounter and be consigned to ‘experience’.
Topics
Seasons-
Weather systems, Global mechanisms
The forecasting process, the weather map, models and some sources
Weather information, how to read and use it.
Fronts
Weather Warnings,
About Waves
4 & 7 day prognosis-maps
Routing Software and forecasts
Definitions and terminology
Back-turns anti-clockwise.
Barometer-in terms of this course is an instrument for measuring the pressure of the air, due
to the weight of a unit column of air above it. Usually referred to as hpa (hecta-pascals) or mb
(milli-bars).1 mb is a thousandth of a bar and the world standard barometric pressure at mean
sea level (MSLP) is 1013.25 mb or hpa at 15⁰C. A Bar is the standard atmospheric pressure
represented by the height of a column of mercury in a mercury barometer. A barometer is
near to essential especially for an offshore vessel.
Bathymetry-Study of undersea floors or surfaces
Buys-Ballots Law-In the Southern Hemisphere-Face the wind and lower pressure will be in the
direction of your outstretched left arm. In the Northern Hemisphere, with your back against
the wind, low pressure is in the direction of your outstretched left arm.
Climate - is the probable weather features for a selected location or area over an extended
time frame. Usually an average of records historically collected. Climate is what you expect;
weather is what you get.
Coriolis force is not discussed in this course but is a subject in ORCV weather courses.
Fetch-The length of water over which wind can blow without obstruction.
Gust-A sudden and brief increase in wind speed.
High Pressure Systems- In the southern hemisphere, winds rotate anti-clockwise and
outwards crossing it’s isobars at about 15ᴼ. In the northern hemisphere rotation is clockwise.
© Ocean Racing Club of Victoria Inc 2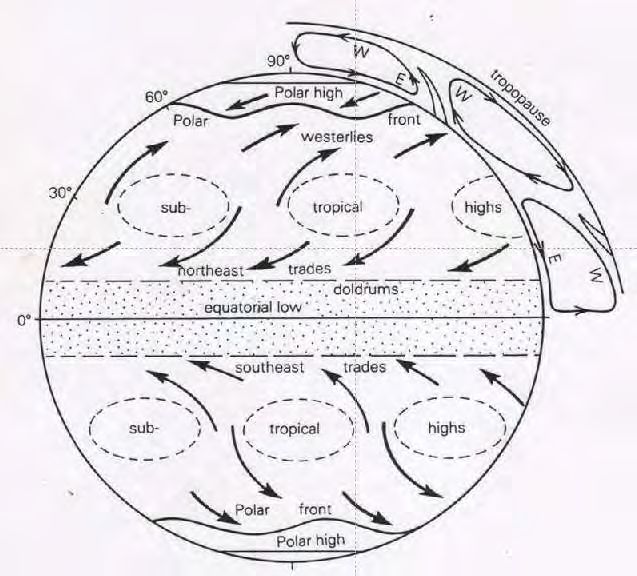
Inertia- the property of something to remain at rest or in uniform motion unless acted on by
a force.
Isobar- a line joining places with the same atmospheric pressure.
Isotach-a line (usually dashed) joining places with the same wind strength.
Low Pressure Systems- In the southern hemisphere, winds rotate clockwise and inwards
crossing its isobars at about 15ᴼ. In the northern hemisphere rotation is anti-clockwise
Momentum-the energy within a body due to it’s motion..
MSLP- Mean Surface Level Pressure
Orography-The study of mountains, Orographic,-pertaining to mountains. or for our
purposes mountains and hills in the topography of adjacent land.
Parcel-The concept of a small and self-contained volume of air which responds to
meteorological processes as a single entity.
Pressure, Volume, Temperature relationship-is a constant, which means if one is altered, one
or the other will change also. Of importance in understanding aspects in this course.
Consider the pressure volume temperature relationship with a change in pressure whereby a
bicycle pump is used. Using the pump is to decrease the volume within in order to increase
the pressure into a tyre. As a consequence the end of the pump is noticed to heat-up. An LPG
cylinder or a pressure pack (eg Hair spray) contains gas under pressure. If the valve is opened
the gas escapes into air at lower pressure. At lower pressure the gas expands to greater
volume with a corresponding drop in temperature, so much so that ice can form or the can
feels cold. As the air in a hot air balloon is heated, it expands, but the volume does not change.
Thus some air is expelled and less air is captured within (lower density), ie. The balloon
becomes lighter and ‘floats’ in the denser (colder) surrounding air. An aircraft or balloon
ascending to some elevation has less air on top of it, thus the pressure is less. As a
consequence the temperature decreases. The relationship is complicated by the presence of
water vapour but a 2⁰C drop in temperature per 1000 feet elevation is a general rule . You
may have noticed as a jet passenger the outside is about -57⁰C at 36,000 ft.
Prognosis- Expected future development.
Relative Humidity-the actual amount of water vapour compared as a percentage to the
maximum that air can hold dissolved at that temperature. At 100% relative humidity it is
termed saturated. If temperature is increased, relative humidity (RH) will decrease as the air
can hold more vapour, and if temperature is decreased the RH will increase. Thus if an air
parcel ascends to sufficient height with lower pressure (a shorter stack of air weight above it)
the temperature may decrease such that saturation occurs and condensation will occur as
cloud. The atmosphere can hold up to 5% water as a maxima but at very high altitudes can
exist in a super-saturated condition..
Squall-A sudden onset of strong winds with speeds increasing by at least 16 knots and
sustained at 22 or more knots for at least 1 minute. The intensity is longer than that of a gust.
Swell-Waves generated elsewhere that have travelled out of their generating area.
Veer- turns clockwise.
Waves-created by the direct action of local wind over water.
© Ocean Racing Club of Victoria Inc 3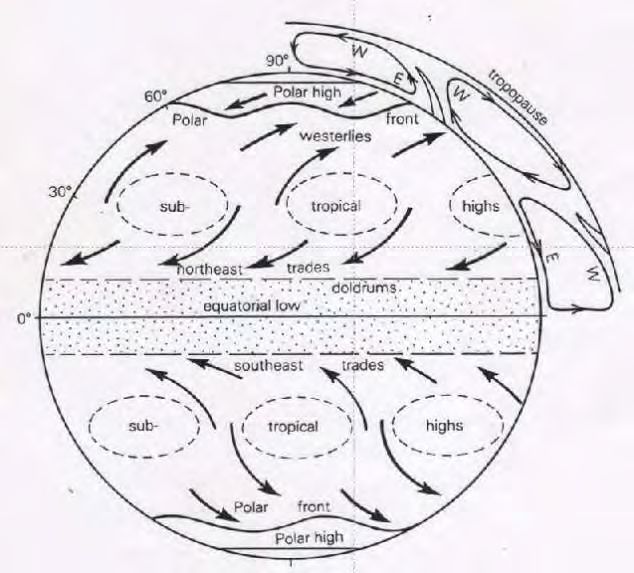
Wind-generally speaking, the transfer of air horizontally from high to lower pressure. A
number of factors are involved such that the air does not move directly but follows a path
determined by gradient pressure, coriolis force, friction and latitude.
Weather Systems-Highs and Lows
The AustralianWeather Bureau uses a wide range of weather information from their observations
network to prepare a weather map. This includes observations from over 700 automated weather
stations across Australia, Antarctica and offshore islands. They also use information provided by
ships equipped with weather stations, aircraft and meteorological drifting buoys. Every day at over
30 locations they collect information on the upper atmosphere using an instrument attached to a
weather balloon. International satellites supply information that helps us monitor various weather
elements such as the upper air winds or temperature and moisture profiles of the atmosphere.
New developments with satellites are increasingly providing more information and especially in
remote areas.
In a basic low pressure system, wind circulates in a clockwise direction and crosses isobars
inwards at about 15ᴼ. Broadly, the air in the system is also ascending into the upper atmosphere
and in the SH mid-latitudes the weather systems move from West to East very roughly at about
25 kts such that a system at Perth may arrive at Melbourne 4 days later. The low system resembles
a whirlpool draining into a funnel of lowest pressure with air spiralling inwards (visualise as a
whirlpool upside down), but all ascending. In the southern part of Australia the air drawn into the
western flank comes from the deep south and somewhat polar vicinity. Brrrrrr! On the eastern
flank the air drawn into the system is a northerly from warm central Australia. The cold and the
warm air masses spiral in towards the centre. Somewhat surprisingly, air masses of different
temperature, density, humidity etc do not readily mix and therefore face-off at each other. The
colder moist air from the maritime south is more dense and pushes against and under the warmer
air as a COLD FRONT. The warmer air is ‘wedged’ upwards. The spiralling inwards air-flows
‘concentrate’ differences. The symbol for a cold front consists of a line with black triangles facing
the direction of flow. If the system is not circular, the distortion may have a ‘trough’ designated
by a hatched line and could be imagined as a ‘valley’ extending from the low centre.
If directly in the path of an approaching low with a barometer, an observer would see the pressure
dropping steadily until the low centre passed whereupon the pressure would begin to rise and the
wind dramatically change direction and be cold. The actual front would most likely contain
thunderstorms, rain and squalls. The wind generated by the system is directly indicated by the
spacing between and at right angles to the isobars, the closer the isobars are on a map or the
greater the rate of change of pressure, the stronger will be the wind whether the barometer is
rising or falling. Calculating the wind strength is possible but complicated and un-necessary given
one can get it all on the internet or a radio forecast with a fairly good degree of accuracy. If one
was observing the barometer but not directly in the path of the low centre, use Buys-Ballots Law
to find the direction of the low centre and determine as well as possible what the pressure drop
towards the centre might be.
The HIGH PRESSURE SYSTEM in contrast rotates anti-clockwise in the SH and clockwise in the NH
and is a descending air process spreading out upon reaching the surface crossing isobars outwards
and anti-clockwise about 15ᴼ. Whereas a low concentrates different air masses, the high ‘evens
out’ with a more gentle process. The same west to east movement of the system exists and a
distortion of the system shape often has a ‘ridge’ which may be thought of as a mountain range
extending out from a mountain (the centre). Maps with a sharp isobar ‘nose’ at the end of a ridge
often are windier areas than isobar spacing would suggest. As air in a high descends, the pressure
© Ocean Racing Club of Victoria Inc 4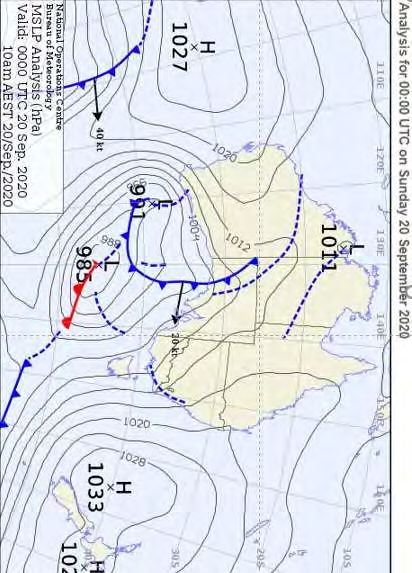
increases and therefore warms-‘increase the pressure and temperature also increases’. As the
       temperature increases the relative humidity decreases and any moisture present is absorbed. “
       The warmer air can hold more moisture’ and clouds dissolve. High pressure systems therefore are
       likely to have clear skies and be milder weather. In contrast the low pressure system ascending air
       has pressure reduced ( less air-weight) on top of it. ‘Decrease pressure and temperature will also
       decrease’-Decrease temperature and relative humidity increases’, and if saturation occurs the
       excess moisture will condense as cloud and with further cooling become rain. Thus low pressure
       systems commonly have overcast skies and probable rain.

       Warm front

       On the weather map warm fronts appear as a red line with semi-circles (originally chosen because
       they look like a sun rising bringing warmth). Warm fronts progressively displace cool air with
       warmer air. Just like a cold front, the temperature change can be quite large once a warm front
       moves through, although it tends to happen more gradually than a cold front.

       Warm fronts appear less frequently than cold fronts over Australia but are more common in the
       Northern hemisphere particularly due to larger land masses. Even though they bring warmer air,
       this doesn’t necessarily mean better weather. They can bring steady rainfall, grey skies and more
       humid conditions.

       If a cold front catches up with a slower-moving warm front, they may form an 'occluded front'.
       The mix of cold and warm air associated with an occluded front typically brings rainfall.

        Troughs

       A trough appears on the weather map as a dashed blue line on the chart. It is an elongated area
       where atmospheric pressure is low relative to its immediate surroundings. Like cold fronts,
       troughs separate two different air masses (usually more moist air on one side and drier air on the
       other).

       As the trough moves towards the moist air it lifts it. This causes cloud or even showers and
       thunderstorms to develop. If the trough moves back in the other direction it will drag the moist
       air with it. In the Australian summer the centre heat causes air expansion and the rising air of low-
       pressure forms heat troughs. These heat troughs can be ‘rivers of tropical moisture’.

       Watch for the monsoon trough which shifts over northern Australia each year. It draws in moist
       air from the surrounding oceans and this influx of moist air is referred to as the monsoon. The
       monsoon is associated with cloudy conditions, lengthy periods of heavy rain, occasional
       thunderstorms and squally winds.

       To estimate wind direction on a weather map

       Place a dot on an isobar at the chosen location on a weather chart. Determine whether the system
       is a high or a low. If unsure, find some values of pressure on isobars decreasing or increasing and
       follow the isobars along to your location and determine high or low features. Remember low
       rotates clockwise and high anti-clockwise SH. (Southern Hemisphere). Draw an arrow in the
       direction of rotation crossing about 15ᴼ over the point made on the isobar and to the right (this
       will be outwards for a high and inwards for a low). In the NH in the direction of rotation and
       crossing to the left. To help estimating 15ᴼ the procedure as in the diagram should help. Start with
       a right angle (90ᴼ) and divide it in half = 45ᴼ each side. Divide the lower half into three and each

© Ocean Racing Club of Victoria Inc                                                                            5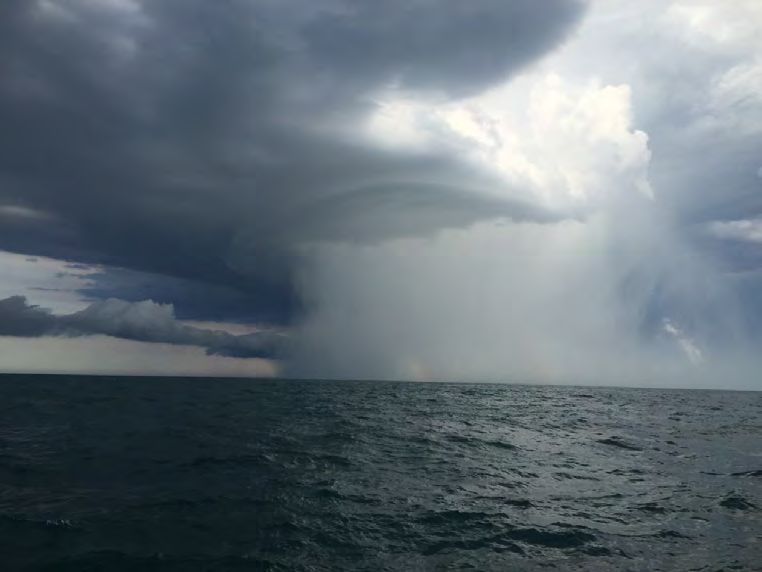
wedge is then 15ᴼ. It is not necessary to be precise as the purpose of finding wind direction on
       your weather map is to be cognisant of expected conditions. Weather maps are produced to a
       world standard and can therefore be used as a guide in any country language notwithstanding.

       Cold Fronts
       A cold polar airmass usually as part of a low-pressure system has the symbol with the triangles
       pointing in the direction of advance. The cold air is denser and
       being heavier slides under the relatively warmer air to act as a wedge.
       The process is mostly quite vigorous being associated with strong
       winds and a sudden drop in temperature accompanied by rain, a
       sudden shift of wind from North-west to west and then south-west, possible thunderstorms and
       over water, rapid building of sea-state. Following passage of the front, cumulonimbus clouds bring
       squalls as they sweep in with rain, possible hail and difficult sailing conditions. The frequency of
       these ‘storms’ gradually lessens with longer intervals of clear conditions and moderation of wind.
       The approach of a                      front is nearly always heralded by feathery cirrus cloud
       (mares tails) some                     30 to 36 hours before gradually thickening and looming rain
       cloud. The wind                        sequence in the southern hemisphere begins with light
       north-easterlies                       followed by rising northerlies becoming warm and strong
       before       shifting                  northwest with lowering ominous cloud before the arrival
       of the front. Fronts                   can move up to 40 kts in winter and maybe 20-25 kts in
       summer such that the passage from Australias ‘ west to the east varies accordingly.
       Squalls, Updrafts & Thunderstorms

                                              Thunderstorms are initiated by some form of lifting
                                              mechanism. An advancing cold front wedging under
                                              warmer air, a cumulus cloud rising in a strong thermal
                                              updraft or orographic lifting from a mountain or similar are
                                              examples. As the air is forced upwards and cools, water
                                              vapour turns to liquid and releases latent heat energy
                                              providing further lifting. Under strong updrafts the water
                                              droplets are carried higher turning to ice and release more
                                              latent heat fueling even stronger updrafts. Development
                                              requires near vertical structure to maintain updraft
                                              whereas strong wind aloft blowing sideways destroys the
                                              lifting process.. Eventually the system reaches the upper
                                              level of the troposphere where the temperature inversion
                                              layer prevents further cooling. The top then spreads
       sideways into the classic anvil shape. Updrafts can be strong enough to carry and hold ice pieces
       which aggregate until gravity overcomes the lifting and it falls as hail dragging cold air and rain
       with it. The downdraft resulting spreads out like an inverted mushroom as it reaches the ground
       and the horizontal motion of the storm combines with the forward edge of the downdraft to
       become the gust front.

       Shelf clouds and roll clouds are usually seen above the leading edge of a squall, also known as a
       thunderstorm's gust front. From the time these low cloud features appear in the sky, one can
       expect a sudden increase in the wind in less than 15 minutes.

© Ocean Racing Club of Victoria Inc                                                                           6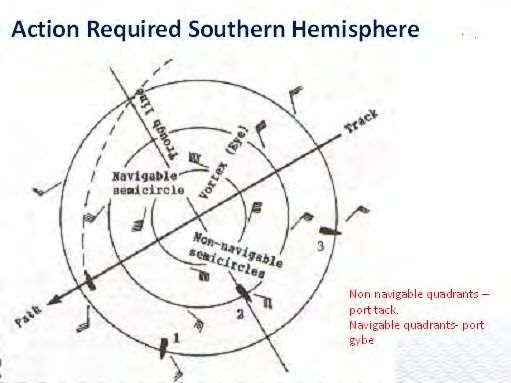
The leading area of a squall line is composed primarily of multiple updrafts, or singular regions of
       an updraft, rising from ground level to the highest extensions of the troposhere, condensing water
       and building a dark, ominous cloud to one with a noticeable overshooting top and anvil (thanks to
       synoptic scale winds). Because of the chaotic nature of updrafts and downdrafts, pressure
       perturbations are important. As thunderstorms fill into a distinct line, strong leading-edge
       updrafts - occasionally visible to a ground observer in the form of a shelf cloud- may appear as an
       ominous sign of potential severe weather.

       Beyond the strong winds because of updraft/downdraft behavior, heavy rain (and hail) is another
       sign of a squall line. In the winter, squall lines can occur, albeit less frequently – often bringing
       thunder and lightning.

       On Port Phillip with a summer thunderstorm the dangers are the gust front, a strong blast of wind,
       and the downdraft of possible hail and very heavy rain. There can be a circular effect with wind
       around the clock, rain and little visibility such that keeping view of the compass is required to
       prevent disorientation. The rain flattens the sea but the wind can come from every which way
       until the system passes in perhaps a half hour. Thunderstorms follow heat (assists thermal uplift)
       such that they usually pass around the top of the bay, Altona-to the City-(with heat island
       effect=+4-6ᴼ) and on to the Dandenongs mountainous region to the east of the bay, or else jump
       across the bay from Bellarine to Mornington (the shortest distance from hot land to hot land. The
       Bureau has systems in place for thunderstorm warnings to be issued but they usually only get 2-3
       hours' notice as to where.

       Lightning.-there have been lightning strikes experienced on the bay and the following precautions
       apply

       Firstly the vessel should have radios and electronic items well earthed and mast/rigging well
       grounded -but using electrical items is best avoided.

       Swimming or being in a dinghy or small vessel is best avoided.

       Holding metal rods or fishing can be a risk.

       Do not stand on an exposed deck.

       Move away from any electrical noise or sensation.

       Avoid holding items such as a steering wheel with two hands. If a strike should occur the danger
       is current passing from one arm across the chest to the other and through the heart.

       There are dissipaters available which can be fitted to mast-tops but not commonly seen in
       southern waters as distinct from eg Darwin where strikes to yachts are relatively common.

       Global Systems

© Ocean Racing Club of Victoria Inc                                                                            7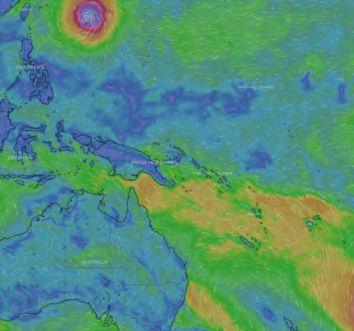
Maximum solar energy delivered to the equatorial region at an angle of incidence of 90ᴼ or directly
       onto the surface causes the atmosphere to heat and expand with lower density. This lighter air
       ascends (and ascending air =low pressure system) as we have explained previously. The area is
                                                                known as the equatorial low pressure belt.
                                                                The higher density air adjacent flows into
                                                                this area and is known as the trade wind
                                                                belts. Coriolis bends the trade winds from
                                                                southerly flows to become the southern
                                                                hemisphere SE Trades and the reciprocal
                                                                NE trades. Colder upper atmosphere air
                                                                falls downwards to replace air in the trades
                                                                and descending air we know becomes a
                                                                high pressure system. The rising air from
                                                                the equatorial low cools aloft and setsup a
                                                                circulation towards the descending air of
                                                                the highs. Thus there is a circulation of
                                                                rising air from the equatorial region cooling
       aloft and moving to become the descending air of the highs in turn flowing as the trades to the
       equatorial low,
       For those of us in the mid-latitude regions the high pressure systems are known as the ‘Band of
       highs’, ‘Sub tropical ridge’ and ‘Horse latitudes’ centred on 30ᴼ latitude depending on the season.
       In Summer the band of highs are centred near lat 40ᴼ and in winter nearer 35ᴼlatitude.
       The polar regions have colder, denser air which sinks to be the ‘Polar High’ and the reatively
       warmer ocean becomes an area of low pressure relatively with predominantly westerly air flow.
       In winter our region is (at least by weather) in the ‘Roaring Forties’. Having awareness of these
       systems is very important to those of us who plan for longer voyages.

       Seasons
       The earth has an inclined axis as it turns in its daily cycle. The inclination is responsible for the
       annual seasons. The earth not only spins in a daily cycle but also has an annual orbit around the
       sun. At the southern solstice (longest daylength), the axis through the south pole is closest to the
       sun while at the north pole the axis is pointing furthest away from the sun and is shadowed by the
       earth high latitudes to experience 24 hr darkness. 6 months later, at the southern winter solstice,
       the south pole has 24 hr darkness and the north pole 24 hr daylight with northern summer grading
       progressively to the tropics which has little day/night difference. The autumn and spring solstice
       has equal day/night at all latitudes.
           The effect of the seasons in sailing weather is that the climate driver features such as the band
       of highs and the westerlies progressively change latitude and for example, the band of highs or
       sub tropical ridge run through Tasmania in peak summer and in winter through mid New South
       Wales. The westerlies and other climate drivers as shown in the BOM diagram follow suit. Typical
       season weather maps are presented in slide presentation notes as is the BOM diagram.
       Weather Forecasting
       Data collected by the weather Bureaus from before mentioned inputs and more recently special
       satellites, is fed into the best computer they can obtain because the more powerful, the more
       resolution (the detailed data grid) and the better output. Standard Bureau response for better

© Ocean Racing Club of Victoria Inc                                                                             8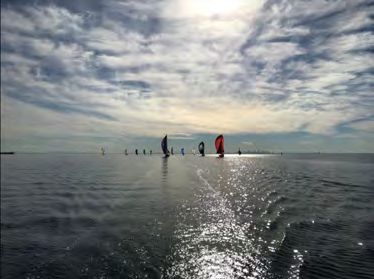
forecasts is ‘give me more data collection and computer power and no problem’. Expenditure and
       budgets are determined by importance and need. Therefore data is concentrated from high
       density population areas usually. This is worth remembering for those mariners in remote regions.
       Basically the forecasts are made from enormously complex fluid flow programs and then
       ‘tweaked’ by experienced meteorologists according to any known aberrations. The modelling and
       computer power required to run it is limited to just a few nations and other agencies ‘tack on’
       their particular interests to the main models. These main models are the ‘European community
       (Ecmf) the American ‘GFS’, Japan JMA, UK Meteo from which the Australian ‘Access’ model is
       derived and some others. There are many other models from various countries each with their
       own focus. By its constitution, the American NOAA (GFS=global forecast system) must be free and
       therefore is picked up by many special interest providers for their subscribers. As an example the
       Swiss nation has a very mountainous region and applies a special routine amending the input of
       it’s topography for its forecasts. All modelling is very sensitive to initial starting data input to
       produce forecasts as very small errors can escalate to give erratic outputs. One technique to
       counter this is named ‘Ensemble’ where varied starting conditions are input and modelled
       conjointly to obtain several results for consideration. An initial modelled output is the ‘Analysis’,
       but by the time this is published is usually some 3 hrs old. The calculated and tweaked forecast is
       termed a ‘prognosis’ meaning ‘looking ahead’ and is published accordingly by the bureau, TV and
       radio stations and maritime agencies.

       An example useful technique is to examine the popular 4 day forecast map and compare the
       current prognosis with the forecast from the day before, ie day 2 from yesterday should be the
       same as day 1 today. Similarly day 4 from a 4 days previous map should be the same as today. Any
       differences are a measure of confidence. For the mariner, it can be wise to determine a level of
       confidence by comparing different models. By experience, and at sea, one’s own observations
       especially including a ship barometer and the Mk 1 eyeball. Sailors need always to consider that
       forecasts are dependent on data density, model selection, interpolation and local effects. A
       forecast should be viewed as background information
       Isobar spacing, latitude and wind.

© Ocean Racing Club of Victoria Inc                                                                            9
When observing isobar spacing on a weather chart, the spacing for different latitudes must needs
be confined to a smallish latitude range, say 10ᴼ. Due to the earth’s shape it happens that spacing
in the tropics is very much larger for a given wind strength than at higher latitudes. That is to say
that pressure differences are fairly small for a given wind strength cf high latitudes. So much so
that weather maps are almost unusable from about 10ᴼ latitude up to the equator. Another map
named the Gradient Wind Analysis is produced to cater for these regions. (More in ORCV weather
courses). To be useful, weather map isobar spacing as an indication of wind is best restricted to a
latitude range of, say, 10ᴼ. This is sufficient for most outlook purposes considering the west to
East movement of systems.
Radio Forecasts
HF & VHF forecasts are generally every 6 hours while safety warnings are issued every hour while
current. An HF schedule is available from the BOM website or as listed in worldwide publications.
The forecasts are issued for australia by station VMW for the west and VMC for eastern areas.
They are given in areas progressively and are for 3 days. More is available in ORCV year books.
VHF forecasts are available from state coastal stations and various local volunteer groups. In all
radio forecasts, one needs to understand the wind warnings terms it is good practice to mentally
add the note that wind gusts can be 40% greater than wind speeds given. Thus a strong wind
warning of 26-33 kts can have gusts up to 36 to 45 kts and a gale warning of 34 to 47 kts, gusts of
48 to 66 kts while for a storm warning of 48-53 kts, gusts can be 67-74 kts. During these extreme
events the wave tops can be lifted off by the wind and the energy delivered brings very large
waves after such a gust.
Very common in European and northern hemisphere waters is use of the Beaufort scale which
describes winds according to a force scale based on sea-state. Such a forecast may be given for an
area with winds ‘force 4’ as an example. It is useful in that observance of seas over time related
to winds can enable one to know wind strength by observing the sea (if instruments on board
should fail.)
Weather from the internet
The importance and usefulness of weather information to the community justifies huge
expenditure by Governments and output products are very varied and in many forms. Like all
sciences in this information age, advances are ongoing and ever changing. Mostly all for the good!
The products outlined in this course are mostly from the Australian weather Bureau as are
specialised for Australia and found to be of good accuracy with excellent support descriptions
available. However other providers can suit some people and may have a different
focus/presentation. Very popular with sailors worldwide is Predict Wind and for coastal and ocean
voyaging-Expedition, described more fully in our weather courses. Windy.com is also useful and
is free out to 10 days with a comprehensive menu selection. Information from any of these
providers has presentation differences but with some familiarisation can be used in conjunction
to provide a more complete outlook.
A useful routine is to look at whole of Australia using the animation forecast to get a background
feel for the coming weather and then to use, Victoria for closer detail and Port Phillip area before
using the Meteye system for a local vicinity. A difference with Meteye is that the system uses ‘local
forecasts’ aggregated to the big picture as distinct from a ‘big picture’ expanded to a local area.
© Ocean Racing Club of Victoria Inc 10The government seems to have a preference for a more universal approach to wind speed as per
land-based km/hr instead of knots but accepts it for marine use. Meteye has provision for both
but any selection needs constant checking as it can revert to the other by itself.
Being Weather Wise
The big picture is readily available and detail excellent subject to a practical limit of 3 hour intervals
without a data explosion. Port Phillip Bay for example is 745 m²and almosy half is shallower than
8 m or 26 ft. A cold front from the western quadrant arrives in 4-6 hours from one side to another
and temperature can drop 10-20ᴼ in 20 mins. Typically winds move from a strong northerly to NW
then through West to SW with the front accompanied with rain and possible thunderstorms.
There is not anything precise officially in the time scale of these events and as mariners are
particularly interested in the immediate 2miles vicinity around them, the Mk 1 eyeball is
invaluable. In these circumstances a barometer will fall until about 20 mins before the change. In
lake waters which are often surrounded by hills and vegetation, the situation is even more
pronounced as winds funnel through and around the landscape.
There are three particular winds which can make dangerous seas in the enclosed waters of Port
Phillip Bay, the shallow depth and restricted fetch makes for generally choppy conditions. North
with a fetch of @26 nmiles, North West fetch @21.5 nml, and SouthWest fetch @ 23 n ml have
the greatest amount of fetch which can produce seas up to 2.5 m 1n 30-40 kts. Only rarely are 3
m seas observed as there is insufficient depth for larger. A particular hazard is at the bay entrance
from Bass strait which is only 2.5 miles wide with restricted depth and forms a barrier to tidal flow
which can reach 7-8 ktson the eastern side. Particularly with ebb tide against the prevailing SW
sea or swell, very dangerous conditions can existand persist up to some 3.3 nmls into the Strait.
Exit for small craft is only possible infair conditions and at slack water as published in the tide
tables (which is not at high or low tide). This tricky entrance (known as the Rip) has an infamous
history but nowadaysis also well signposted with navigation markers. The Ocean Racing Club of
Victoria conducts regular instructional waterbourne tours for familiarisation.
Useful BOM website products-www.bom.gov.au
The screen will open with the face page
showing a satellite picture over Australia
and selection boxes for Rain Radar,
Satellite Images, Weather Maps and
Meteye. Scroll down to get the lower
part of the face page to find ‘Our
Services’ and select ‘Marine and Ocean’.
The following selections appear with
corresponding pages, each with
respective uses. Selecting Marine wind maps takes you to the ‘Australia wide wind map’ with wind
directions as vector arrows and colour coding for wind strengths. Above the map is a toolbar from
which can be selected Day, time of day, and controls to go forward, back and ‘animate’ to show
weather system progressions. The options selection can be used to select the state area which
can also be chosen by clicking the state. Often after a new selection it is necessary to press
© Ocean Racing Club of Victoria Inc 11‘update’. On the Victoria map, the Port Phillip area is rectangle enclosed which area can be ‘click’
selected.
Back to the face page ’Weather maps’ which when selected brings a menu page of links to various
items. Although you are encouraged to explore all these and familiarise yourself as to what may
be of interest to yourself. Probably the most useful is the ‘Forecast map for next 4 days. Most
voyages do not last more than 4 days or can be refreshed when near a coastal site. The maps are
in 12 hr intervals and checking stability of the forecast has been covered previously. The short-
term forecast map combined with satellite picture is also very useful as it shows cloud conditions
also. Remembering a weather system takes roughly 4 days to get to Melbourne vicinity, a glance
at this map allows you to imagine the likely situation ahead. The next link of interest is the Gradient
Wind-Gradient wind Analysis. This is a map of streamlines for the tropics where isobars are of little
use due to very small pressure differences, Around or at the edges of various pages there are other
topic panels shown. Much explanitory information can be derived from these on various subjects.
For the streamline maps, there is a 2 page ‘how to use’ document. The ORCV weather courses
cover these more technical aspects.
The METEYE selection begins with an Australia map and a toolbar to type-in your location of
interest. This opens to a 7 day selection panel which when any day is selected produces a detail 3
hr conditions table with (if desired) selections such as humidity, rain etc. as well as wind direction
and strength, once again don’t forget to check for kts.
The Marine Lite selection is again for light, slow, or expensive data usage devices such as sat-
phones and maybe mobile phones.
About Waves
King or rogue waves are waves
greater than twice the total wave
height. These very large waves occur
when ocean currents run opposite to
the prevailing sea and swell, and
waves overrun each other. This
generates steep and dangerous seas.
Mariners should prepare for a rogue
wave encounter.
Sea state refers to the combination of sea and swell waves. Sea state descriptions are
provided in the tables below.
Sea waves are generated by the local prevailing wind. Their height depends on the length
of time the wind has been blowing, the fetch (the distance the wind has blown over the
water), and the water depth. They may also be referred as seas in marine text forecasts and
wind waves in map displays.
Significant wave height is the statistical basis for all wave heights presented in text
forecasts and map displays. Wave heights are variable over time. The statistical definition
© Ocean Racing Club of Victoria Inc 12is calculated as the average height of the highest one-third of the waves experienced over
time.
Swell waves are the regular, longer period waves generated by distant weather systems.
They may travel over thousands of kilometres. There may be several sets of swell waves
travelling in different directions, causing crossing swells and a confused sea state. Crossing
swells may make boat handling more difficult and pose heightened risk on ocean bars. See
more information about the second swell. There may be swell present even if the wind is
calm and there are no sea waves. There are two methods for identifying multiple swells.
Deep Water Waves
Deep-water waves are waves traveling across a body of water where depth is greater than
half the wavelength (D > 1/2 L). Deep-water waves include all wind-generated waves
moving across the open ocean. Unless influenced by current, deep-water waves have a
regular formation.
Shallow Water Waves
Where depth is less than one half of wave length. A shore often has a slope 1:20 and a rule
of thumb is that a wave will break if depth is less than 1.3 times wave height. Water particles
at the surface move in a circular motion of diameter equal to
wave height and when shallow water is encountered or an
adverse current, bottom friction causes the circular motion to
become elliptical leaning in the direction of travel almost as if
the bottom half of the wave has slowed and the upper half
continues at the original velocity. There is also water surface
movement towards a shore and return flow close to the bottom
which can form ‘undertows’.
The Bureau's AUSWAVE wave model identifies individual swells based on their
energy. The AUSWAVE model outputs a primary and secondary swell to refer to the
height and direction of the swell with the highest (and second highest) energy component.
Direction-based identification: The Bureau's MetEye map displays swell forecasts that
are assigned either Swell1 or Swell2 according to a pre-determined direction
convention for the Australian coastline. This means Swell1 may not always represent
the highest swell conditions.
Total wave height is the combined height of the sea and the swell that mariners experience
on open water. It may also be referred as the combined sea and swell or significant wave
height. The probable maximum wave height can be up to twice the total wave height.
Description Wave Period Wave
Length Height
Low swell of short or average length 0 - 200 m Less than 11 sec 0-2 m
Long, low swell over 200 m Greater than 11 sec 0-2 m
Short swell of moderate height 0-100 m Less than 8 sec 2-4 m
© Ocean Racing Club of Victoria Inc 13Average swell of moderate height 100-200 m Greater than 8 sec, < 11 sec 2-4 m
Long swell of moderate height over 200 m Greater than 11 sec 2-4 m
Short heavy swell 0-100 m Less than 8 sec over 4 m
Average length heavy swell 100-200 m Greater than 8 sec, < 11 sec over 4 m
Long heavy swell over 200 m Greater than 11 sec over 4 m
Wave trains-
The sort of swells we are likely to observe on a fair-weather day at the beach will commonly
arrive in groups of 12 to 16 waves. That range, coupled with the tendency of wave groups
to bundle their tallest waves in the center of the pack, provides a possible basis for the
surfers’ seven-wave claim. A group will 'modulate' the wave amplitude; it's like another
long wave on top. So the first wave in a group is tiny, the next one is bigger and so on until
you get the biggest one in the middle of the group. Then they get smaller again. The last
one is tiny, so the biggest wave in the group is in the middle, and if there are 14 waves in a
group, the seventh wave is the biggest.
At sea, regular wave patterns can be observed and when difficult tasks in heavy conditions
are required, such as a gybe, it can be useful to prepare personnel and wait until a more
benign pattern begins and then to perform the operation.
Average height of 0.625% of significant
100% of waves wave ht
Average height of 0.88% Oceans are
50% largest waves not just large
Average height of 100% = significant
33% largest waves wave height
14% of waves(1 in 7) Larger than
significant .wave hgt
Average height of 127% homogenous expanses of water. Looking at any
10% largest waves chart will show the presence of numerous
Average height of 1% 167% undersea reefs and submerged masses called
largest waves
seamounts. Currents and wind-driven currents
Average height of 186% of significant
0.1% largest waves wave ht react with these structures to cause up-
wellings, deviations and similar to whirlpools,
all of which affect wave-forms in the vicinity.
Tropical Revolving Storms
© Ocean Racing Club of Victoria Inc 14Cyclones, Typhoons, Hurricanes are all the same tropical revolving storms, just different names
and rotations depending on their location. In Australia, they are cyclones and occur in northern
tropics of Australia. Their formation requires sea temperatures of 26.5ᴼC+, moisture in the
atmosphere and low wind shear (light horizontal winds aloft). They do not form within 5ᴼ latitude
either side of the equator as the conditions are not present to allow ‘spin-up’ . They are more
likely in La Nina years in the presence of an MJO event and develop often from a tropical low on
the monsoon trough. (This topic is covered in more detail in the ORCV weather course Module 3.)
Of course there are warnings made but in the unfortunate event of being caught in one, it requires
getting as far as possible away from the centre (strongest winds) and to the rear of the system. To
do this requires determining if you are, or likely to be, in the navigable or non-navigable sector.
Buys Ballots Law for the Southern Hemisphere states to face the wind and your outstretched left
hand will be pointing to the low pressure (centre of the system).
In the navigable semi-circle the wind is against the
system track speed which results in lesser winds.
Sailing on port gybe takes you away from the
centre to the outer edge and to the sytem rear.
(Any course in the system front means it will keep
you in it until a disaster.) If you are unfortunately in
the non-navigable semi-cirle it requires sailing on
port tack to again get to the outer edge and behind.
Exercise map
© Ocean Racing Club of Victoria Inc 15© Ocean Racing Club of Victoria Inc 16
ORCV is dedicated to promoting ocean sailing, growing its participation,
      providing sea safety programs and value to our members.

              Support the ORCV by joining as a member
                        www.orcv.org.au/join

          Learn more about the ORCV Programs
                           Racing Calendar
                    Safety & Sea Survival Courses
                          Weather Courses
                         Navigation Courses
                           Bowman Course
                            Other Courses
                             Membership
                              plus more

                                   Follow us on

    COPYRIGHT 2021 - OCEAN RACING CLUB OF VICTORIA
                ORCV Office 3 Aquatic Drive Albert Park VIC 3206
                               orcv@orcv.org.au
You can also read