SATURN: A Thin and Flexible Self-powered Microphone Leveraging Triboelectric Nanogenerator - Zhong Lin Wang
←
→
Page content transcription
If your browser does not render page correctly, please read the page content below
SATURN: A Thin and Flexible Self-powered Microphone Leveraging
Triboelectric Nanogenerator

NIVEDITA ARORA∗ , STEVEN L. ZHANG, FERESHTEH SHAHMIRI, DIEGO OSORIO, YI-CHENG
WANG, MOHIT GUPTA, ZHENGJUN WANG, THAD STARNER, ZHONG LIN WANG, and GREGORY
D. ABOWD, Georgia Institute of Technology, Atlanta, USA
We demonstrate the design, fabrication, evaluation, and use of a self-powered microphone that is thin, flexible, and easily
manufactured. Our technology is referred to as a Self-powered Audio Triboelectric Ultra-thin Rollable Nanogenerator
(SATURN) microphone. This acoustic sensor takes advantage of the triboelectric nanogenerator (TENG) to transform
vibrations into an electric signal without applying an external power source. The sound quality of the SATURN mic, in terms
of acoustic sensitivity, frequency response, and directivity, is affected by a set of design parameters that we explore based
on both theoretical simulation and empirical evaluation. The major advantage of this audio material sensor is that it can be
manufactured simply and deployed easily to convert every-day objects and physical surfaces into microphones which can
sense audio. We explore the space of potential applications for such a material as part of a self-sustainable interactive system.
CCS Concepts: • Human-centered computing → Interaction devices; • Hardware → Power and energy; Communi-
cation hardware, interfaces and storage;
Additional Key Words and Phrases: flexible electronics, passive microphone, Triboelectic effect, TENG (Triboelectric Nano-
generator), applications
ACM Reference Format:
Nivedita Arora, Steven L. Zhang, Fereshteh Shahmiri, Diego Osorio, Yi-Cheng Wang, Mohit Gupta, Zhengjun Wang, Thad
Starner, Zhong Lin Wang, and Gregory D. Abowd. 2018. SATURN: A Thin and Flexible Self-powered Microphone Leveraging
Triboelectric Nanogenerator. Proc. ACM Interact. Mob. Wearable Ubiquitous Technol. 2, 2, Article 60 (June 2018), 28 pages.
https://doi.org/10.1145/3214263

1    INTRODUCTION
   Sound is a critical source of information for understanding and controlling the environment. Sound is sensed
using a microphone, an acoustic–electric transducer, which outputs an electrical signal that reproduces the
sound pressure variations that it senses. In addition to the obvious applications of recording events for playback
and automated speech recognition, the increased availability of low-cost embedded microphones has resulted
in a variety of other interesting applications. These applications include occupancy detection [16, 25], control
[30, 45, 56], human behavior studies [4], structural maintenance [15], health monitoring[27, 70], hearing aids [5],
activity recognition [26, 40, 63, 80] and sound source localization [48, 62].
∗ This   is the corresponding author

Authors’ address: Nivedita Arora, nivedita.arora@gatech.edu; Steven L. Zhang; Fereshteh Shahmiri; Diego Osorio; Yi-Cheng Wang; Mohit
Gupta; Zhengjun Wang; Thad Starner; Zhong Lin Wang; Gregory D. Abowd, Georgia Institute of Technology, Atlanta, USA.

Permission to make digital or hard copies of all or part of this work for personal or classroom use is granted without fee provided that
copies are not made or distributed for profit or commercial advantage and that copies bear this notice and the full citation on the first
page. Copyrights for components of this work owned by others than ACM must be honored. Abstracting with credit is permitted. To copy
otherwise, or republish, to post on servers or to redistribute to lists, requires prior specific permission and/or a fee. Request permissions from
permissions@acm.org.
© 2018 Association for Computing Machinery.
2474-9567/2018/6-ART60 $15.00
https://doi.org/10.1145/3214263

                               Proc. ACM Interact. Mob. Wearable Ubiquitous Technol., Vol. 2, No. 2, Article 60. Publication date: June 2018.

                                                                                                                                                     60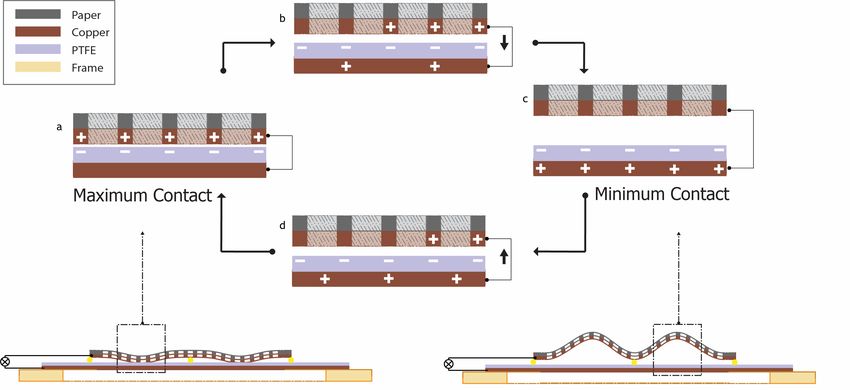
60:2    • N. Arora et al.

   As ubiquitous as microphones may seem today, there is still room for progress. A microphone’s design balances
several important features, including recording quality, form factor (e.g., size, weight, flexibility, thickness), and
power consumption. Electronic devices most commonly use electret [54] or condenser [46] microphones based on
MEMS technology [11, 71]. CMOS–MEMS acoustic devices allow miniaturization and on-chip electronics, but are
active, that is, they require power for operation and sound amplification [8, 12]. Commercially available passive
(or self-powered) microphones do not consume power but are bulky (e.g., a moving coil dynamic microphone [7])
or use PVDF films, which either results in a low sensitivity contact microphone [1, 38] or complex to manufacture
and costly to scale in size [24, 53]. The challenge lies in designing a microphone which is passive and has
sound quality comparable to its active counterparts (acoustic sensitivity > −25 dB S P L ) while still preserving a
lightweight and versatile form factor [28]. Recent advances in materials science have demonstrated the possibility
of such self-powered, easy-to-manufacture sensors that take advantage of the triboelectric nanogenerator (TENG)
to convert mechanical vibrations into electrical energy [65, 67, 69]. The TENG relies on the triboelectrification
and electrostatic induction effects, which converts tiny mechanical vibrations into electric signal output without
applying an external power. In this paper, we present the design, fabrication, and evaluation of a flexible and
self-powered microphone that is made up of a thin and inexpensive PTFE/paper/copper structure.

               (a)                                    (b)                                                 (c)

Fig. 1. SATURN Microphone in variety of configurations (a) Close-up of the device (b) Soda bottle with flexible microphone
to enable interactions (c) Sensing table to detect location of people around it

  Our solution results in a Self-powered Audio Triboelectric Ultra-thin Rollable Nanogenerator (SATURN)
microphone. This paper provides three research contributions for the SATURN microphone:
   • Device fabrication: Inspired by the thin, flexible design of a sound energy harvester based on the tribo-
     electric nanogenerator (TENG) [10], we have developed a simpler and cheaper fabrication technique for
     the SATURN Microphone.
   • Discovering optimal design performance: Several design parameters impact the performance of the
     SATURN microphone, specifically the geometry of a SATURN patch, the size and spacing of holes in
     the paper layer, and the method of attaching the various layers to each other. In this work, an iterative
     evaluation strategy which balanced empirical results against a theoretical understanding of the device
     was adopted to guide our design in order to achieve best performance. We built a simulation model of
     the SATURN material to examine how design parameters affect the propagation of sound vibrations
     across the material. We also empirically characterized the sound quality (acoustic sensitivity, frequency
     response, and directivity) in a controlled laboratory setting and offer a comparison against commercially
     available alternatives. This theoretical–empirical balance gives us confidence that our final design is both
     reproducible and understandable.

Proc. ACM Interact. Mob. Wearable Ubiquitous Technol., Vol. 2, No. 2, Article 60. Publication date: June 2018.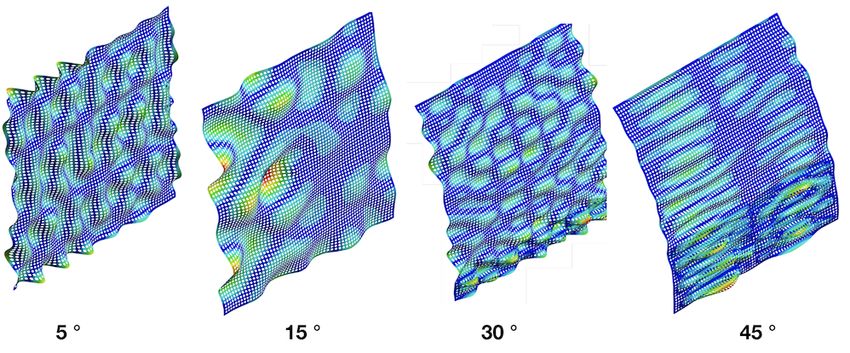
SATURN: A Thin and Flexible Self-powered Microphone Leveraging Triboelectric Nanogenerator                             •    60:3

     • Evaluation of interesting usage contexts: The SATURN microphone provides an advantageous form
       factor which is thin and flexible and can be exploited in a number of planar and circular configurations.
       We demonstrate the potential of the SATURN microphone in setting where its flexibility and passivity are
       best utilized. We compare SATURN microphone’s sensitivity to other COTS microphones. We also suggest
       device system solutions which exploit the self-powering characteristics of the SATURN microphone for
       loud decibel sound event detection.
    Demonstration of SATURN microphone design, fabrication and applications can be found at the following link:
                                    www.youtube.com/watch?v=OLuZHpa_FIM

2    RELATED WORK
   The last decade saw significant research efforts towards building low power electronics [22, 36, 47, 59, 61]. In
addition to better power management strategies, there has been a recent push to make embedded devices thin
and flexible [39, 72]. To achieve this overreaching vision of self–sustainable flexible electronics, materials science
and microelectronics communities have been working on new device designs for sensing [43, 52], computing
[42], feedback [79], energy harvesting [50] and storage [23] which leverage new materials, nano-structures, and
printing technologies. The UbiComp research community has often sought ways to make these technological
innovations more practical, reliable and easy to use for various applications [19, 20].
   To build low (or no) power and versatile form factor electronics, we need to start from individual device
components which follow this trend, so that in the future these components can be assembled together as a
single working unit. An example of one such device component is a self-powered sensor. Energy harvesters
can be redesigned to have high sensitivity for the phenomenon they generate energy from, to create sensors
which do not require power to be operated. A new breed of self-powered sensors based on the triboelectric effect
work exactly on this concept, and one recent example is the Triboelectric Nanogenerator (TENG) [64, 65, 67].
The design of these sensors is based on the principles of triboelectrification (or contact electrification) and
electrostatic induction and convert any kind of mechanical energy to a highly correlated electrical response. With
their lightweight, low-cost, and high efficiency even at low frequency, TENGs have been shown as passive or
self-powered sensors for detecting mechanical motion such as pressure[33, 76], touch[6, 17], vibrations[3, 73],
linear displacement[34, 78], speed [74], rotation[32], and acceleration[77]. Beyond saving power, TENG-based
sensors are flexible, fulfilling the requirements for a sensing unit for skin-like devices. In this paper, we are
inspired by the promise of TENGs and demonstrate how a simpler manufacturing process that does not rely on
any sophisticated nano manufacturing can be used to develop a self-powered sensor for capturing vibrations
from sound.
   There have been previous attempts to build triboelectric-based acoustic energy harvesters. Yang et al.[75]
designed a resonant air cavity using TENG structure based on aluminum and polyvinylidene fluoride (PVDF)
which converted loud sounds (e.g., a clap) to an electrical signal. This approach was redesigned to be flexible by Fan
et al. [10] using a PTFE-nanowire and paper-based device structure. As an energy harvester, the experiments were
focused on maximizing electrical response at the natural resonant frequency. Thus, only low range frequencies for
loud sounds at high sound pressure were tested. Recently, other nano-structure designs based on a ferroelectric
nanogenerator (FENG) [31] and piezoelectric nanogenerator (PENG) [68] have also been explored to make flexible
acoustic sensors, actuators, and energy harvesters.
   The triboelectric effect is not new to researchers wanting to leverage it for interactive purposes. Karagozler
et al. used the triboelectric effect to support simple interactions in a children’s storybook [19]. Paradiso’s
Interactive Balloon used the piezoelectric properties of PVDF mounted on a mylar balloon to record sounds [44],
demonstrating practical use of a self-sustaining acoustic sensor. These examples, as well as the insights from
the above-mentioned materials science work, inspire our development of the SATURN microphone. What sets

                        Proc. ACM Interact. Mob. Wearable Ubiquitous Technol., Vol. 2, No. 2, Article 60. Publication date: June 2018.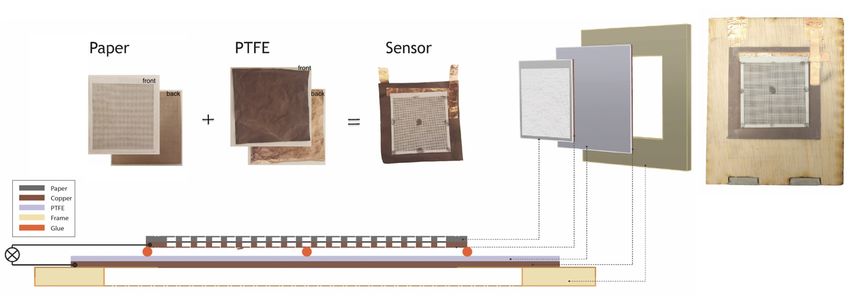
60:4    • N. Arora et al.

the work of this paper apart from all of this previous work is a rigorous exploration of the design features that
make triboelectric-based acoustic sensing practical for a variety of interesting application scenarios. These design
features include:
    • Low-cost fabrication: Previous work employs nano-fabrication techniques, like inductive coupling
      etching-process (ICP etch), microplasma discharge [31], and nanowire growth [10]. These methods must
      be precise, which makes the device fabrication on a practical manufacturing scale difficult, expensive, and
      requiring a high skill level for production. We seek a fabrication technique that is inexpensive and does not
      significantly compromise signal quality.
    • Wider acoustic range: Low frequency ranges (< 1000 Hz) and high sound pressure levels are sufficient
      to demonstrate a device as a sound energy harvester, working at some resonant frequency, but not to
      demonstrate the device as a sound sensor. For example, in telephony, the usable frequency band range
      for voice is approximately 300 Hz to 3400 Hz. We seek a flexible thin sound sensing material which is
      sensitive across this wider band of the human audible range. We also want sensitivity beyond the voice
      band, including up 4-6 kHz for sound clarity and definition.
    • Performance reliability: Fabrication techniques should be reproducible i.e two microphones produced
      with the same technique should be similar in acoustic performance.
   Our paper hopes to bridge the gap between material science and ubiquitous computing communities for self-
powered, flexible acoustic sensors. We explore a simpler fabrication technique for the SATURN microphone versus
the techniques for the original TENG devices. We provide a detailed and reproducible guide to construct SATURN
microphones which can be followed, and improved upon, by others. We evaluate the SATURN microphone’s audio
characteristics and compare it with state-of-the-art microphones. In Section 9, we demonstrate two implemented
applications of the SATURN microphone to show its use in practice. Those implemented applications, however,
only exhibit the passive microphone capabilities of SATURN and still require traditional powered components to
receive and process the audio signal.

3 HOW THE SATURN MICROPHONE WORKS
3.1 Theory of Operation : Triboelectric Nanogenerator
   The operation of the SATURN microphone is based on the principle of two, coupled phenomena—electrostatic
induction and contact electrification. Electrostatic induction is the generation of opposite charges on two different
materials, while contact electrification or triboelectrification, is charge transfer between two surfaces in contact.
The fundamental theory of triboelectrification lies in Maxwell's displacement current and change in surface
polarization [66]. By introducing a thin conducting electrification layer, the charge difference between the two
polarized surfaces generated due to triboelectricity can be measured. This combined structure is called the
triboelectric nanogenerator (TENG). The polarity and strength of the charges produced are dependent on many
material variables such as surface roughness, temperature, and dielectric constant.

3.2    Device Design
   The multi-layered device structure of the SATURN microphone is schematically depicted in Figure 2. It consists
of a thin film of dielectric polytetrafluoroethylene (PTFE), which has a permanent negative charge stored on its
surface, sandwiched between two copper layers. These copper layers act as electrification layers that generate
triboelectric charges upon coming in contact with PTFE. The first layer of the copper is laminated on the PTFE
itself (bottom layer) while the other is deposited on paper (top layer). The paper in the SATURN microphone
structure is neutral and used only for structural support for the copper electrification layer which comes in
contact with PTFE due to vibration. To minimize the air friction which dampens the vibrations, holes have been
introduced on the paper to act as a mini-resonant cavity for air when sound propagates, resulting in enhancement

Proc. ACM Interact. Mob. Wearable Ubiquitous Technol., Vol. 2, No. 2, Article 60. Publication date: June 2018.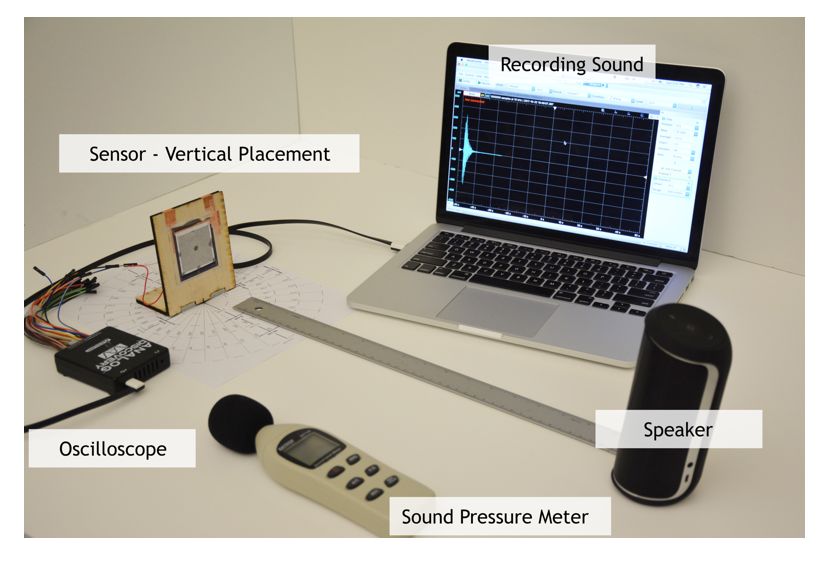
SATURN: A Thin and Flexible Self-powered Microphone Leveraging Triboelectric Nanogenerator                            •    60:5

of the vibration effect. Paper is used because of its flexibility, lightweight structure, low cost, and ease of cutting
holes.

             Fig. 2. Structural design of SATURN Microphone consisting of copper coated paper and PTFE

3.3    Working Mechanism
   The SATURN microphone works on the principle of vibration-induced contact and charge generation due to
triboelectrification and electrostatic induction. This process is explained in detail in Figure 3. Propagation of the
sound through air causes compression and rarefaction corresponding to the frequencies present in it.

                    Fig. 3. Cycle of electricity generation process under external acoustic excitation
  When a compression is incident on the SATURN microphone it causes vibrations in its membrane-like structure,
resulting in the copper layer on the paper coming in contact with the PTFE (Figure 3 a). Contact electrification
generates charges on both surfaces—PTFE, which has a greater electron affinity, is able to gain electrons from the
copper[2] and becomes negatively charged, whereas the copper layer on the paper becomes positively charged.
When subsequent rarefaction separates the paper and the PTFE (Figure 3b), it induces a potential difference
across the two copper electrodes, causing current to flow from paper towards PTFE if the device is connected to

                        Proc. ACM Interact. Mob. Wearable Ubiquitous Technol., Vol. 2, No. 2, Article 60. Publication date: June 2018.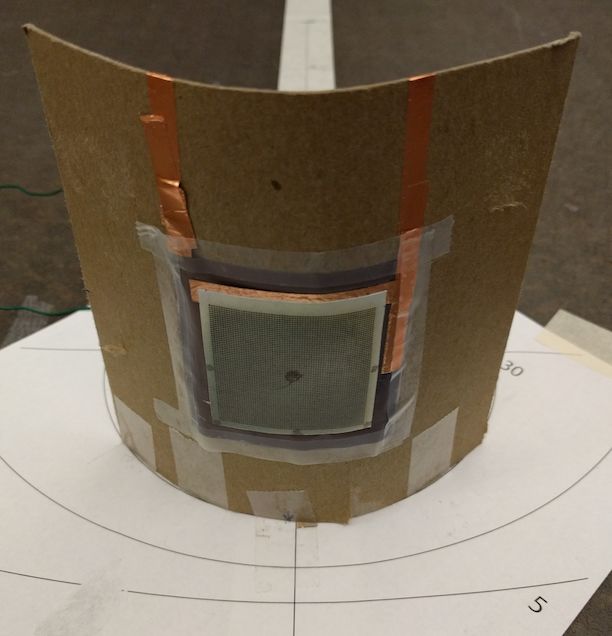
60:6 • N. Arora et al.
an external load. This flow of current reverses the polarity (Figure 3c) of charges on the two copper electrodes
(i.e., now the copper on PTFE has more positive charge than the copper layer on the paper). The next compression
results in the paper moving towards the PTFE again, resulting in a reversed direction of current flow (Figure 3d),
completing the cycle of electricity generation.
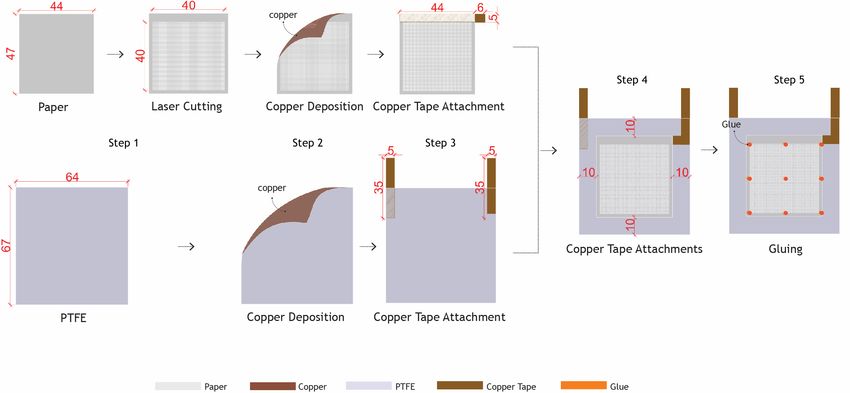
4 FABRICATION
The SATURN microphone consists of two attached layers—paper and PTFE, both with a deposition of copper
(Figure 4). The fabrication steps are explained in detail below and depicted in Figure 4. 1
Fig. 4. Fabrication Process : (1) Preparation of micro-hole paper (2) Deposition of copper layer (3) Attaching copper tape as
electrodes (4) Stacking paper and PTFE (5) Gluing paper and PTFE. All dimensions are in mm.
(1) Preparation of micro-hole paper : We start with standard copier paper of 0.04 mm thickness. 400 µm
diameter holes with an even spacing of 200µm are cut into the paper in a grid pattern using a micro-laser
cutter, a Universal Laser System PLS6MW using 9.3 µm CO 2 at 80% power and a 700 PPI rastor mode at
20% speed. The hole pattern forms a 4cm x 4cm square grid. A small border of 5mm on one side and 2mm
on the other side is left to be used for attachment to the PTFE layer. This border is kept small to ensure
ease of reproducibility of the cavity created between copper and paper after being attached together.
(2) Deposition of copper layer : The paper sheet with micro-holes (step 1) and a PTFE sheet (6cm x 6cm
with 0.05 mm thickness) are coated on one side with a thin layer of copper that act as electrodes. The
copper is applied using a standard sputtering technique inside a PVD chamber (a Leskar PVD75) with a
chamber pressure of 6x10− 6 torr. The deposition time is set to 45 minutes, resulting in a 0.15 µm copper
layer thickness on the paper and the PTFE. This allows the copper to deposit on the paper but not obstruct
the micro-holes. The border of the perforated-paper is also coated with copper.
1 Video of fabrication process: www.youtube.com/watch?v=lTJPWALCYe8
Proc. ACM Interact. Mob. Wearable Ubiquitous Technol., Vol. 2, No. 2, Article 60. Publication date: June 2018.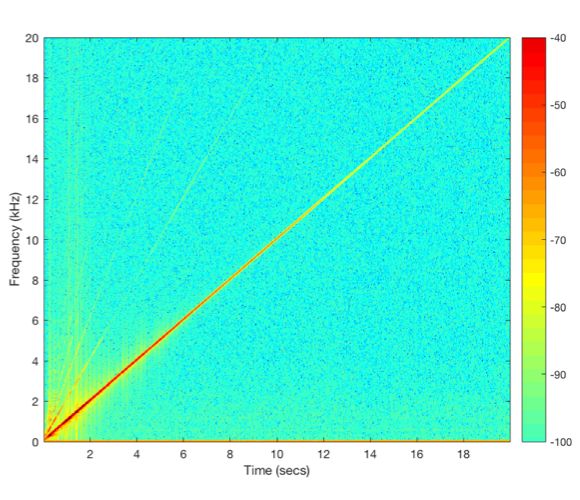
SATURN: A Thin and Flexible Self-powered Microphone Leveraging Triboelectric Nanogenerator                              •    60:7

  (3) Attaching copper tape as electrodes : We attach conductive copper tape to the copper coated side of
      the paper and the PTFE in order to extend the electrodes for measurement purposes or to connect to an
      external circuit.
  (4) Stacking paper and PTFE : The paper and PTFE are placed on top of each other such that the copper
      layer of paper is on top of the non-coated side of PTFE, which is non-conducting. To avoid a short circuit,
      we ensure that the copper tape attached to the copper coated side of the paper does not touch the copper
      laminated side of the PTFE and vice versa. Finally, the copper tape from the paper is attached to the second
      copper tape on the uncoated side of PTFE.
  (5) Gluing paper and PTFE : The paper layer (copper side facing PTFE) is glued to the uncoated PTFE side
      using glue dots at nine anchor points.
  Structural parameter values mentioned above, like hole size, hole spacing, and attachment points for paper to
PTFE, were determined by performing experiments and simulation, as discussed in detail in Section 5 on device
design optimization. The final thickness of the constructed SATURN microphone patch is measured to be 150 µm,
which is comparable to that of standard copier paper. This sensor can be attached to objects using glue on the
edges of copper side of the PTFE layer.

5     DEVICE DESIGN OPTIMIZATION
   The main aim of device design optimization for SATURN microphone is to increase electrical response across
wider range of frequencies in order to achieve a better acoustic sensitivity. This allows sounds of lower decibel
levels to be detected, thus opening doors for wide variety of applications.

5.1    Factors Effecting Device Performance
   The SATURN microphone consists of paper and PTFE, which are both flexible and vibrate to act as two plates
of a capacitor to produce an electrical response. In previous descriptions of the behavior of a Triboelectric
Nanogenerator ([65, 66]), it was assumed that the two layers are rigid. In that case, the open circuit potential
difference generated by the device as a function of time(t) is given by the equation [41]:
                                                                  σx(t)
                                                          Voc =                                                                     (1)
                                                                   ϵ0
  where, x(t) is the physical separation distance between the PTFE and paper, σ is the charge density generated
on the surface, and ϵ0 is the relative permittivity of the dielectric. This mathematical model is overly simplified,
and would not work for SATURN microphone because neither the paper nor the PTFE layer are rigid. In practice,
the PTFE layer will be attached to a surface, so we will continue to assume it is rigid. The paper layer, however,
behaves more like a flexible membrane and will vibrate. Keeping the vibration of paper in mind we have derived
a modified formula below.

Fig. 5. Factors effecting potential difference generation : σe f f ective surface charge density and de f f ective separation
distance between the two plates

                          Proc. ACM Interact. Mob. Wearable Ubiquitous Technol., Vol. 2, No. 2, Article 60. Publication date: June 2018.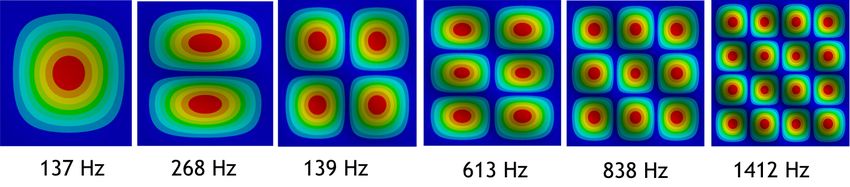
60:8    • N. Arora et al.

   The separation distance between the paper and PTFE layers changes over time when we assume that the
paper layer is vibrating, as shown in Figure 5. When our membrane is placed in the Y-Z plane of a right-handed
reference coordinate frame, if we take an infinitesimal element with area dy.dz at a location (0, y, z) w.r.t. the
origin, then the potential difference across the infinitesimal element is a slight modification of equation 1 and is
given by:
                                                           σef f
                                                   Voc =         x(y, z, t),                                          (2)
                                                            ϵ0
where σe f f is the effective surface charge density, and the separation distance x is a function of y , z and time,
which varies along y and z for the flexible membrane. Hence, the open circuit potential difference for a flexible
paper layer can be written as:
                                                     σef f
                                                           ∬
                                              Voc =              x(y, z, t) dy dz.                                    (3)
                                                      Aϵ0    A
   To increase VOC for the SATURN microphone there are two parts in this equation which can be optimized:
   (1) σe f f : Effective surface charge density which is dependent on ∬       the roughness of the PTFE surface; and
   (2) de f f : Effective separation distance during flexural vibrations is A x(y, z, t) dy dz/A and is mainly dependent
       on the ability of the paper to vibrate.

5.2    Method of Evaluation
   To guide our structural device design we use combination of two evaluation techniques:
   (1) Simulation : a structural modal analysis to simulate the dynamic vibration behavior of the paper in order
       to to determine de f f , amplitude of effective separation distance; and
   (2) Experiment : an empirical experimentation with fabricated SATURN microphones to determine the
       electrical response in a controlled sound environment
   5.2.1 Structural Modal Analysis. Modal analysis is the method to identify the natural frequencies of vibrations
of a material and the mode shapes of a structure. The deformed shape of the structure at a specific natural
frequency of vibration is termed as its mode shape of vibration. A thin membrane-like structure such as that
of SATURN microphone has infinite modal frequencies and mode shapes. The material response for a given
input load is linear combination of these mode shapes. We used a 3-D finite element (FE) model mesh using
tetrahedral elements to perform the modal analysis using ANSYS.2 The glued attachments points of the paper
with PTFE (described in Step 5 of the fabrication process in Figure 4), were meshed separately, to be assigned as
fixed support (see Figure 6a).

          (a)                                                                  (b)

Fig. 6. Modal analysis done using ANSYS Inc. software : (a) 3D Finite Element model of paper with meshed tetrahedral
structure with zoomed in central fixed support point. (b) Modal shapes of paper at different natural frequencies.
2 http://www.ansys.com/

Proc. ACM Interact. Mob. Wearable Ubiquitous Technol., Vol. 2, No. 2, Article 60. Publication date: June 2018.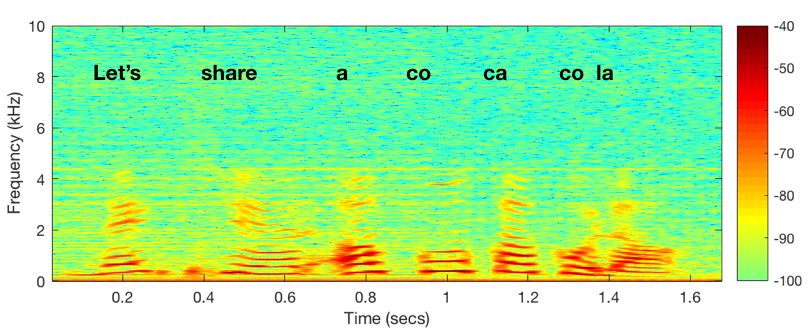
SATURN: A Thin and Flexible Self-powered Microphone Leveraging Triboelectric Nanogenerator                              •    60:9

    We use lower modes of vibrations, i.e., mode shapes with lower natural frequencies, as they are easy to visualize
with the number of peaks and crests less as compared to the mode associated with a higher natural frequency.
Figure 6b shows an example of different modes of vibration for paper anchored around the edges.3 The transverse
deformation, or vertical deflection, is plotted with the help of colored contours. For each normal mode shape, the
contours are plotted and arranged from blue to red such that blue represents zero or negligible vertical deflection
whereas red represents the location of maximum vertical deflection possible.
    The value of the vertical defection of a point, obtained from the modal analysis, is referred to as the amplitude
of separation  of a point, x(y,z,t) in Equation 3. The integral of the amplitude of separation at each of these points is
de f f or A x(y, z, t) dy dz/A. We will choose the structural design which has a higher def f during modal analysis,
         ∬

as it will have a higher electrical response. For structural designs which have the same boundary condition
(points of fixation) we can also use dmax , maximum amplitude of separation of the same mode shape to compare.
This is because calculating dmax is simpler than determining def f which involves integral.
   5.2.2 Acoustic Characterization : Sensitivity and Frequency Response. We use frequency sweep, or chirp as
the input sound recording to observe the electrical response of SATURN microphone to characterize its quality.
Chirp is a sine wave linearly increasing in frequency (20Hz-20kHz) in a particular time period (Figure 7). We
standardize the 1000 Hz frequency to sound pressure level of 94 dB S P L or 1 Pa pressure. The power in dB re
mV/Pa at 1000 Hz frequency is defined as acoustic sensitivity of microphone. It is used as a representative of the
sound quality of a microphone. JBL Flip 2 speaker (100 Hz-20kHz flat frequency response) is used as sound input
device (frequency sweep, tone) for our experiments. The sound loudness was measured using Sound Pressure
Level (SPL) meter by Extech Instruments. The electrical response generated by SATURN microphone is measured
as voltage using Analog Discovery oscilloscope which has 1 MΩ resistance.

                                (a)                                                           (b)

Fig. 7. Acoustic Characterization: (a) Chirp sound Input : linearly increasing 20Hz-20000 Hz frequency sweep in 20 seconds
(b) Experimental setup for recording electrical response of SATURN microphone.

  Figure 8 shows an example of the electrical response for SATURN microphone for the chirp sound input. We
use voltage as a measure of the electrical response, as the current produced by the SATURN device is extremely
small (nano-amps in magnitude), which makes it susceptible to the background noise. The maximum voltage is
achieved at the resonant frequency of approximately 275 Hz. At 1000 Hz, the acoustic sensitivity is -26.63 dB re
3 We used values of 3 GPa Young's modulus of elasticity, 0.04 mm thickness, 47mm x 44mm dimensions, and 1.2 д/cm 3 density for the
vibrating paper layer.

                           Proc. ACM Interact. Mob. Wearable Ubiquitous Technol., Vol. 2, No. 2, Article 60. Publication date: June 2018.
60:10      •    N. Arora et al.

mV/Pa. We will be using both a frequency response curve and acoustic sensitivity to select optimal structural
design parameters.

                       (a)                                (b)                                                (c)

Fig. 8. Example of electrical response from SATURN Microphone for chirp sound input: (a) Voltage time series output
(b) Spectrogram with linearly increasing frequency (c) Acoustic sensitivity variation across the audio frequency band
(20Hz-20kHz).

5.3     Separation Distance Optimization
   The paper layer is a critical component to be designed precisely in the SATURN microphone structure to
maximize the separation distance between the two layers and hence the output from the device. To do so, we
introduce various structural changes to the paper layer, described next.
   5.3.1       Pattern of Holes in the Paper Layer.

                 (a)                                                                (b)

Fig. 9. Introduction of holes enhances vibration: (a) mini-resonant air cavities formed between paper and PTFE which result
in reduction of air-dampening (b) Example of modal analysis of paper with and without holes showing introduction of holes
increases the dmax and de f f
   The introduction of holes in a structure is a well known techniques to enhance vibrations in it. To test this
hypothesis, we performed modal analysis of a sheet of paper (3 GPa Youngś modulus of elasticity, 0.04 mm
thickness, 47mm x 44mm dimensions) and compared it with perforated paper with holes (400µm diameter, 200µm
spacing) (Figure 9). Both the models have similar mode shapes due to similar rigid support points and material
properties. This allows for comparison on the basis of two parameters, both of which are representative of the
voltage response Voc :

Proc. ACM Interact. Mob. Wearable Ubiquitous Technol., Vol. 2, No. 2, Article 60. Publication date: June 2018.
SATURN: A Thin and Flexible Self-powered Microphone Leveraging Triboelectric Nanogenerator • 60:11
• dmax : The magnitude of maximum transverse deformation of paper with no holes is 145 µm, as shown in
the legend in Figure 9, while paper with no holes is 187 µm which is approximately 40 µm less.
• de f f : Paper with no holes has effective separation distance of 40 µm , while the one with holes is 45.3 µm.
Both parameters dmax and de f f , suggest that the holes on the paper can help in the optimization of separation
distance. We can explain this by the following reasons:
• Holes allow the air to flow between the two layers, allowing air to pass through the holes and force the
two layers to move away from each other.
• Perforated paper has less stiffness. Bending stiffness of a structure refers to the resistance to transverse
deformation. Thus, the perforated paper layer would result in larger separation distance as compared to
the paper layer without holes.
While introducing holes increases the separation between layers, it also reduces the contact surface area and
thus effective charge density σ is decreased, which would decrease the voltage. Thus, there is a trade-off between
contact area and the hole parameters of size, distribution, and pattern. Modeling vibrations of the system to
respect air pressure changes and weight is beyond the scope of this paper. Instead, we provide empirical results
to determine good hole dimensions.
(a) (b) (c)
Fig. 10. Selection of dimensions for hole on paper: (a) 0.4 mm diameter hole had the best acoustic sensitivity amongst
different diameter sizes we tested. (b) Frequency response for different hole spacing shows that 0.2 mm spacing performs the
best with 0.4mm diameter. (c) Circular and grid hole pattern performance.
Keeping the distance between holes fixed at 0.2 mm, we fabricated a 4x4 cm 2 SATURN microphone patches
with increasing hole diameter (Figure 10). 0.4 mm diameter hole achieved the best acoustic sensitivity of -26 dB
among our samples. Next keeping the hole diameter at 0.4 mm we increased the spacing between the holes to be
0.2 mm, 0.3 mm, and 0.4 mm i.e having percentage of hole area to be 35%, 26%, and 20% respectively. SATURN
microphone with 0.3 mm spacing gives the best acoustic sensitivity but the device with 0.2 mm spacing performs
slightly better within the first 2 kHz frequency band, where more than 70% of the sound information is present[9].
Next, we experimented with two different patterns of holes – concentric and grid – to determine their effect
on the frequency response. The grid pattern of holes performed better than concentric pattern arrangement
We determined previously in our hole distribution study that 35% hole area performs better than the 25% hole
area. Since grid has 35% hole area it performs better than the concentric circle which is 25%. Thus, for all our
future experiments and modal analysis we will choose to use 0.2 mm hole spacing, 0.4 mm hole diameter in a
grid pattern.
5.3.2 Paper and PTFE Attachment Position. By controlling the locations where paper is attached to the PTFE
in the SATURN microphone structure, we can generate motion with a higher amplitude of motion with the
same sound input. This can be done by choosing attachment points which are coincident with the nodes of zero
Proc. ACM Interact. Mob. Wearable Ubiquitous Technol., Vol. 2, No. 2, Article 60. Publication date: June 2018.60:12 • N. Arora et al.
movement for majority of the mode shapes possible (Figure 11). We tested two cases for the perforated paper
model: glued across all the edges; and glued at 9 points like a grid.
(a) (b)
Fig. 11. Different attachment positions: (a) paper glued to PTFE across all edges (b) paper glued to PTFE at 9 points
Figure 12 shows the modal shapes for mode 3 for paper in the two cases discussed. Just by visual observation
we can notice that mode shape for paper pasted at edges (case 1) is out of phase, creating minimum and maximum
contact with PTFE at the same time, whereas for the 9 glue points (case 2) they are in phase. In addition, as shown
the legend, dmax for case 2 is 7µm (194µm − 187µm) more than case 1. This trend is also supported by def f as
case 2 (52.6 µm) is 8µm more than case 1 (45.3µm). By simulations we can conclude that 9 points glue grid has
more separation distance and thus consequently should generate more electrical signal.
(a) (b)
Fig. 12. Modal analysis demonstrates that grid-glue pattern attachment performs better than glue on all edges: (a) mode 3
of paper glued at all edges showing maximum. separation distance to be 187µm (b) mode 3 of paper glued at 9 points like a
grid with maximum separation distance of 194µm.
We validated these simulation results with empirical measurements. By simply changing the anchoring of the
paper layer to the PTFE, there is a large jump of approx 20 dB (re mV/Pa) in the power of the voltage measured
(Figure 13a ) all across the frequency band.
Having grid like glue pattern allows the edges to vibrate which are otherwise restricted in the glue pattern where
all edges are pasted. This effect becomes more enhanced at higher frequencies (mode 14 shown in Figure 13b),
where edges haver even higher amplitude of separation than even the central nodes. By choosing appropriate
boundary conditions of the fixed points, the maximum vibration amplitude can be obtained under certain load
conditions to increase the voltage.
Proc. ACM Interact. Mob. Wearable Ubiquitous Technol., Vol. 2, No. 2, Article 60. Publication date: June 2018.SATURN: A Thin and Flexible Self-powered Microphone Leveraging Triboelectric Nanogenerator • 60:13
(a) (b)
Fig. 13. Impact of gluing pattern: (a) Increase of approximately 20 dB with 9-point grid glue pattern (red line). (b) Modal
analysis of perforated square paper with holes pasted at 9 points demonstrating involvement of edges which increases the
voltage response.
5.3.3 Changing the Geometry. Changing the geometry of the surface on which sound is incident while
maintaining the same area changes the air pressure which is applied at different points. This changes the mode
shapes and affects the way the structure will exchange kinetic-energy and strain-energy at its nodes and anti-
nodes. Thus geometry impacts the amplitude of vibrations which directly impacts the separation distance and
the output voltage.
We tested two different geometries with same 1600 mm 2 area: a square (4x4 cm 2 ); and a circle (22.57mm
diameter). Experimentally, up to 1000 Hz the circle and square perform nearly the same. For higher frequencies,
the circle performs almost 10 dB better than the square (Figure 14a). Thus, choosing a circular shape for the
SATURN microphone would improve sound quality. A modal analysis confirms our empirical results. Just by
visual inspection the dmax , the amplitude of maximum separation reached by circle is almost 16µm more (Figure
14b) than square. We use Equation 3 to calculate def f , effective separation amplitude, which was found to be
67.2 µm for the circle and 52.6 µm for the square, that is approximately 15 µm more. After optimizing device
structural parameters both theoretically and empirically for the separation distance, we are able to reach the best
acoustic sensitivity of -25.63 dB (re mV/Pa) at 1000 Hz with a circular shape of 16cm2 area with a grid pattern of
holes of 0.4mm diameter and 0.2mm spacing glued at 8 equally distant points around the edges and the center to
the PTFE.
(a) (b)
Fig. 14. Circular shape performs better than square of the same area : (a) Experimental analysis of effect of geometry on
Frequency response (b) modal analysis for circle and square for mode 3 showing circle has more max. amplitude of separation
5.4 Optimization of Surface Charge Density
5.4.1 Plasma treatment for PTFE surface. Equation 3 shows that the voltage response of the SATURN micro-
phone is dependent on the surface charge density, which is the measure of electric charge per unit length. Fan et
al. [10] used PTFE polymer nanowires to increase the charge density σ by increasing the effective surface area of
Proc. ACM Interact. Mob. Wearable Ubiquitous Technol., Vol. 2, No. 2, Article 60. Publication date: June 2018.60:14 • N. Arora et al.
the dielectric surface in contact. Growing nano-wires is a very expensive process which is currently unsuitable
for large scale, low-cost manufacturing. To understand the effect of such nano-structures on PTFE for SATURN
microphone’s performance, we use a simpler, though still relatively expensive, method called plasma treatment.
The PTFE was etched by O 2 plasma produced by a PE-100 Plasma System (from Plasma Etch Inc.) O 2 was
uniformly distributed in the reactor throughout the etching process. Figure 15a shows schematic diagram of
the O2 etching process where a blast of high-speed stream of glow discharge is shot at PTFE. The RF power
input was 300 W using a 13.56 MHz RF generator with RF auto-matching network and the plasma treatment time
was 20 min. Figure 15b shows the scanning electron microscope (SEM) image of PTFE after plasma treatment.
This PTFE was later coated with copper using as general fabrication process explained in section 4. Due to
increased roughness on the PTFE surface resulting in increased contact electrification the performance with
plasma treatment improves by approximately 10 dB across the entire frequency response as shown in Figure
Figure 15c.
Even though there is an increase in the signal quality, with acoustic sensitivity of -16.28 dB re mV/Pa, the cost
addition does may not justify the performance increase for SATURN microphone fabrication in many scenarios.
Therefore for our further experiments we have tried to focus more on regular PTFE rather than one treated with
plasma.
(a) (b) (c)
Fig. 15. Effect of Plasma treatment on SATURN microphone sensitivity (a) Schematic diagram of O 2 plasma etching (b)
Scanning Electron Microscope (SEM) image of plasma treated PTFE used for SATURN mic manufactured at 500nm scale (c)
Experimental comparison between performance of SATURN microphone fabricated with PTFE treated with and without
plasma
5.5 Intra-device Performance Results
Fig. 16. Intra-device performance of SATURN microphone patch represented as deviation in acoustic sensitivity. (n=6)
Proc. ACM Interact. Mob. Wearable Ubiquitous Technol., Vol. 2, No. 2, Article 60. Publication date: June 2018.SATURN: A Thin and Flexible Self-powered Microphone Leveraging Triboelectric Nanogenerator • 60:15
To use the SATURN microphone in applications, it is important to have an understanding of the variation
in its electrical performance between instances of similarly manufactured examples, what we call intra-device
performance. In an ideal device fabrication process, each device should be identical to another, but in practice
deviations may be introduced due to different batches of base materials or construction precision. To understand
reproducibility of our fabrication process, we constructed six SATURN microphone devices ( square 4x4 cm 2
patches, non-plasma PTFE, optimal holes, grid-like glue attachment).
Figure 16 shows the standard deviation of acoustic sensitivity (1000 Hz tone at 94 dB S P L ) performance. All
devices have > -35 dB acoustic sensitivity, with the best performance at -26.44 dB and mean as -29.5 dB. The
intra-device reproducibility has tolerance of 10 db for our fabrication process.
6 MOUNTING OF SATURN MICROPHONE
Just as a pattern of holes allows for greater vibration of the paper layer, so to can the support structure used to
mount the PTFE layer affect its vibration, and thus the electrical response of the SATURN microphone.
6.1 Supported vs Unsupported Back Frame Structures
To understand the effect of a back support, we experimented with two kinds of frames (Figure 17a): a full solid
back support; and a hollow frame, in which we cut a hole to allow more vibration. The material used for the
frame was foam board to which a non-plasma treated 4x4 cm 2 SATURN patch with optimal separation distance
parameters was attached.
The performance decreased by approximately 10 dB with the solid back support as compared to the frame
with no support. This is because having a support at the back restricts the free movement of PTFE (Figure 17b).
Interestingly, having back support showed an increase in sensitivity around 6-8kHz, while its framed counterpart
just has a decreasing trend. We studied this further by doing modal analysis combined system of of PTFE (440 MPa
Young's modulus of elasticity, 0.05 mm thickness, 2.2 д/cm 3 density) pasted to foam-board (Young’s modulus 0.1
GPa, 0.5mm thickness, 0.3 д/cm 3 density). The def f , amplitude of effective separation for natural frequencies of
the system at 2887 Hz is 28 mm while 6900 Hz is about 34 mm. This behavior may be attributed to the coherence
of natural frequency of movement for PTFE and back-support. Further consideration of different solid back
supports is warranted, as they might produce sensitivity peaks at different frequency bands. We address this next.
(a) (b) (c)
Fig. 17. Effect of different support structures on the signal quality : (a) Frames with full back support and unsupported with
hole (b) Frequency response comparison between supported and unsupported (c) Modal analysis of combined PTFE/Foam
structure with full back support at 2887 Hz and 6962 Hz which explains the sudden rise in sensitivity around 6-8 kHz
6.2 Back Support Materials
Even though the framed, unsupported structure is better, there might be situations when a SATURN microphone
needs to be embedded directly onto an object. We embedded the device on different material surfaces (Figure 18)
to determined their frequency response. Table 1 shows the acoustic sensitivity we recorded from the experiment
Proc. ACM Interact. Mob. Wearable Ubiquitous Technol., Vol. 2, No. 2, Article 60. Publication date: June 2018.60:16 • N. Arora et al.
Back Support Material Youngś Modulus (GPa) Sensitivity(dB)
thin foam core 0.1 -30
thick foam board 0.5 -32
cardboard 0.9 -32
wood 3 -35
plastic 10 -37
aluminum 70 -64
Table 1. Effect of back support material on Acoustic Sensi-
tivity of SATURN : Back support material with lower Youngś
Modulus results in higher sensitivity
Fig. 18. Frequency response for different frame materials
for full back support
versus the Youngś modulus of the material. There is a correlation between the flexibility of the material and
the sensitivity of a SATURN microphone mounted on that material. For example, metal, with highest stiffness
amongst all materials tested, reduces the vibration more than plastic or wood. Thus the back support material
properties are a factor in determining the signal quality.
6.3 Orientation
(a) (b)
Fig. 19. Effect on orientation on acoustic sensitivity (a) Schematic diagram of experimental setup showing the SATURN mi-
crophone in vertical and horizontal positions with 94 dB sound incident (b) polar patterns representing SATURN Microphones’
directionality
Changing the orientation of the SATURN microphone changes the sound field incident on it and consequently
electrical response produced due to the vibrations. For example, a SATURN microphone placed on a table would
receive different amplitudes of voltage for its horizontal and vertical orientations.
To understand this better, we performed an experiment with SATURN microphone (4x4cm 2 optimal structural
parameters, non-plasma PTFE, attached to foam-board frame with unsupported back) placed horizontally and
vertically as shown in Figure 19. A sound source of 1000 Hz frequency tone at 1 Pa was rotated from 0 to 360
degrees around the microphone to plot the directivity pattern. The SATURN microphone is omnidirectional in both
horizontal and vertical orientations which is useful for applications such as gathering context in the environment.
However, when SATURN is embedded on objects with full back support, we would obtain unidirectional directivity
of the microphone, i.e, a semi circle instead of a circle.
In addition when tested for different orientation, there is drop in acoustic sensitivity by 10 dB when SATURN
is placed horizontally in front of the sound source as opposed to vertically. Even though vertical orientation is
Proc. ACM Interact. Mob. Wearable Ubiquitous Technol., Vol. 2, No. 2, Article 60. Publication date: June 2018.SATURN: A Thin and Flexible Self-powered Microphone Leveraging Triboelectric Nanogenerator • 60:17
preferred, there may be applications where horizontal placement is required, as such the experimental comparison
is important.
6.4 Patch Size
For a traditional microphone, the size of the diaphragm affects the microphone's sound pressure level handling,
sensitivity, dynamic range and internal noise level. The SATURN microphone is similar to the diaphragm of the
traditional microphone, so it is reasonable to consider how its size impacts performance.
We did a preliminary test of 3 different sized SATURN patches ( 8x8 cm 2 ,4x4 cm 2 , 2x2 cm 2 ), each using the
structural parameters that produce the best results for the 4x4 cm 2 patch described earlier (Section 5) and placed
on vertical frame with sound chirp input. The acoustic sensitivity is -18 dB, -25 dB, and -40dB respectively,
suggesting improved performance for a larger SATURN microphone. These preliminary results show a favorable
trend, but a more in depth analysis is needed, and each patch size should be separately optimized, in the same
way we optimized for the 4x4 cm 2 size.
(a) (b)
Fig. 20. Effect of SATURN microphone size on the signal quality (a)different patch sizes used for experiment (b) Acoustic
sensitivity comparison plot for different sizes
6.5 Flexibility
The SATURN microphone has a thin structure which gives it the affordance to be bent. It is important to
understand how the bending impacts the signal quality. Bending of any object adds strain in the object, which
leads to increased potential energy, and loss of ability to vibrate or gain kinetic energy. We study the effect of
bending using 4x4 cm 2 SATURN microphone patch with non-plasma PTFE with optimal holes size and fixing
point. The patch is bent to 7 different radii of curvature corresponding to the central angle theta (5◦ , 15◦ , 30◦ , 45◦ ,
60◦ , 75◦ , 100◦ ) as shown in Figure 21a. We performed modal analysis for the curved 3D models of paper with
holes for 4 different angles - 5◦ , 15◦ , 30◦ and 45◦ . Figure 21b shows the effective amplitude of separation, def f of
the 4 models for mode nearest to 1000 Hz, the frequency where acoustic sensitivity is defined. Figure 21c is the
snapshot of the corresponding to de f f . We can see that the with increase in bending def f reduces almost linearly.
Next, we performed the experiment to determine change in acoustic sensitivity with increased bending for
fabricated 4x4 cm 2 patch. The SATURN patch was embedded in cardboard as shown in the Figure 22a and bent at
7 different radii of curvature successively making sure that the cardboard follows the lines of curvature. Figure
22b shows successive drop in acoustic sensitivity with smaller radii of curvature, thus following the expected
trend from modal analyses. Having a SATURN microphone structure and bending it results in an increased
bending stiffness, which effects the ability of the SATURN microphone to vibrate and reduces the voltage it can
Proc. ACM Interact. Mob. Wearable Ubiquitous Technol., Vol. 2, No. 2, Article 60. Publication date: June 2018.60:18 • N. Arora et al.
achieve. A flat SATURN mic patch used can achieve sensitivity of -27.3 dB which reduces by 8 dB for 45 degrees
bent. For the next 45 degrees of bending the drop is much more enhanced as the stiffness increases.
(a) (b) (c)
Fig. 21. Effect of flexibility on Effective separation (a) 7 different radii of curvature were drawn on paper corresponding to
central angle theta which 4x4 cm2 patch would make when bent (b) plot demonstrating decrease in effective separation
distance with increased bending (c) Modal analysis of 3D meshed model of paper at when subjected to 1 Pa pressure at 1000
Hz
As a result of the design and the fabrication process, the SATURN patch reliability in flexible scenarios may be
strongly affected by material stress on the glue points, and tension in the material when transitioning from flat to
bended layouts. Some scenarios were tested during the flexibility analysis, however a more extensive analysis
on the fabrication process for flexible scenarios is required in order to find a solution that preserve the sound
sensitivity and adaptability to different shapes.
(a) (b)
Fig. 22. Experimental results for effect of flexibility (a) SATURN microphone was bent accurately to follow the curved
curvature line e.g. 30◦ (b) Change in acoustic senstivity (1000Hz @ 94 dB S P L obtained for different radii of curvature
7 COMPARISON TO COTS MICROPHONE
There are factors in microphone device design—signal quality, power, form factor (size and flexibility) and
cost/ease of manufacture—which dictate whether a given acoustic sensor meets the requirements of any given
acoustic application. Device designers often face the trade-off between the sensor signal quality and the other
design parameters. For example, condenser microphones are used in the recording studio have very high sound
quality but consume power in tens or hundreds of mW and are relatively expensive, all of which is appropriate
for that niche application. Electret microphones, commonly found in consumer electronic devices, consume
Proc. ACM Interact. Mob. Wearable Ubiquitous Technol., Vol. 2, No. 2, Article 60. Publication date: June 2018.SATURN: A Thin and Flexible Self-powered Microphone Leveraging Triboelectric Nanogenerator • 60:19
200-500 µW to achieve sensitivity greater than -25 dB. They mostly use power as biasing voltage for the MOSFET
or for amplification.
We compared 3 commercially-available off the shelf (COTS) microphones with SATURN mic – 1. iPhone
6s which has invensense INMP441 [18] 2. Sparkfun’s MEMS ADMP 401 with 1.5V of DC bias voltage [58] 3.
Omni-Directional Foil Electret Microphone with 1.5 DC bias [57], in the same lab setting with same input chirp
sound input as used for our previous SATURN mic experiments. We first performed these experiment in a quiet
room with 45dB S P L measured as silence. The SNR was calculated by subtracting the power of the ambient/silent
recordings (noise) of the microphone being studied from the power obtained by the chirp input (signal). Since
all measurements were done in the same room settings, it is fair to do a comparative measurement of different
microphones.
Mic 1kHz 5kHz Power(µW)
SATURN plasma 74 60 0
SATURN non-plasma 64.3 50 0
MEMS ADMP-401 67 62 375
Foil electret condenser 58 63 750
iPhone(INMP441) 82 86 2880+
Table 2. SNR(dB) at 1kHz, 5kHz and Power con-
sumed for different mic
Fig. 23. SNR Comparison with COTS Mic
Figure 23 shows the Signal-to-noise-ratio(SNR) plot wrt to frequency and the table 2 provides the summary
of SNR at 1 kHz and 5 kHz as well as power required by each microphone for operation. At 1000 Hz iPhone’s
microphone performed 20 dB better than the non plasma-treated PTFE SATURN microphone and approximately
10 dB better than the plasma-treated PTFE SATURN microphone. This was expected given the iPhone microphone
has both hardware and software amplifiers to improve the quality of signal. The SNR curve of the self-powered
SATURN microphone with plasma treatment is comparable to Sparkfun ADMP 401 and Foil electret condenser
with 1.5 V bias, up to 5000 kHz. The passive SATURN microphone is competitive with some active microphones
in terms of signal quality till 5000 Hz. In addition to being self-powered, SATURN microphone’s flexibility lends
it the ease of being embedded in different physical objects.
A MEMS microphone is another interesting comparison point. These are also small microphones that can be
embedded in objects. They offer low power consumption [29] of approximately 40 µW at -20 dB sensitivity. While
this may seem like a small power budget, it would not be appropriate for scenarios requiring a large number of
microphones or very long life. It would be better to use that power budget for other local computing tasks[13]
or communication[61]. MEMS is also a fairly complex micro-fabrication techniques compared to our SATURN
design.
8 POWER HARVESTING ANALYSIS
We performed an experiment to determine the peak voltage and peak power of the SATURN microphone as
functions of the external load resistance at its resonance frequency. The resonant frequency of the SATURN
microphone can vary slightly with each fabricated patch. Thus, we first perform a frequency sweep to determine
the system’s maximum Vopen−cir cuit of 0.9 Volts at 255 Hz with a 105 dB S P L sound source. The measurements
for the experiment were done using a capacitative oscilloscope (Kiethley 6514). Next, the external loads were
changed successively using a variable resistance box (Elenco electronics) and the corresponding Vpeak −peak was
Proc. ACM Interact. Mob. Wearable Ubiquitous Technol., Vol. 2, No. 2, Article 60. Publication date: June 2018.60:20 • N. Arora et al.
recorded. As shown in Figure 24a, the output Vpeak −peak increases quickly as the resistance increases from 0.1
Ω to 2 MΩ and approaches an asymptote at 8 MΩ resistance. When we wish to use the SATURN microphone
as a sensor, a load resistance of 8 MΩ would give the best result. Such high resistance,however, is not ideal for
general electronic circuits. We suggest using a load resistance of 2 MΩ when connecting the SATURN mic as an
audio sensor. Figure 24b shows the power vs load resistance curve, where power is calculated as Vpp 2 /R
load . A
maximum power of 6.9 micro Watt can be generated from the SATURN microphone at a load impedance of 0.9
MΩ when excited by a 255 Hz tone at 105 dB S P L .
(a) (b)
Fig. 24. Determination of load resistance : (a) peak voltage (b) peak power of 4x4 cm2 SATURN microphone as functions of
the external load resistance at resonance frequency
Going further, we analyzed the 4x4 cm 2 SATURN non-plasma microphone patch as a power harvestor. The
power curve and Vpp with a load of 0.9 MΩ at different frequencies is shown in Figure 25. The voltage is
approximately 0.5 Vpp at 150 Hz and rises to 2.5 Vpp and then comes back down again at 350 Hz. The same
behavior is shown in the power curve, with a maximum of 6499 nW.
Size of patch 4x4 cm 2
Type of patch Non-plasma
Resonant Frequency 255Hz
Load Impedance 0.9MΩ
Max. Vpp 2.5V
Max. Power 6944 nW
Table 3. Summary table of power
generated by SATURN at 105 dB S P L
Fig. 25. SATURN as power harvester : Voltage and power generated for different
working frequencies
9 EXPLORING THE APPLICATION SPACE
We explore different application scenarios where the SATURN microphone can be embedded in everyday
settings. The applications mentioned are exploratory in nature, and are shown to demonstrate that the quality
of the audio signal recovered by SATURN microphone in different configurations is good enough to support a
variety of interesting situations. The first two applications take advantage of SATURN as a passive microphone
with a thin and flexible form factor. However, the full application still requires signal acquisition and processing
Proc. ACM Interact. Mob. Wearable Ubiquitous Technol., Vol. 2, No. 2, Article 60. Publication date: June 2018.You can also read