Sensitivity Analysis of Sentinel-1 Backscatter to Oil Palm Plantations at Pluriannual Scale: A Case Study in Gabon, Africa
←
→
Page content transcription
If your browser does not render page correctly, please read the page content below
remote sensing
Article
Sensitivity Analysis of Sentinel-1 Backscatter to Oil Palm
Plantations at Pluriannual Scale: A Case Study in Gabon, Africa
J. David Ballester-Berman * and Maria Rastoll-Gimenez

                                          Institute for Computer Research (IUII), University of Alacant, E-03080 Alacant, Spain; mrg133@gcloud.ua.es
                                          * Correspondence: davidb@ua.es

                                          Abstract: The present paper focuses on a sensitivity analysis of Sentinel-1 backscattering signatures
                                          from oil palm canopies cultivated in Gabon, Africa. We employed one Sentinel-1 image per year
                                          during the 2015–2021 period creating two separated time series for both the wet and dry seasons.
                                          The first images were almost simultaneously acquired to the initial growth stage of oil palm plants.
                                          The VH and VV backscattering signatures were analysed in terms of their corresponding statistics
                                          for each date and compared to the ones corresponding to tropical forests. The times series for the
                                          wet season showed that, in a time interval of 2–3 years after oil palm plantation, the VV/VH ratio
                                          in oil palm parcels increases above the one for forests. Backscattering and VV/VH ratio time series
                                          for the dry season exhibit similar patterns as for the wet season but with a more stable behaviour.
                                          The separability of oil palm and forest classes was also quantitatively addressed by means of the
                                          Jeffries–Matusita distance, which seems to point to the C-band VV/VH ratio as a potential candidate
                                          for discrimination between oil palms and natural forests, although further analysis must still be

                                   carried out. In addition, issues related to the effect of the number of samples in this particular scenario
                                          were also analysed. Overall, the outcomes presented here can contribute to the understanding of the
Citation: Ballester-Berman, J.D.;
Rastoll-Gimenez, M. Sensitivity
                                          radar signatures from this scenario and to potentially improve the accuracy of mapping techniques
Analysis of Sentinel-1 Backscatter to     for this type of ecosystems by using remote sensing. Nevertheless, further research is still to be done
Oil Palm Plantations at Pluriannual       as no classification method was performed due to the lack of the required geocoded reference map.
Scale: A Case Study in Gabon, Africa.     In particular, a statistical assessment of the radar signatures should be carried out to statistically
Remote Sens. 2021, 13, 2075. https://     characterise the observed trends.
doi.org/10.3390/rs13112075
                                          Keywords: deforestation; oil palm; Sentinel-1; radar; backscattering; Gabon
Academic Editors: Francisco Javier
Mesas Carrascosa and Andrés Felipe
Ríos Mesa

                                          1. Introduction
Received: 13 April 2021
Accepted: 21 May 2021
                                               The permanent monitoring of rainforests has become an important topic in the radar
Published: 25 May 2021
                                          remote sensing field [1]. Anthropogenic activities such as the expansion of industrial oil
                                          palm plantations result in hardly quantifiable social and environmental impacts [2]. In
Publisher’s Note: MDPI stays neutral
                                          addition, some concerns have been raised regarding the contribution to CO2 emissions
with regard to jurisdictional claims in
                                          due to the fires to clear the natural cover for creating the plantation lands as well as the
published maps and institutional affil-   burning of waste products generated by the industrial activity [3]. The increasing demand
iations.                                  on these oil byproducts suggests that the global yield will dramatically rise during the
                                          next decades [1]. Therefore, the tracking of tropical deforestation through remote sensing
                                          technology can be an important factor in developing effective policies for strengthening
                                          the standards for communal lands protection and forest conservation.
Copyright: © 2021 by the authors.
                                               The use of optical sensors has been proven successful in the generation of regional
Licensee MDPI, Basel, Switzerland.
                                          scale classification maps since the spectral signatures at different wavelengths are sensitive
This article is an open access article
                                          to different cover classes. A remarkable example is the work in [4] where a 2015 land
distributed under the terms and           cover map was generated showing the industrial plantations distribution in Sumatra and
conditions of the Creative Commons        Kalimantan areas (Indonesia) and their changes since 1990. For a comprehensive review
Attribution (CC BY) license (https://     on this type of approaches, the reader is referred to [1].
creativecommons.org/licenses/by/               On the other hand, radar sensors are found to be of interest because they are almost
4.0/).                                    independent of weather and daylight conditions, thus solving in most cases (i.e., whenever

Remote Sens. 2021, 13, 2075. https://doi.org/10.3390/rs13112075                                       https://www.mdpi.com/journal/remotesensing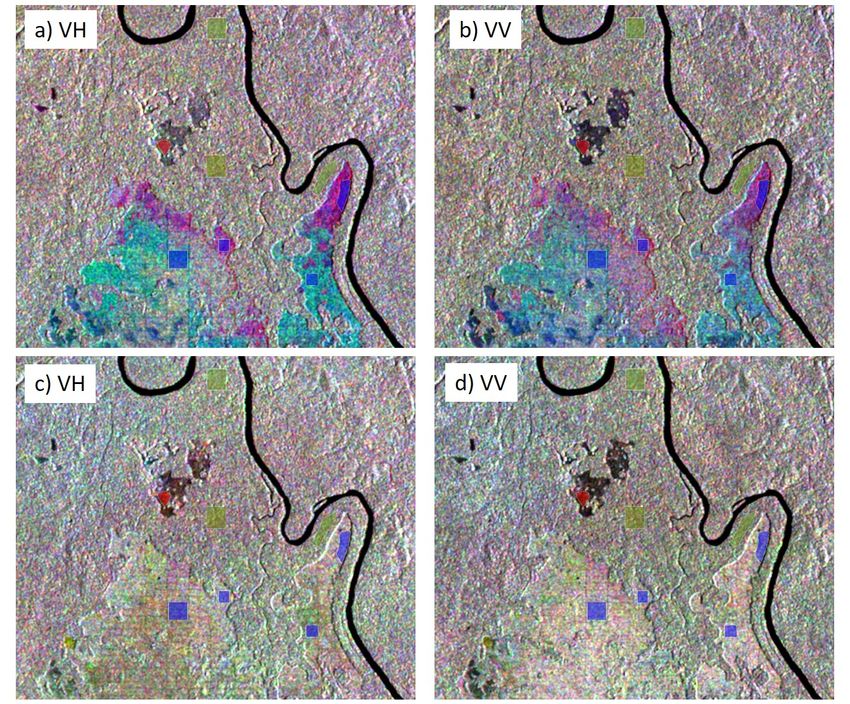
Remote Sens. 2021, 13, 2075                                                                                          2 of 22

                              the target area is not affected by an extreme event such as heavy rain storms) the cloud
                              cover issue inherent in optical systems. There exists in the literature a number of radar-
                              based works analysing microwave signatures from monoculture industrial plantations
                              affecting tropical forests [5–10]. These contributions addressed the sensitivity of either
                              L- or C-band, or both, at different depth levels. In addition, a microwave backscattering
                              model is proposed in [11], which has been thoroughly tested at different growth stages,
                              polarisations, frequencies and incident angles by making use of ground-truth data from
                              test sites in Malaysia and Indonesia. As shown by simulations in [11], the plant density can
                              affect noticeably the backscattering levels.
                                    In [5], a research line is set which suggests the potential of ALOS-1 PALSAR L-band
                              data for discriminating among rubber, wattles and palm trees (oil and coconut) by using
                              the 50 m resolution orthorectified mosaic products. In addition, in [6], an analysis on
                              time series of ALOS-1 PALSAR images showed these radar signatures can be linked to
                              deforestation processes. The methods proposed yield performances up to 72% detection
                              of deforestation for a false alarm rate (detection of deforestation in undisturbed forest) of
                              20%. The methodology employed in [6] relies on both the temporal standard deviation
                              of ScanSAR images and the variations of intensities of HH, HV and HH/HV. Later, the
                              authors of [7–9] further contributed to the understanding of radar signatures for this
                              scenario and the suitability of HH and HV polarisation channels at L-band. In particular,
                              in [8], not only L-band sensitivity was analysed but also C-band data from Envisat ASAR
                              sensor. The study in [8] focused on the discrimination among tropical forests, pulpwood
                              (on both peat and non-peat soils) and oil palm plantations. They provided a detailed
                              analysis on the interaction of radar signals within this scenario and demonstrated the
                              feasibility of using C-band radar data to track forest changes in a one-year time span, also
                              pointing out the need of using time-series for an improved classification and detection
                              performance. However, further work is required on backscattering sensitivity since some
                              disagreements appear with regard to the discrimination capability between oil palm and
                              forest of HH/VH ratio at L-band. Whereas the work in [8] found that the HH/VH ratio
                              discriminates well between those two land covers in Indonesia, a complete ambiguity was
                              found for the same ratio in a study site in Cameroon [9]. Nevertheless, the analysis in [9]
                              reported the L-band HH–VH difference as a good discriminator between oil palms and
                              natural forests and proposed a SVM classifier reaching classification accuracies of 92%.
                              Regarding C-band, in [10], Sentinel-1 VV and VH data were analysed for the same location
                              as in [8], showing a reasonable agreement in the histogram analysis even though some
                              quantitative differences were reported, especially in VH backscatter (i.e., about 0.6 dB).
                              Interestingly, the VV–VH was found in [10] to provide a good discrimination among oil
                              palm, rubber, pulp and natural forest. However, the mean VH power reported in [10] for
                              the oil palm area is −15.75 dB, which is too low and very similar to the backscattering
                              expected from a bare surface or a field with dominant direct scattering from soil, where low
                              and sparse vegetation is planted. This last explanation is compatible with our observations
                              and analysis performed in the present paper (as well as in agreement with the findings
                              in [12]). It must be pointed out that potential differences in density plantation, morphology
                              or growth stage explain the disagreements observed among different studies. Therefore,
                              electromagnetic modelling of backscattering signatures takes an important role to further
                              investigate these discrepancies [11]. Later on, in [13], we employed a fully polarimetric
                              acquisition from ALOS-1 PALSAR to preliminarily investigate the performance of the
                              Supervised Wishart classification to discriminate among three different classes, namely,
                              pulpwood, tropical forest and oil palm trees. Due to the lack of a ground-truth map, the
                              results were provided in terms of the confusion matrix, with classification rates from 89% to
                              95%, and the highest confusion of around 10% was found between forest and pulpwood. A
                              first comparison of these results based on fully polarimetric acquisitions with the outcomes
                              in [8] by using an L-band dual-polarisation system would suggest that an HH and VH
                              dual-polarisation SAR system would suffice for this application at this frequency.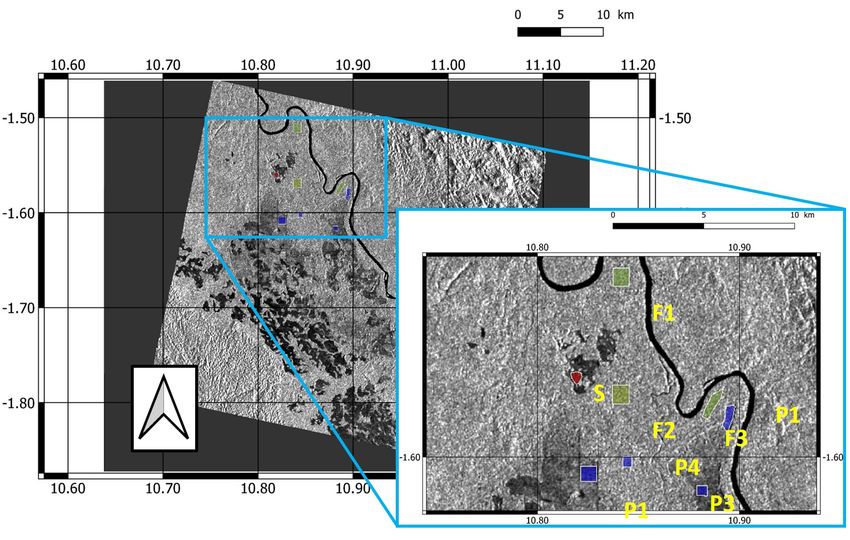
Remote Sens. 2021, 13, 2075                                                                                             3 of 22

                                    In addition, synergistic approaches based on both radar and optical remote sensors
                              have been the object of research in recent years. The combination of Landsat and ALOS-
                              PALSAR data has been employed in several works for the purpose of forest mapping
                              and monitoring. In [14], L-band data are used to complement an existing operational
                              Landsat-based approach to generate forest/non-forest probability maps, being the final
                              product a time series of joint radar-optical maps of forest extents. In [15], an approach
                              based on ALOS-1 PALSAR and Landsat products is implemented for oil palm detection
                              and an accuracy of 94% is obtained. More recently, a similar multisensor study based on
                              Sentinel-1 and Sentinel-2 data along a two-year period was carried out in [16]. A Random
                              Forest classification model was investigated and found to be able to discriminate oil palm
                              plantations by typology (i.e., industrial vs. smallholders plantations) and age (young vs.
                              mature plants, being the threshold a varying value within 3–8 years). They chose optimal
                              features, derived from optical and radar data, to obtain an overall accuracy of 90.2%. The
                              same study also showed that the mapping of mature oil palm trees (with no discrimination
                              between smallholder or industrial plantations) is feasible in an accurate way by only using
                              Sentinel-1 VH and VV backscattering and some derived statistical features. Beyond this
                              possibility, an almost simultaneous study [17] claims that only the use of Sentinel-1 VV and
                              VH channels allows discriminating between smallholder and industrial plantations (older
                              than 6 years) in peatlands, which contradicts the outcomes in [16]. Due to the interest with
                              regard the present study, it is worth noting that authors in [16] stated that the particular
                              canopy shape of oil palm trees produced is “characteristically high backscatter response in the
                              dual-band VH” and emphasised the relevance of HV band. This issue is strongly related
                              with the analysis we carry out in the present manuscript. Although we fully agree on
                              the general idea of the utility of Sentinel-1 data, a successful use of Sentinel-1 data would
                              require the combination of both VV and VH polarisation channels, as shown in [8] for a
                              one-year period time series. The combination of optical and radar sensors has been also
                              addressed more recently [12] where ALOS-2 PALSAR-2, Sentinel-1 and Landsat TM images
                              are employed. Several images covering 2016 were used and high classification accuracy
                              was obtained. Nevertheless, for the C-band Sentinel-1, only the VH channel was employed
                              and its use limited to bare surface detection.
                                    Despite the experience gained in last years regarding the performance of C-band data
                              for detection of oil palm plantations, it seems evident that further investigation must be
                              carried out to understand C-band backscattering signatures from this type of monoculture
                              plantations. Therefore, this work is aimed at contributing to the analysis of the sensitivity
                              of VH and VV Sentinel-1 channels to temporal dynamics of oil palm plantations. We
                              focus on the particular case of Gabon, where concessions for the oil palm industry started
                              to operate in 2012 with the clearance of the targeted areas. Nevertheless, according to
                              the environmental organisation Mighty Earth [18,19], the total palm oil yield from these
                              concessions was less than 1% in 2015. Actually, African natural ecosystems have suffered
                              thus far relative little damage in comparison to Southeast Asia where the broad expansion
                              of monoculture industrial activity has been concentrated up to recent years. This provides
                              a valuable opportunity to study Sentinel-1 signatures simultaneously to the starting of the
                              initial growth stage of oil palm plants and to compare these signatures to the ones from
                              tropical forest for this particular ecosystem.

                              2. Materials and Methods
                              2.1. Study Site and Dataset
                                  The study site is located close to Mouila, in the province of Ngounie, Gabon. Figure 1
                              shows the location of the site, indicating with a red rectangle the particular area under study.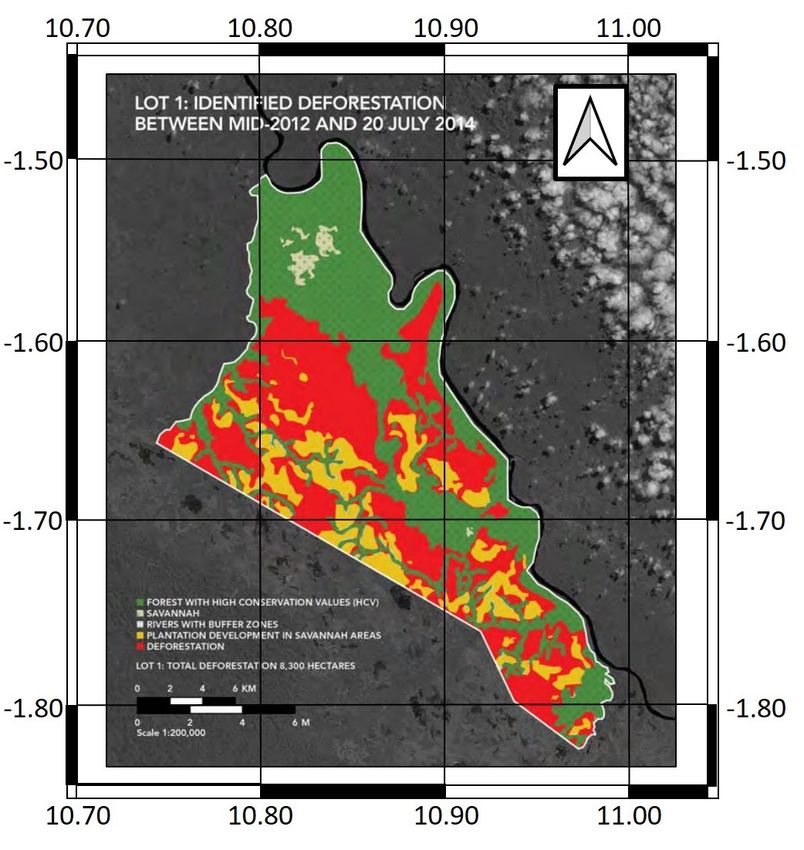
Remote Sens. 2021, 13, 2075                                                                                                    4 of 22

                              Figure 1. Geographical location of the test site in Gabon. A red rectangle indicates the particular area
                              chosen for the present study. The map was made using Natural Earth. Free vector and raster map
                              data can be found at naturalearthdata.com (accessed on March 2021).

                                   On average, there are at least ten rainy days in almost every month except for the
                              period from the end of June to the end of August where precipitation events happen
                              between one and three days per month [20]. Therefore, the wet season covers around
                              10 months. These almost permanent climatology conditions in Gabon must be considered
                              in the radar sensitivity analysis, since we decided to initiate this study on April 2015, when
                              the oil palms plantation had just taken place. For the time interval of the present study, the
                              average precipitation ranges between 7 and 9.5 mm/day from February (where the last
                              image was acquired in 2021) to April (the acquisition month of all previous images) for the
                              wet season, whereas for the driest conditions in July, the average precipitation decreases to
                              0.6 mm/day. Table 1 shows the monthly precipitation for the acquisitions from 2015 to 2019
                              for both the wet and dry seasons. These precipitation values and other climate datasets
                              were produced by the UK’s National Centre for Atmospheric Science (NCAS), Leeds, UK,
                              at the University of East Anglia’s Climatic Research Unit (CRU), Norwich, UK [21] and
                              provide global monthly data on a 0.5◦ × 0.5◦ grid from 1901 to 2019. At the moment of
                              the writing of this manuscript, no data for 2020 and 2021 were available. However, this
                              information can be complemented with the average precipitation in February and April,
                              ranging from 170 to 227 mm/month, and in July, which is 3 mm/month [22].

                              Table 1. Monthly precipitation (mm/month) in April and July for acquisitions from 2015 to 2019
                              (data for 2020 and 2021 not available) provided by CRU TS multivariate climate dataset [21].

                               Acquisition        mm/Month ( April—Wet Season)                mm/Month (July—Dry Season)
                                    2015                           178.2                                       3.8
                                    2016                           297.1                                       1.9
                                    2017                           239.6                                       2.3
                                    2018                           187.3                                       3.2
                                    2019                           228.0                                       3.1
Remote Sens. 2021, 13, 2075                                                                                               5 of 22

                                    We focus on one of the five oil palm concessions, all of them granted to the same
                              company operating in Gabon [23], being the beginning of deforestation activity in 2012. The
                              targeted concession approximately corresponds to the territory below the Ngounie River,
                              as illustrated in the reference map displayed in Figure 2 provided by Mighty Earth [19].

                              Figure 2. Reference map of the study site. Green, natural forest; Red, deforested area for oil palm
                              plantations; Orange, savannah areas substituted by oil palm plantations; Light Green, savannah.
                              Adapted (geographical coordinates included) and reproduced with the kind permission of Mighty
                              Earth [19].

                                   The reference map shows in red colour the deforested areas, whereas orange colour
                              indicates savannah zones substituted by oil palm plantations. This map was generated
                              in late July 2014. A different map of the same area elaborated by the company [23] in
                              May 2015 is in total agreement. Additionally, as mentioned above, the total palm oil yield
                              traded by the company from these concessions was less than 1% in 2015. This information
                              together with an initial pre-screening of the images allowed us to pinpoint the areas
                              either recently cleared or where the plantation had just been taken place (plantation in
                              the field is carried out 6–12 months after pre-germinated seeds are sown and raised in
                              polybags [24]). This is indeed an interesting feature for the purpose of the present study
                              as the backscattering sensitivity analysis was simultaneously carried out at the start of
                              the initial growth stage of oil palm plantations. Neither the documents in [18,19] nor the
                              publicly available information released by the company exploiting the concession [23]
                              reported any other types of land classes aside from tropical forest, oil palm and savannah
                              within the area under study. Figure 3 displays a zoomed view where the coloured polygons
                              correspond to the areas considered for the study sensitivity. They correspond to natural
                              forest, oil palm plantations and savannah, indicated in green, blue and red colours, as well
                              as labels F, P and S, respectively.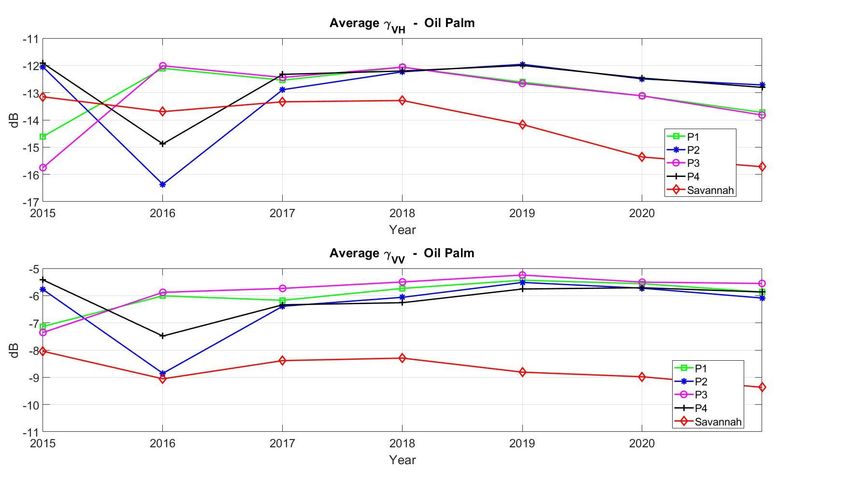
Remote Sens. 2021, 13, 2075                                                                                                    6 of 22

                              Figure 3. Zoomed view of the test site. A VV channel image acquired on 14 April 2015 and the
                              polygons chosen for the analysis are shown. Labels F1, F2 and F3 refer to tropical forest areas; P1, P2,
                              P3 and P4 to oil palm plantations; and S to savannah.

                                   The SAR products were downloaded from the Alaska Satellite Facility’s data portal
                              and correspond to the acquisitions shown in Tables 2 and 3. In total, 13 GRDH Sentinel-1A
                              images (IW mode) in descending pass and orbit 153 were employed with almost one year
                              time interval between each other for both the wet and dry seasons. It is noted, however,
                              that for the wet season the last image was acquired on 5 February 2021.

                              Table 2. SAR products downloaded from the Alaska Satellite Facility’s data portal (ASF DAAC). Wet
                              season acquisition dates are highlighted in bold font.

                               Sentinel-1 Acquisitions—Wet Season
                               S1A_IW_GRDH_1SDV_20150414T045839_20150414T045904_005475_006FE0_6FF2
                               S1A_IW_GRDH_1SDV_20160408T045846_20160408T045911_010725_01000B_187D
                               S1A_IW_GRDH_1SDV_20170403T045851_20170403T045916_015975_01A589_FED7
                               S1A_IW_GRDH_1SDV_20180410T045857_20180410T045922_021400_024D7F_0D61
                               S1A_IW_GRDH_1SDV_20190417T045904_20190417T045929_026825_0303D9_931E
                               S1A_IW_GRDH_1SDV_20200411T045910_20200411T045935_032075_03B4E6_0042
                               S1A_IW_GRDH_1SDV_20210205T045916_20210205T045941_036450_044767_FC82

                              Table 3. SAR products downloaded from the Alaska Satellite Facility’s data portal (ASF DAAC). Dry
                              season acquisition dates are highlighted in bold font.

                               Sentinel-1 Acquisitions—Dry Season
                               S1A_IW_GRDH_1SDV_20150719T045850_20150719T045921_006875_009479_5161
                               S1A_IW_GRDH_1SDV_20160713T045850_20160713T045915_012125_012C7A_0A6F
                               S1A_IW_GRDH_1SDV_20170720T045856_20170720T045921_017550_01D5A1_EA26
                               S1A_IW_GRDH_1SDV_20180715T045903_20180715T045928_022800_0278C3_2801
                               S1A_IW_GRDH_1SDV_20190722T045909_20190722T045934_028225_03303A_52A1
                               S1A_IW_GRDH_1SDV_20200716T045915_20200716T045940_033475_03E102_6650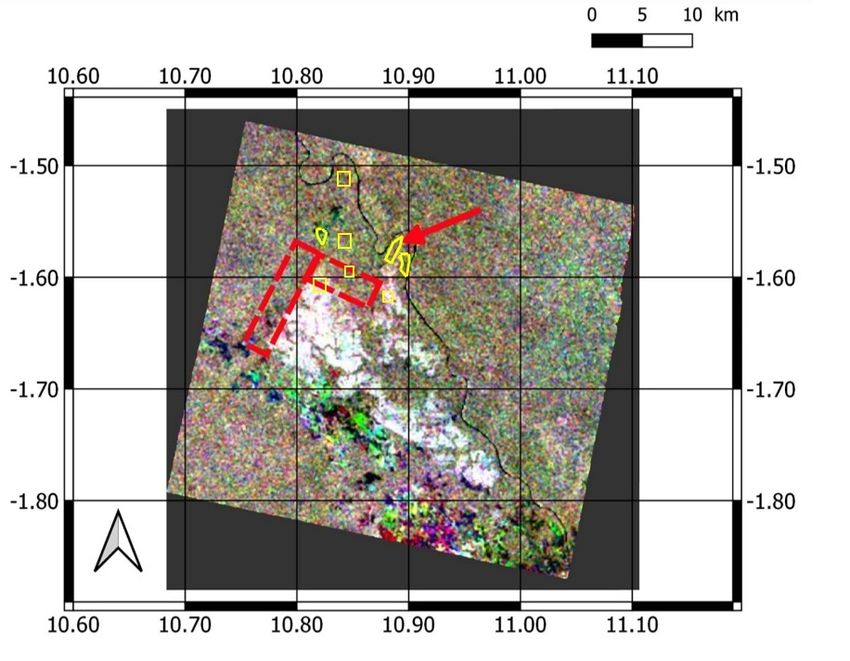
Remote Sens. 2021, 13, 2075                                                                                               7 of 22

                              2.2. Methodology
                                   The datasets were fully preprocessed by means of open-source Sentinel application
                              platform (SNAP) ESA software. The preprocessing stage involved the following steps for
                              both VH and VV channels (details on this standard methodology can be consulted in [25]):
                              1.   Subset the images. The latitude interval was set from 1.46◦ S to 1.87◦ S and the
                                   longitude interval from 10.75◦ E to 11.04◦ E. Hence, the covered area is around
                                   40 × 37 km (see Figure 3).
                              2.   Apply orbit information.
                              3.   Thermal noise removal.
                              4.   Calibration to get gamma values.
                              5.   Stack creation and coregistration of all images.
                              6.   Speckle filtering: A 9 × 9 boxcar filter was applied.
                              7.   Terrain correction was performed to geocode all images by removing as much as
                                   possible the geometric distortions (SRTM 1Sec HGT was selected as input DEM).
                                   Once the geocoded stack was obtained, the mean values, standard deviation and
                              coefficient of variation of both VH and VV channels were obtained for each selected area
                              (see Figure 3) and for every year making up a time series covering the whole 6-year period.
                              The temporal evolution of average VH and VV backscatter as well as the ratio VV/VH
                              was plotted and analysed in terms of the growth development of oil palm trees during the
                              early stages of the plantation and compared to the same signatures from tropical forest
                              and savannah.
                                   Some comments are in order with regard the methodology followed to compute
                              the backscattering values statistics. First, we assumed that the reference data provided
                              in [19,23] are accurate enough for the proper selection of corresponding classes. Second,
                              the reduction of uncertainties in backscattering levels (i.e., speckle, environmental factors
                              and geolocation errors) must be accounted for. To this aim, the averaging of a significant
                              number of samples was computed as a standard approach, as shown in a number of works
                              addressing vegetation monitoring [8]. By doing this, we assumed homogeneity within the
                              particular polygon [26]. As a result, unbiased statistics were obtained. However, it must
                              be noted that this also entailed a degradation of the final resolution, which could hinder
                              the generation of classification maps with sufficient accuracy. Nevertheless, we did not
                              consider this issue, which remains beyond the scope of this study and must be the object of
                              further analysis.
                                   Table 4 shows the number of pixels contained in every polygon (see caption in Figure 3
                              for the labels assigned to every class). On the one hand, these number are high enough to
                              reflect the statistical behaviour of every class. On the other hand, we ensured that pixels
                              belonging to the same class are within each particular area by means of a histogram analysis
                              and confirming that: (1) no bimodal histogram appeared (except in a particular case in oil
                              palm field—see discussion below); and (2) the standard deviation of each distribution was
                              limited to values similar to those reported in previous works [8].

                              Table 4. Number of pixels contained in each polygon considered for this study.

                                    Polygon Label                        Nr. Pixels                        Comment
                                           F1                               8811                                 -
                                           F2                               9384                                 -
                                           F3                               7175                                 -
                                           P1                               7560                         Initial growth
                                           P2                               5572                        Cleared in 2016
                                           P3                               3115                         Initial growth
                                           P4                               2850                        Cleared in 2016
                                           S                                2820                                 -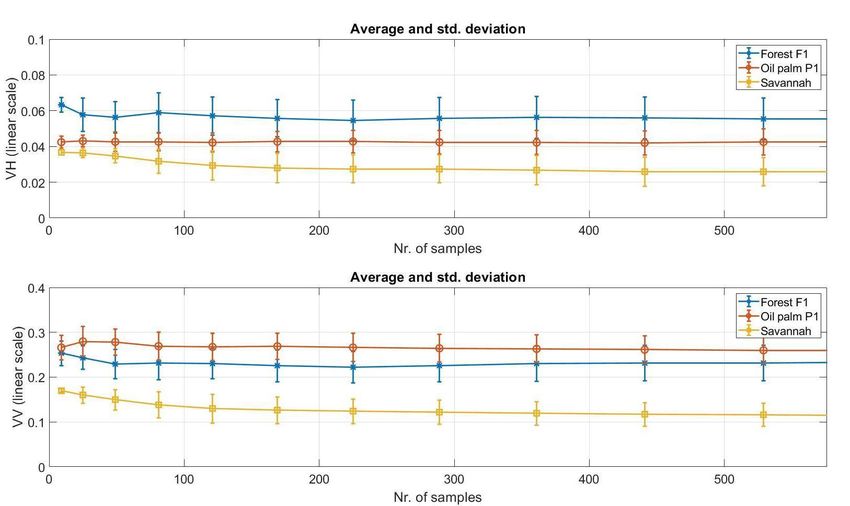
Remote Sens. 2021, 13, 2075                                                                                                  8 of 22

                                    It is noted that the present analysis was firstly focused on the wet season. Later, a com-
                              parison to the measurements during the dry season was also considered (see Section 3.3).
                              After a first pre-screening of radar images, we identified some oil palm areas where the
                              plantation was delayed with respect to other areas. This fact allowed selecting two different
                              pairs of areas with one-year delay in the plantation. Among all four oil palm areas (i.e.,
                              P1–P4), we selected those labelled as P1 and P3 since they exhibited radar signatures typical
                              of bare surfaces for the 2015 image. Whether they had been cleared around the acquisition
                              date or the palm trees had just been planted is unknown to us. Fortunately, this fact does
                              not prevent the sensitivity analysis as the radar signature corresponds to a dominant bare
                              surface. Likewise, polygons labelled as P2 and P4 correspond to parcels which were cleared
                              after the 2015 image but before the 2016 acquisition. This plantation delay manifested itself
                              in the radar signatures by means of a time shift between P1–P3 and P2–P4 parcels.
                                    The local incidence angle was also considered. To dismiss any potential effect of it in
                              the subsequent analysis, the mean and standard deviation were obtained for each polygon.
                              Table 5 shows the corresponding values. The average values remained very similar for all
                              parcels, while the standard deviation was sufficiently low.

                              Table 5. Mean and standard deviation of the local incidence angle (degree) for all pixels inside each
                              polygon considered for this study.

                                     Forest Polygons                     Oil Palm Polygons                     Savannah
                                   F1—38.37◦    ± 2.95◦                   P1—38.72◦    ± 2.5◦               S—39.17◦ ± 3.5◦
                                   F2—37.94◦    ± 2.88◦                   P2—38.33◦    ± 2.6◦
                                    F3—38.0◦ ± 2.78◦                      P3—37.43◦ ± 2.75◦
                                                                          P4—38.13◦ ± 2.60◦

                              2.3. Jeffries–Matusita (JM) Distance for Class Separability
                                   To illustrate the statistical performance of radar patterns, we computed the Jeffries–
                              Matusita (JM) distance [27] for the last image acquired in 2021 where the oil palm has
                              grown for six years. This is a measure of the dissimilarity of two distributions since it
                              considers both the distance between class mean values and the distribution around the
                              respective means.
                                   The JM distance between two distributions defined by their corresponding probability
                              density functions P( x/wi ) and P( x/w j ) representing classes wi and w j is expressed as [27,28]:

                                                                        Jij = 2 1 − e− Bij                                      (1)

                              where Bij is the Bhattacharyya distance between wi and w j defined as:
                                                                        Z q
                                                           Bij = − ln          P( x/wi ) P( x/w j )dx                           (2)

                              3. Results
                              3.1. Histogram Analysis
                                   Figure 4 shows the histograms for forest, oil palm and savannah polygons (labeled as
                              F1, P1 and S) for the first and the last images (i.e., 2015 and 2021, respectively). They are
                              employed here to illustrate the statistical behaviour of all classes. The rest of the histograms
                              are not shown here, since they do not provide additional information as they represent
                              similar distributions, being the average value of VH and VV backscattering the remarkable
                              difference to be accounted for.
                                   Histograms for both dates exhibit an almost Gaussian-like distribution for forests, as
                              expected. In the case of the oil palm area, the VH histogram in 2015 shows the maximum
                              between −16.02 and −15.23 dB, which perfectly agrees with a bare surface VH radar
                              signature. However, it is noted that there appears a local maximum around −13.98 dB,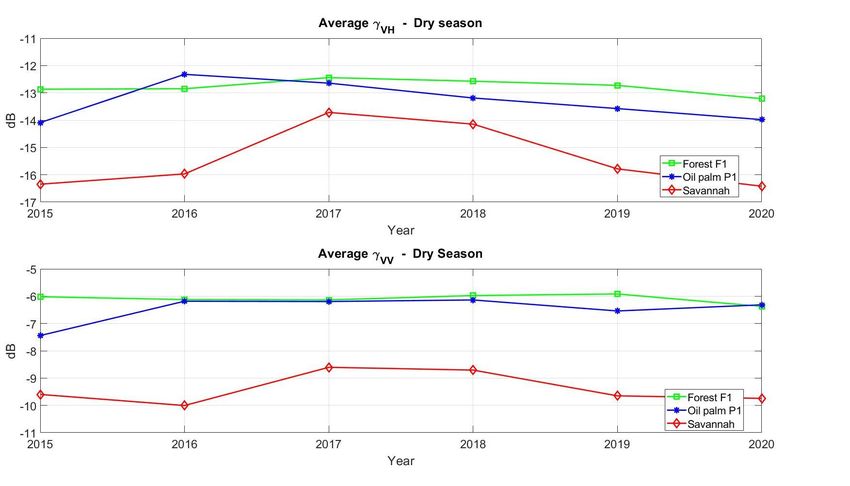
Remote Sens. 2021, 13, 2075                                                                                                         9 of 22

                                   which suggests that the palm plantation had already been carried out partially in this area.
                                   For 2015, where the oil palms had just started to develop, the discrimination among all
                                   three classes seems feasible. After six years of growth, the mean backscattering level in the
                                   crosspolar channel remains lower in palm fields than in forests but with overlapping of
                                   distributions due to a higher backscattered power from oil palms and the spread caused by
                                   residual speckle. On the contrary, the VV polarisation power in palm canopies does exceed
                                   the one from forests even though the noticeable overlap between histograms.

                                   Figure 4. Histograms of backscatter in 2015 and 2021 acquisitions during the wet season for forest
                                   (F1), oil palm plantation (P1) and savannah: (a) VH in 2015; (b) VV in 2015; (c) VH in 2021; and (d)
                                   VV in 2021. Corresponding statistics are given in Figure 5.

                                        The table shown in Figure 5 presents the mean value, the standard deviation and
                                   the coefficient of variation for all polygons in 2015 and 2021. The comparison of the
                                   backscattering values for oil palm in 2015 reveal higher mean values in VH and VV for
                                   parcels P2 and P4 than for parcels P1 and P3, which is a consequence of the delayed
                                   plantation among different parcels. As we show in the time series in Section 3.2, we can
                                   infer that parcels P2 and P4 were still vegetated (i.e., presumably a forest area according
                                   to the authors of [18,23]) and were later cleared according to the backscattering variation
                                   between 2015 and 2016.

      Figure 5. Statistics of all polygons for the initial and final images during the wet season (2015 and 2021, respectively). Mean
      values are expressed in dB in order to ease comparison with the reported values in the time series.
Remote Sens. 2021, 13, 2075                                                                                               10 of 22

                              3.2. Backscattering Time Series: A Six-Year Period
                                   The time series of the mean backscattering values for VH and VV channels and all
                              classes are plotted in Figures 6 and 7. Both forest and oil palm time series for all available
                              polygons are plotted together with the savannah time series. In the case of forests, both
                              VH and VV backscattering maintain reasonably constant levels along the whole period.
                              However, the first and last images (i.e., 2015 and 2021, respectively) show a slightly
                              noticeable variability, contributing to enlarge the dynamic range to 1–1.5 dB, being the
                              variations of environmental conditions a possible explanation. It is noted, however, that
                              these backscattering levels exhibit very similar values to those reported in a number of
                              previous works at C-band [8,12,29,30]. These values are also higher than from the low and
                              sparse vegetation characterising savannah areas, especially for VV channel.

                              Figure 6. Time series of (top) VH and (bottom) VV channels for tropical forests polygons during the
                              wet season. The time series of savannah are also provided.

                              Figure 7. Time series of (top) VH and (bottom) VV channels for oil palm polygons during the wet
                              season. The time series of savannah are also provided.

                                   In contrast, oil palm backscattering (Figure 7) displays a higher variability along
                              time. When comparison is made among areas for a particular channel, some qualitative
                              differences can be seen. In the case of the VH channel, there appears an almost complete
                              overlapping for time series of P1 and P3 areas, as well as for P2 and P4. Additionally, very
                              low values under −14.5 dB for P1 and P3 appear in the 2015 acquisition, which confirms the
                              dominant bare surface scenario on this date. Those low VH values appear one year later in
                              the P2 and P4 polygons for the 2016 acquisition, whereas the corresponding backscattering
                              in the 2015 image is −12 dB, a value which is roughly the same as the ones reported by
                              the VH channel for forests polygons. According to this time series, VH backscattering
Remote Sens. 2021, 13, 2075 11 of 22
follows an increasing trend, which rapidly saturates and starts to decrease in 2018 for
P1–P3 polygons and in 2019 for P2–P4. In other words, comparison between P1–P3 and
P2–P4 signatures reveals a one-year time delay between plantation in different areas. The
VV channel follows a similar increasing trend up to a certain saturation point, but, unlike
the VH channel, it shows two differences: (1) radar signatures are not so perfectly matched
between P1 and P3 or P2 and P4; and (2) the VV signatures follow similar trends, even
though the levels are lower for P2 and P4 areas.
An important consideration can be retrieved from an overall qualitative comparison
between backscattering values from forest and oil palm plants. On the one hand, the VH
channel remarkably varies along the 6-year period considered. On the other hand, the VV
appears more stable once the saturation point is reached, but, interestingly, it remains at
higher backscattering values than in forest areas. This behaviour of C-band VH and VV
data is in agreement with previous work [8] and contributes to highlight the potential of
this sensor configuration for discrimination of oil palm plantations and natural forest.
Similar conclusions can be inferred from a visual inspection of multitemporal RGB
compositions. For illustration purposes only, the area containing the studied polygons is
shown in Figure 8. Figures at the top represent the combination of acquisitions in 2015
(red), 2016 (green) and 2017 (blue), whereas the bottom row shows figures composed by
images in 2019 (red), 2020 (green) and 2021 (blue). By observing first the initial period
(i.e., Figure 8a,b), the most evident feature to highlight is the different development of
oil palm plantations represented in magenta and cyan colours. By means of a visual
comparison with the reference map in Figure 2, a fairly good agreement between both of
them is seen. The magenta areas represent palm fields that in the 2016 acquisition were
cleared parcels to be replanted, hence the dominant backscattering in 2015 (red) when there
was still vegetation (probably forest according to [19]) and 2017 (blue) where the soil was
already covered by low palms. On the other hand, the natural forests exhibit no dominant
backscattering from any date, according to the expected behaviour when no substantial
changes had been taken place in there. The same happens in the savannah area but with a
better contrast with respect the other classes clearly noticeable in both polarisations but
even more evident in VV channel.
Figure 8. Temporal RGB compositions during the wet season of the zoomed view in Figure 3: (a)
VH channel combining 2015 (R), 2016 (G) and 2017 (B); (b) VV channel combining years 2015 (R),
2016 (G) and 2017 (B); (c) VH channel combining 2019 (R), 2020 (G) and 2021 (B); and (d) VV channel
combining 2019 (R), 2020 (G) and 2021 (B). Red, light green and blue polygons indicate the areas
under study.Remote Sens. 2021, 13, 2075 12 of 22
The temporal RGB compositions for the last period, i.e., the maps in Figure 8c,d,
computed from images in 2019, 2020 and 2021, show an overall poorer contrast between
forests and oil palm plantations due to the growth of palm trees and, hence, a higher
similarity of radar signatures to the ones from forests, as previously shown in the time
series (Figures 6 and 7). However, discrimination between both classes still seems possible
as the oil palm areas appear delineated in both polarisations.
Time Series of VV/VH Ratio
The above analysis reveals a lower dynamic range for VV backscattering than VH
polarisation for this 6-year period at the same time that the VH channel exhibits a higher
decreasing rate from the third year onwards. Therefore, we also computed the VV/VH
power ratio to check how these different trends are combined into a single radar signature.
Figure 9 illustrates the corresponding time series for forests and oil palm. Values are given
in linear scale.
Figure 9. Time series of VV/VH ratio for tropical forest and oil palm plantations during the wet season.
The VV/VH ratio for forest areas keeps quite stable between values 4 and 5 despite
the small drop in 2018 due to a higher value of VH backscattering for that year affecting all
three forest polygons (see Figure 6). On the other hand, the different behaviour described
above regarding P1–P3 and P2–P4 oil palm polygons is clearly visible in Figure 9. These
signatures reveal that the VV/VH ratio exhibits an increasing trend which manifests in
P1–P3 polygons increasing from 4 to 6–7. In the case of the P2–P4, where the growth
of plantations is delayed one year, the ratio seems to follow the same increasing trend,
although with a lower rate. However, we cannot make any definite statement unless we
process in the future additional acquisitions.
3.3. Backscattering Signatures in the Dry Season
We replicated the same procedure as for the wet season to extract the backscattering
time series during the dry season for representative polygons F1, P1 and S. The resulting
signatures are compared to the ones acquired during the wet season. Figure 10 illustrates
the VH and VV backscattering signatures for all three polygons. Comparing these plots to
the corresponding ones in Figures 6 and 7, the general trends described for the wet season
appear again (i.e., increasing and decreasing trend in VH and a higher stability in VV), but
a more stable behaviour is exhibited for both forest and oil palms. In the case of forest,
the only date where a decrease in the dry season appears with respect the wet one is inRemote Sens. 2021, 13, 2075 13 of 22
2015 for both channels with roughly 1 dB, being this effect consistent with the absence of
rain events and the lower moisture of vegetation. In the case of the oil palm scenario, a
similar qualitative behaviour is exhibited for both VH and VV channels where slightly
lower power levels are retrieved for the dry season along the whole period except for the
2015 acquisition. In addition, the dynamic margin for the savannah area remains similar
when comparing both seasons (i.e., slightly lower than 3 dB in both cases), displaying
variations more similar for the VV channel than for the VH one.
Figure 10. Time series for F1, P1 and S polygons for the dry season of: (top) VH; and (bottom) VV.
The VV/VH ratio was also computed for this season, as shown in Figure 11. Nearly
the same signatures as for the wet season (Figure 9) were obtained. The ratio for forest area
again remains between values 4 and 5, whereas the ratio for oil palm follows an increasing
trend due to the plants development reaching a value of 5.84 for the last image acquired in
July 2020, which seems consistent with the pattern shown for the wet season ending later
in February 2021 (see Figure 9).
Figure 11. Time series of VV/VH ratio for tropical forest and oil palm plantations (F1 and P1
polygons) for the dry season.
The scatter plots of backscattering values for the wet and dry seasons were also
computed. Figures 12 and 13 show these plots for 2015 and 2020. The most relevantRemote Sens. 2021, 13, 2075 14 of 22
differences appear in the case of forest when comparing wet and dry seasons for 2015,
where a lower backscattering is detected in the dry season, in agreement with the previous
analysis on the time series. In the case of oil palms, the VH channel is the one exhibiting a
higher sensitivity to environmental changes between wet and dry seasons, as shown in
Figure 13a,c. It must be noted, however, that the use of VV/VH seems to reduce these
backscattering variations, as shown in Figures 9 and 11.
Figure 12. Scatter plots comparing wet and dry seasons in forest polygon F1: (a) VH 2015; (b) VV
2015; (c) VH 2020; and (d) VV 2020.
Figure 13. Scatter plots comparing wet and dry seasons in oil palm polygon P1: (a) VH 2015; (b) VV
2015; (c) VH 2020; and (d) VV 2020.Remote Sens. 2021, 13, 2075 15 of 22
4. Discussion
4.1. Backscattering Analysis
In this work, an in-depth analysis of backscattering sensitivity of Sentinel-1 VH and
VV channels to oil palm plantations is presented. Time series along a 6-year period were
analysed with a one-year interval between acquisitions. The particular test site chosen
is located in Gabon where several oil palm concessions have operated since 2012. A
distinctive feature of this study is the coincidence in time between the start of the plants
growth development and the Sentinel-1 acquisitions. Therefore, this study fills a gap in
the topic since to our knowledge no other study has addressed the temporal dynamics of
C-band VH and VV backscattering from oil palms at pluriannual scale, being this the first
step necessary for the integral characterisation of this type of plantations during the whole
lifetime, which is 25 years on average [24]. The three different classes, i.e., tropical forest,
savannah and oil palm plantations, present in the study area were analysed in terms of
their statistical parameters. Most of the work presented here is referred to SAR acquisitions
during the wet season, which covers a ten-month interval in Gabon. In addition, an
additional analysis was performed for some particular zones within the targeted area for
the dry season for comparison.
To get a first insight, we initially compared the histograms of the initial and last
images in 2015 and 2021, respectively. The histograms for the savannah area clearly
exhibit the highest variability for both dates, which is an expected behaviour provided the
characteristic low and sparse vegetation with some isolated trees of this type of ecosystem.
In quantitative terms, the coefficient of variation for the savannah varies between 18% and
37%, whereas, for both forests and oil palm, it varies from 11% to 26.6% (in the case of the
VH channel for an almost bare surface in 2015). In other words, as shown in Figure 5, the
standard deviation values for oil palm in all cases remain reasonable [8].
The forest statistics reveal a quite stable backscatter for all three polygons for both
dates, which is an expected behaviour. However, the comparison between mean backscatter
in 2015 and 2021 for all three classes shows a decrease of between 1 and 2 dB in 2021 with
respect to 2015. This effect occurs in both VH and VV. In the case of forest stands, a
feasible explanation points to environmental events such as rainfall, which can induce an
additional increase of 1–2 dB [31]. However, this is an unlikely explanation, as all SAR
images were acquired from February to April and, hence, are all potentially affected by
rainfalls (see Table 1). In addition, in the case of oil palm plantations, which are at their
first years of development, the rainfall effect is coupled with the changing backscatter due
to plant development. Therefore, this environmental factor generates an uncertainty in the
analysis that must be somehow accounted for. In the present analysis, we assumed that
the backscattering variation remains the same regardless of the polarisation channel. This
assumption was partly found in the correlation analysis for forest backscattering presented
in [30] between wet and dry seasons (see Figure 9 therein), and it is also consistent with
microwave theoretical modelling which considers that the vegetation volume inside each
resolution cell behaves as a set of randomly oriented particles [32]. However, it must be
noted that the limitation of our study relies on the availability of only one image per year,
which is not representative of the whole season.
The discrimination among all three classes is feasible at early stages of oil plants
development due to the dominant scattering from nearly a bare surface (i.e., containing
small plants after transplanting). After six years of plant growth, the mean backscattering
level in the crosspolar channel remains lower in palm fields than in forests, but there
appears an evident overlapping of distributions due to an increase of backscattering from
oil palm canopies. On the contrary, the VV polarisation power from palms exceeds the one
from forests despite the noticeable overlap between histograms. This histogram analysis is
in agreement with that reported in [8] for VH and VV and comparing oil palm and forest
backscattering obtained from Envisat ASAR sensor where a different ecosystem located in
Southeast Asia was studied, as well as those for forests [30].Remote Sens. 2021, 13, 2075 16 of 22
A more detailed analysis of temporal dynamics was addressed by considering the
six-year time series of the mean backscattering for both polarimetric channels. In the
case of forests, fairly constant levels along the whole period are observed, being the
exception the first and last images (i.e., 2015 and 2021, respectively), which show some
variation contributing to slightly enlarging the dynamic range. A possible explanation
for this behaviour is the different environmental conditions affecting the area, but no
definite conclusion can be drawn yet. The oil palm VH and VV time series exhibit patterns
which seem to be related to the oil plant development. The VH backscattering follows
an increasing trend for three years, and then it saturates and starts to decrease. On the
other hand, even though the VV channel follows a similar increasing trend up to a certain
saturation point, it clearly appears more stable once the saturation point is reached. More
interestingly, it remains at higher values than in forest areas, unlike the VH channel. As
shown by using electromagnetic simulations in [11], the backscattering coefficient at all
polarisations increases significantly with increasing age of the oil palms, up to an age of
about 10 years before saturating. In some cases, and depending on the plantation density
employed in those simulations, the VH and VV backscattering reported in our study agrees
with the simulations outcomes in [11].
Additionally, we also showed that the exhibited sensitivity can be visually exploited
by means of temporal RGB compositions which can provide qualitative maps useful to
approximately delineate the extent of the oil palm plantations (see Figures 8 and 14).
Nevertheless, it is pointed out that the utility of these maps is limited since no accuracy
assessment was performed, as we lack the required geocoded and detailed reference map.
4.2. On the VV/VH Ratio
The analysis on the polarimetric channels supports the use of the VV/VH ratio as a
potential discriminator between oil palms and natural forests. This signature exhibits an
increasing trend from the beginning of the fourth year onwards, reaching a value in the
interval between 6 and 7 (linear scale) at the end. This deviates from the VV/VH ratio for
forest, which is maintained in the 4–5 interval. This behaviour is evident in two out of the
four oil palm areas studied. The ratio for the other two areas shows the same pattern but
with an apparent delay (which can also be visible in the single channel backscattering time
series) since those parcels were cleared between the 2015 and 2016 acquisitions. However,
we need to process future additional acquisitions for a fair comparison between both sets
of areas and to make a definite statement.
The behaviour of the VV/VH ratio is further illustrated by means of a multitemporal
RGB image considering acquisitions in 2019, 2020 and 2021. Figure 14 shows the resulting
composition. It is noted that for its generation we took the input GRD images (i.e., pre-
processed by means of the same procedure but with no previous 9 × 9 boxcar filter) and
then applied a 25 × 25 filter over the native GRD data. Alternatively, one could take the
9 × 9 averaged data and then apply a second filter to obtain equivalent results. The most
significant features are the white areas interpreted as high VV/VH values within oil palm
plantations along the 3-year period. This is in reasonable agreement with the reference map
provided in Figure 2. However, it is noted that some parcels of palm fields are not well
discriminated from the forest areas as a consequence of the similar VV/VH values for those
dates, as pointed out by two red dashed rectangles and the red arrow on the map. This
behaviour also agrees well with our previous discussion on the VV/VH ratio time series
for the 2021 image, where the P2–P4 polygons exhibited a ratio similar to that of forests.Remote Sens. 2021, 13, 2075 17 of 22
Figure 14. Temporal RGB composition of VV/VH ratio combining 2019 (R), 2020 (G) and 2021 (B)
during the wet season. The yellow polygons indicate the areas under study.
It is worth noting that the VV/VH ratios for P1–P3 oil palm polygon as well as those for
forests reach very similar values to those reported in [8] (see histograms in Figure 6 therein).
In particular, the C-band VV/VH histogram for oil palm parcels reported in [8] exhibits a
bimodal distribution, being their maxima at about 4.5 and 6.5, respectively. The explanation
for this behaviour is perfectly compatible with the fact that the chosen area in [8] contains
sub-areas with oil palms at different growth stages, as occurs in our case when comparing
polygons P1–P3 and P2–P4 (see VV/VH values in 2021 in Figure 7). This result seems to
constitute additional evidence of the capability of C-band VH and VV polarisations for
discriminating between tropical forest and oil palm plantations.
4.3. Wet vs. Dry Seasons
Even though we focused our analysis in the acquisitions during the wet season,
which lasts ten months, the backscattering behaviour during the dry season was also
partly analysed. The VH and VV backscattering signatures show again the general trends
described for the wet season, i.e., increasing and decreasing trend in VH and a higher
stability in VV. However, backscattering from both forest and oil palms presents a more
stable behaviour. The corresponding VV/VH ratios display very similar signatures as
for the wet season, being 5.84 for the oil palm for the last image. This behaviour seems
to be consistent with the fact that it was acquired in July 2020 and the plants had further
developed by February 2021. Scatter plots comparing data acquired on the wet and dry
seasons were also computed, as in [30]. Our data reveal that the VH channel exhibits a
higher sensitivity to environmental changes, especially in the case of oil palms. However,
the use of VV/VH seems to cancel out these backscattering variations.
4.4. Effect of the Number of Samples
The effect of the number of samples imposes a trade-off between final resolution and
speckle reduction. The statistical behaviour of VH and VV backscattering was further
analysed by computing the variation of the mean and standard deviation values as aRemote Sens. 2021, 13, 2075 18 of 22
function of the number of samples considered for averaging for all three classes. Figure 15
illustrates the corresponding variations for VH and VV channels, respectively.
Figure 15. Variation of mean and standard deviation of (top) VH and (bottom) VV backscatter as a
function of the number of samples for polygons F1, P1 and S in the 2021 acquisition for the wet season.
Our results exhibit stability in both their mean and standard deviation values after a
few tens of samples, except for the savannah area where a higher variability is exhibited (as
discussed above) as a consequence of the heterogeneous scenario made up by grasslands
and isolated trees. On the contrary, the highest variation for forests and oil palm plantations
is limited to a 0.4–0.5 dB interval at most (for forest) up to the first 49 samples (i.e., a 7 × 7
window), which remains inside the standard deviation margins. In any case, even though
a 9 × 9 boxcar filtering produces maps with a reduced speckle but still preserving the
spatial resolution (as shown in Figure 8), the estimation of mean backscatter in this scenario
would require averaging a higher total number of samples, for example 25 × 25, to further
reduce speckle effect. To cite a previous example, authors in [8] first employed a temporal
filtering [33] followed by a 23 × 23 boxcar filter. The variation of these statistics deserves
further investigation for this application as it provides relevant information in terms of
the trade-off between speckle reduction and spatial resolution degradation which is of
importance for the generation of classification maps.
4.5. Separability between Oil Palm and Natural Forest
The VV–VH difference is another potential candidate for oil palm and forest dis-
crimination (and other plantation types), as suggested in [10]. We obtained the VV–VH
histograms for the F1 forest and P1 oil palm polygons in order to provide a first visual
comparison with the VV/VH ratio. Figure 16 shows the results for the 2015 and 2021 acqui-
sitions for the wet season. According to our previous analysis on the scattering signatures,
the oil palm polygon in 2015 contained not only zones with low, recently planted, plants
but also bare surface areas, as shown in Figure 4, where the maximum for the VH channel
is found at −15.6 dB. Therefore, VV/VH appears to correctly separate both classes, but this
is only a consequence of a dominant scattering from ground with some low vegetation
on the surface. As shown for 2021, both histograms get closer due to a decreasing trend
in VH backscattering initiated three years before for the oil palm P1 area (see Figure 7).
Regarding the VV–VH difference, a similar separability is found in 2015 at early growth
stages, whereas, for 2021, a higher overlap between histograms is clearly visible.Remote Sens. 2021, 13, 2075 19 of 22
Figure 16. Histograms of VV/VH ratio and VV–VH difference both expressed in dB for 2015 and
2021 acquisitions and F1 and P1 polygons during the wet season.
The class separability for both radar signatures is illustrated by means of JM distance
considering also the effect of the number of samples employed for averaging. Figure 17
illustrates the results obtained. Again, it is noted that a previous 9 × 9 boxcar filter was
applied. Therefore, the number of samples shown along the x-axis in Figure 17 refers to the
samples to be averaged after the previous 9 × 9 boxcar filtering.
Figure 17. Jeffries–Matusita distance between forest and oil palm classes for the VV/VH ratio and
VV–VH difference both expressed in dB for the acquisition in 2021 and F1 and P1 polygons during
the wet season.Remote Sens. 2021, 13, 2075 20 of 22
The VV/VH ratio exhibits a higher separability than the VV–VH difference for the
F1 and P1 polygons considered here. Up to 100 samples, the JM values for VV/VH are
above 1.6, whereas, for the VV–VH, the difference remains below 1.4. A very low number
of samples (i.e., nine, which refers to a 3 × 3 window size) must be avoided, even though
the JM distance is 2 for the VV/VH ratio, because it would yield a noticeable variability in
the backscattering mean value, as discussed above on the basis of Figure 15. In addition,
it is noted that increasing the averaging window size leads to lower JM distances, i.e., a
more difficult separability, as a consequence of mixing non-homogeneous areas which may
induce backscatter variations within the same polygon due to unconsidered locally varying
environmental conditions such as soil type or topography [31].
5. Conclusions
Outcomes from this study are potentially relevant since they contribute to the under-
standing of the temporal dynamics of radar signatures from oil palm canopies. From the
final application point of view, the present analysis can help for checking whether new
industrial plantations have emerged from the deforestation of either high conservation
value (HCV) or even secondary and regenerating forests. However, a statistical assessment
of the radar signatures should be carried out to statistically characterise the observed
trends. If confirmed, the issues discussed here can be considered by large-scale mapping
techniques [15–17] to investigate whether they could contribute for improvement of the
classification map accuracy. In addition, these observations should be further comple-
mented and/or revised with a deeper knowledge of the radar scattering processes in oil
palms in terms of direct, double-bounce and volume scattering components. This is another
line worth exploring which could be tackled by using coherent electromagnetic models
such as the one proposed in [11], which was employed to assess the influence of different
scattering mechanisms at L-band. Considering the current availability of dense time series
of radar images from Sentinel satellites, a logical and necessary step would be to extend
this electromagnetic analysis to C-band.
Author Contributions: Conceptualisation, J.D.B.-B.; methodology, J.D.B.-B.; software, J.D.B.-B. and
M.R.-G.; validation, J.D.B.-B.; formal analysis, J.D.B.-B.; investigation, J.D.B.-B. and M.R.-G.; resources,
J.D.B.-B. and M.R.-G.; data curation, J.D.B.-B.; writing—original draft preparation, J.D.B.-B.; writing—
review and editing, J.D.B.-B. and M.R.-G.; visualisation, J.D.B.-B. and M.R.-G.; supervision, J.D.B.-B.;
project administration, J.D.B.-B.; and funding acquisition, J.D.B.-B. All authors have read and agreed
to the published version of the manuscript.
Funding: This research was in part funded by the Spanish Ministry of Science, Innovation and
Universities, State Research Agency (AEI) and the European Regional Development Fund under
project TEC2017-85244-C2-1-P, and by the University of Alacant under Programa Propi per al Foment de
la R+D+I (Grants VIGROB20-114 and UADIF20-74).
Institutional Review Board Statement: Not applicable.
Informed Consent Statement: Not applicable.
Data Availability Statement: For SAR datasets shown in Section Study Site and Dataset: Geographical
coordinates for all polygons employed for the selected classes are available under request. Please,
contact J. David Ballester-Berman.
Acknowledgments: The authors would like to thank Mighty Earth organisation for kindly giving
permission to reproduce the reference map from [19]. The authors also acknowledge the European
Space Agency for making available the open-source Sentinel application platform (SNAP) software
and for processing and distributing the Sentinel-1 data which were retrieved from the Alaska Satellite
Facility’s data portal (ASF DAAC). The anonymous reviewers are sincerely acknowledged for their
critical review and valuable comments which contributed to improve the quality of the manuscript.
Conflicts of Interest: The authors declare no conflict of interest.Remote Sens. 2021, 13, 2075 21 of 22
References
1. Chong, K.L.; Kanniah, K.D.; Pohl, C.; Tan, K.P. A review of remote sensing applications for oil palm studies. Geo-Spat. Inf. Sci.
2017, 20, 184–200. [CrossRef]
2. World Rainforest Movement. Available online: http://wrm.org.uy/ (accessed on 20 December 2020).
3. Pohl, C. Mapping palm oil expansion using SAR to study the impact on the CO2 cycle. In Proceedings of the 7th IGRSM
International Remote Sensing and GIS Conference and Exhibition, IOP Conf. Series: Earth and Environmental Science, Kuala
Lumpur, Malaysia, 21–22 April 2014.
4. Miettinen, J.; Shi, C.; Liew, S.C. Land cover distribution in the peatlands of Peninsular Malaysia, Sumatra and Borneo in 2015
with changes since 1990. Glob. Ecol. Conserv. 2016, 6, 67–78. [CrossRef]
5. Miettinen, J.; Liew, S.C. Separability of insular Southeast Asian woody plantation species in the 50 m resolution ALOS PALSAR
mosaic product. Remote Sens. Lett. 2011, 2, 299–307. [CrossRef]
6. Whittle, M.; Quegan, S.; Uryu, Y.; Stäewe, M.; Yulianto, K. Detection of tropical deforestation using ALOS-PALSAR: A Sumatran
case study. Remote Sens. Environ. 2012, 124, 83–98. [CrossRef]
7. Zeng, T.; Dong, X.; Quegan, S.; Hu, C.; Uryu, Y. Regional tropical deforestation detection using ALOS PALSAR 50 m mosaics in
Riau province, Indonesia. Electron. Lett. 2014, 50, 547–549. [CrossRef]
8. Dong, X.; Quegan, S.; Yumiko, U.; Hu, C.; Zeng, T. Feasibility Study of C- and L-band SAR Time Series Data in Tracking
Indonesian Plantation and Natural Forest Cover Changes. IEEE J. Sel. Top. Appl. Earth Obs. Remote Sens. 2015, 8, 3692–3699.
[CrossRef]
9. Li, L.; Dong, J.; Tenku, S.N.; Xiao, X. Mapping Oil Palm Plantations in Cameroon Using PALSAR 50-m Orthorectified Mosaic
Images. Remote Sens. 2015, 7, 1206–1224. [CrossRef]
10. Miettinen, J.; Liew, S.C.; Kwoh, L.K. Usability of Sentinel-1 Dual Polarization C-Band Data for Plantation Detection in Insular
Southeast Asia. In Proceedings of the 36th Asian Conference on Remote Sensing: Fostering Resilient Growth in Asia, Quezon
City, Metro Manila, Philippines, 19–23 October 2015.
11. Teng, K.C.; Koay, J.Y.; Tey, S.H.; Lim, K.S.; Ewe, H.T.; Chuah, H.T. A Dense Medium Microwave Backscattering Model for the
Remote Sensing of Oil Palm. IEEE Trans. Geosci. Remote Sens. 2015, 53, 3250–3259. [CrossRef]
12. Mohd Najib, N.E.; Kanniah, K.D.; Cracknell, A.P.; Yu, L. Synergy of Active and Passive Remote Sensing Data for Effective
Mapping of Oil Palm Plantation in Malaysia. Forests 2020, 11, 858. [CrossRef]
13. Ballester-Berman, J.D. Preliminary Analysis on ALOS1-PALSAR Full-Pol Data Capabilities For Discrimination between Natural Forests
and Industrial Plantations; Technical Report; University of Alacant: Alacant, Spain, 2017.
14. Lehmann, E.A.; Caccetta, P.A.; Zhou, Z.; McNeill, S.J.; Wu, X.; Mitchell, A.L. Joint Processing of Landsat and ALOS-PALSAR Data
for Forest Mapping and Monitoring. IEEE Trans. Geosci. Remote Sens. 2012, 50, 55–67. [CrossRef]
15. Cheng, Y.; Yu, L.; Cracknell, A.P.; Gong, P. Oil Palm Mapping Using Landsat and PALSAR: A Case Study in Malaysia. Int. J.
Remote Sens. 2016, 37, 5431–5442. [CrossRef]
16. Descals, A.; Szantoi, Z.; Meijaard, E.; Sutikno, H.; Rindanata, G.; Wich, S.A. Oil Palm (Elaeis guineensis) Mapping with Details:
Smallholder versus Industrial Plantations and their Extent in Riau, Sumatra. Remote Sens. 2019, 11, 2590. [CrossRef]
17. Oon, A.; Ngo, K.D.; Azhar, R.; Ashton-Butt, A.; Lechner, A.M.; Azhar, B. Assessment of ALOS-2 PALSAR-2L-band and Sentinel-1
C-band SAR backscatter for discriminating between large-scale oil palm plantations and smallholdings on tropical peatlands.
Remote Sens. Appl. Soc. Environ. 2019, 13, 183–190. [CrossRef]
18. Higonnet, E.; Hurowitz, G.; Bellantonio, M.; Lapidus, D. Palm Oil’s Black Box; Mighty Earth: Washington, DC, USA, 2016. Available
online: http://www.mightyearth.org/wp-content/uploads/2016/12/Palm-Oil-Black-Box-PrintApproval4.pdf (accessed on 20
December 2020).
19. Higonnet, E.; Hurowitz, G.; Bellantonio, M.; Lapidus, D. Palm Oil’s Black Box (Extended Version); Mighty Earth: Washington, DC,
USA, 2016. Available online: http://www.mightyearth.org/wp-content/uploads/2016/07/Olam-technical-report_Dec-9_with-
images_lowres1-002.pdf (accessed on 20 December 2020).
20. Climate of Ngounie (Gabon). Available online: https://www.worlddata.info/africa/gabon/climate-ngounie.php (accessed on
21 December 2020).
21. Harris, I.; Osborn, T.J.; Jones, P.; Lister, D.H. Version 4 of the CRU TS monthly high-resolution gridded multivariate climate
dataset. Sci. Data 2020, 7, 1–18. [CrossRef] [PubMed]
22. Average Weather in Mouila. Available online: https://weatherspark.com/y/68760/Average-Weather-in-Mouila-Gabon-Year-
Round (accessed on 21 December 2020).
23. Stewart, C.; Olam International. Plantations Agroindustrielles au Gabon: Vers un Triple Impact Positif ; The Forest Dialogue: Mouila,
Gabon, 2017.
24. Woittiez, L.S.; van Wijk, M.T.; Slingerland, M.; van Noordwijk, M.; Giller, K.E. Yield gaps in oil palm: A quantitative review of
contributing factors. Eur. J. Agron. 2017, 83, 57–77. [CrossRef]
25. Filipponi, F. Sentinel-1 GRD Preprocessing Workflow. Proceedings 2019, 18, 6201. [CrossRef]
26. Lee, J.-S.; Pottier, E. Polarimetric Radar Imaging: From Basics to Applications; CRC/Taylor and Francis: London, UK, 2009.
27. Dabboor, M.; Howell, S.; Shokr, M.; Yackel, J. The Jeffries-Matusita distance for the case of complex Wishart distribution as a
separability criterion for fully polarimetric SAR data. Int. J. Remote Sens. 2014, 35, 6859–6873.You can also read