Ghost nets in the Gulf of Carpentaria, Australia, 2004- 2020
←
→
Page content transcription
If your browser does not render page correctly, please read the page content below
Australia’s National
                                                                                             Science Agency

Ghost nets in the Gulf of
Carpentaria, Australia, 2004-
2020
Quantifying abandoned, lost and derelict fishing gear (ALDFG)
across northern Australia
Britta Denise Hardesty, Lauren Roman and Chris Wilcox
31 March 2021

                                                        Ghost nets in the Gulf of Carpentaria, Australia, 2004-2020 | 1
Citation
Hardesty BD, Roman L and Wilcox C (2021). Ghost nets in the Gulf of Carpentaria, Australia, 2004-
2020. CSIRO, Australia.

Copyright
© Commonwealth Scientific and Industrial Research Organisation 2021. To the extent permitted
by law, all rights are reserved, and no part of this publication covered by copyright may be
reproduced or copied in any form or by any means except with the written permission of CSIRO.

Important disclaimer
CSIRO advises that the information contained in this publication comprises general statements
based on scientific research. The reader is advised and needs to be aware that such information
may be incomplete or unable to be used in any specific situation. No reliance or actions must
therefore be made on that information without seeking prior expert professional, scientific and
technical advice. To the extent permitted by law, CSIRO (including its employees and consultants)
excludes all liability to any person for any consequences, including but not limited to all losses,
damages, costs, expenses and any other compensation, arising directly or indirectly from using this
publication (in part or in whole) and any information or material contained in it.
CSIRO is committed to providing web accessible content wherever possible. If you are having
difficulties with accessing this document please contact csiroenquiries@csiro.au.

                                                         Ghost nets in the Gulf of Carpentaria, Australia, 2004-2020 | i
Contents

Contents               ............................................................................................................................. 2
Acknowledgments......................................................................................................................... 5
Executive summary ....................................................................................................................... 6

Part I Surveying ghost gear in the Gulf of Carpentaria, Northern Australia, 2004 - 2020.                                                                  7

Ghost gear in Northern Australia .................................................................................................. 8
1          Ghost gear surveys ............................................................................................................ 9
           1.1         Description of surveys .......................................................................................... 9
           1.2         2004 aerial survey (seagrass survey) .................................................................. 10
           1.3         2017 aerial survey (ghost gear and mangrove) .................................................. 12
           1.4         2019 helicopter survey (ghost gear and mangroves) ......................................... 13
           1.5         2020 helicopter survey (ghost gear and mangroves) ......................................... 15

Part II An analysis to identify ghost gear hotspots and changes through time in the Gulf of
Carpentaria, Northern Australia.                                                                                                                         17

2          Methodological approach ............................................................................................... 18
           2.1         Locations ............................................................................................................ 18
           2.2         Analysis approach .............................................................................................. 18
3          Findings and their interpretations .................................................................................. 29
           3.1         Ghost net hotspots ............................................................................................ 29
           3.2         Ghost gear changes through time ...................................................................... 30
           Considerations and caveats ............................................................................................ 34
4          Opportunities and Suggestions ....................................................................................... 36
           4.1         Improving ghost gear management ................................................................... 36
           4.2         Suggestions for reducing gear losses at sea ....................................................... 37
           4.3         Suggestions for interdicting ghost nets .............................................................. 38
References             ........................................................................................................................... 40
Appendix A. Notes from 2020 aerial survey ................................................................................ 42

2 | CSIRO Australia’s National Science Agency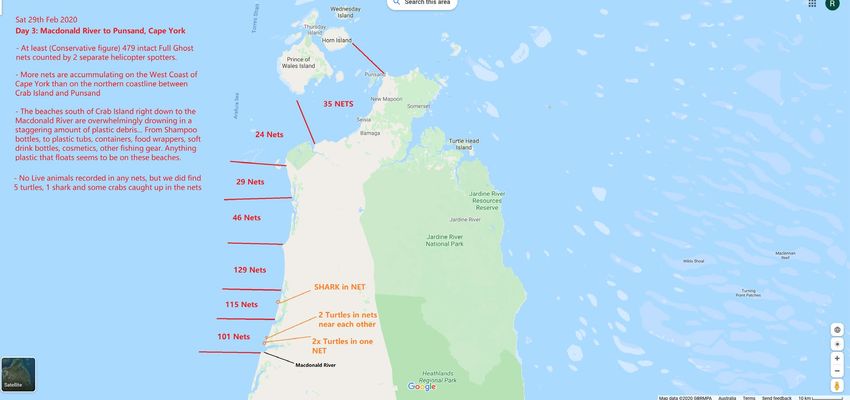
Figures
Figure 1. Map of study area from 2004 initial (seagrass-focused) helicopter survey. ................. 11
Figure 2. Locations of ghost nets observed in the 2004 aerial surveys. ...................................... 12
Figure 3. Location of ghost nets in the 2017 surveys. ................................................................. 13
Figure 4. Location of ghost nets in the 2019 surveys. ................................................................. 14
Figure 5. First provided map showing Day 1 survey (28 February 2020) from Weipa to
MacDonald River, Queensland, Australia on Friday 28 February 2020. ...................................... 15
Figure 6. Map provided showing survey from MacDonald River to Peak Point, Punsand Bay,
Cape York on Saturday 29 February 2020.. ................................................................................. 16
Figure 7. Map provided showing Day 3 survey (1 March 2020) from Weipa to Aurukun. ........... 16
Figure 8. Predicted net locations from 2020 surveys.. ................................................................ 19
Figure 9. 1⁰ grid cell applied over the gulf of Carpentaria. .......................................................... 20
Figure 10. Raw number of nets counted per grid cell. ................................................................ 22
Figure 11. Nets standardised per kilometre of coastline observed within each survey year. ..... 23
Figure 12. Nets standardised per kilometre of coastline observed between survey years. ........ 24
Figure 13. Effort-standardised number of nets predicted to occur per 10 grid cell. .................... 27
Figure 14. The number of nets predicted to occur per kilometre in each grid cell for 2004, 2017,
2019 and 2020. ........................................................................................................................... 28
Figure 15. Changes in net numbers through time in each grid cell across Queensland. ............. 33
Figure 16. Changes in net numbers through time in each grid cell in Northern Territory. .......... 34

Tables
Table 1. Summary of information for the four aerial surveys conducted in northern Australia
2004 – 2020, inclusive. ................................................................................................................ 10
Table 2. Start and end points of survey legs conducted in Queensland in 2020. ........................ 19
Table 3. The length of the coastline and major geographic features (towns, points and river
mouths) in each of the 20 surveyed 1⁰ grid cells.. ...................................................................... 21
Table 4. Survey effort (kilometres of coastline surveyed per day of aerial surveys) during 2004,
2017, 2019 and 2020 helicopter surveys..................................................................................... 25
Table 5. Comparison of general additive models (GAMs) that examine the relationship between
number of counted nets and survey effort parameters for each 1⁰ grid cell. ............................. 26
Table 6. Predicted ghost nets per kilometre of coastline in surveyed regions of the Gulf of
Carpentaria, standardised for aerial survey effort. ..................................................................... 30

                                                                                    Ghost nets in the Gulf of Carpentaria, Australia, 2004-2020 | 3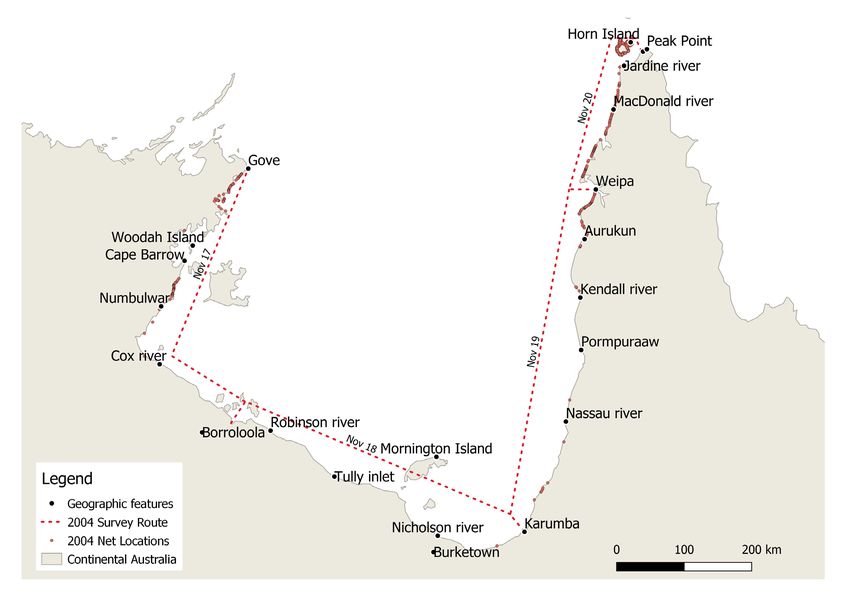
Table 7. Changes through time of standardised and predicted ghost nets per grid cell in the Gulf
of Carpentaria. ............................................................................................................................ 31

4 | CSIRO Australia’s National Science Agency
Acknowledgments

We acknowledge the traditional owners and custodians on the lands on which we live and work,
and pay our respects to their elders, past present and emerging. We thank the Department of
Agriculture, Environment and Water, CSIRO Oceans and Atmosphere, James Cook University
(particularly Norman Duke and Jock Mackenzie), World Animal Protection, and Rupert Imhoff and
Nicole McLachlan; all of whom contributed resources, expertise, and/or time to conduct surveys
and share information used herein. Part of this work was made possible by a 3-year grant to Norm
Duke at James Cook University’s Centre for Tropical Water and Aquatic Ecosystem Research. The
grant was funded by the Australian Government’s National Environmental Science Program
through its Tropical Water Quality Hub and Northern Australia Environmental Resources Hub.

                                                        Ghost nets in the Gulf of Carpentaria, Australia, 2004-2020 | 5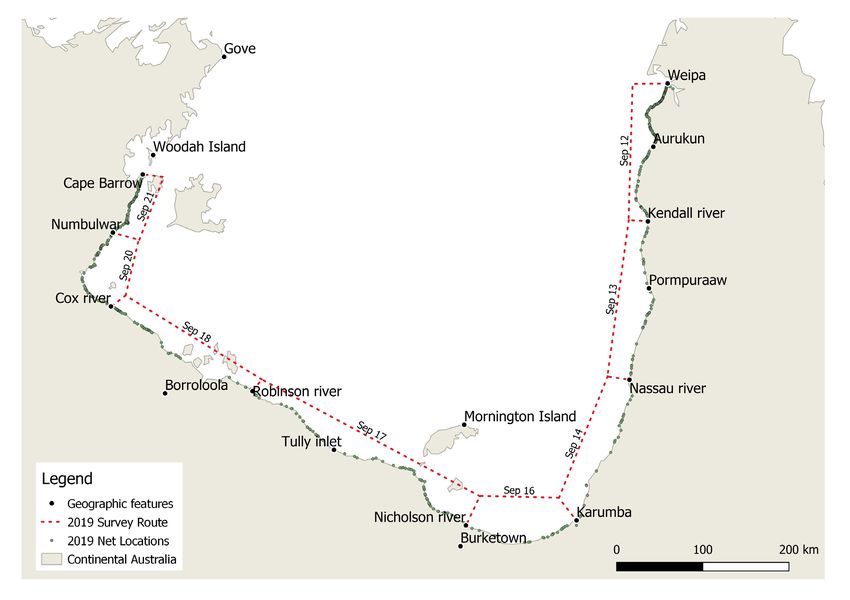
Executive summary
Home to numerous Indigenous communities, Australia’s northernmost regions are considered
some of the most remote environments in the world (Halpern et al., 2008). Until recent decades,
most of what washed ashore in these remote communities was comprised of natural materials.
However, there have been growing concerns about the increasing quantities of plastic waste,
including lost fishing gear washing ashore in northern Australia.
The Gulf of Carpentaria (GoC) survey area represents 3350 km, or approximately ten percent of
the Australian coastline. The Gulf is home to numerous threatened and endangered species,
however, many of which occur in the shallow waters there. The movement through the GoC of
abandoned, lost and derelict fishing gear (ALDFG) or ‘ghost nets’ exacts a substantial toll on
coastal and marine wildlife, ensnaring marine turtles, as well as dugong, crocodiles, sawfish,
hammerhead sharks, sea snakes, and thousands of invertebrates.
The purpose of this project was to bring together information from multiple aerial surveys that
have taken place across the Gulf of Carpentaria since 2004. The goal was to compare ghost nets
observed from multiple aerial helicopter surveys that have taken place across the region in the last
two decades. We used the information from these surveys to understand whether coastal,
stranded nets appeared to be increasing, decreasing or remaining consistent in numbers and
location, based on aerial survey data. In this report we include:
(i) A summary description of where surveys took place between 2004 and 2020;
(ii) An analysis of existing data in which we highlighted hotspots of derelict fishing nets;
(iii) A discussion of whether net numbers, density and distribution appeared consistent
between years;
(iv) A discussion of potential options for reducing gear lost at sea;
(v) Identification of opportunities for net interdictions where feasible, considering cost, safety,
and other relevant considerations.
Highlights
Hotspots for net accumulation in the Gulf of Carpentaria occur along the Cape York
Peninsula and within the territory gulfs that occur south of the Gove Peninsula;
Despite management efforts, the numbers of ghost nets along shorelines in the Gulf of
Carpentaria appear to have increased across the region;
Ghost nets recorded by aerial surveys are an underestimate of the true number of nets
present along the coastlines, because aerial surveys are less likely to detect smaller
fragments of net, nets buried under sand or those that may be obscured by vegetation;
Information about on-ground, local clean-up efforts would be useful to contextualise this
information.
6 | CSIRO Australia’s National Science Agency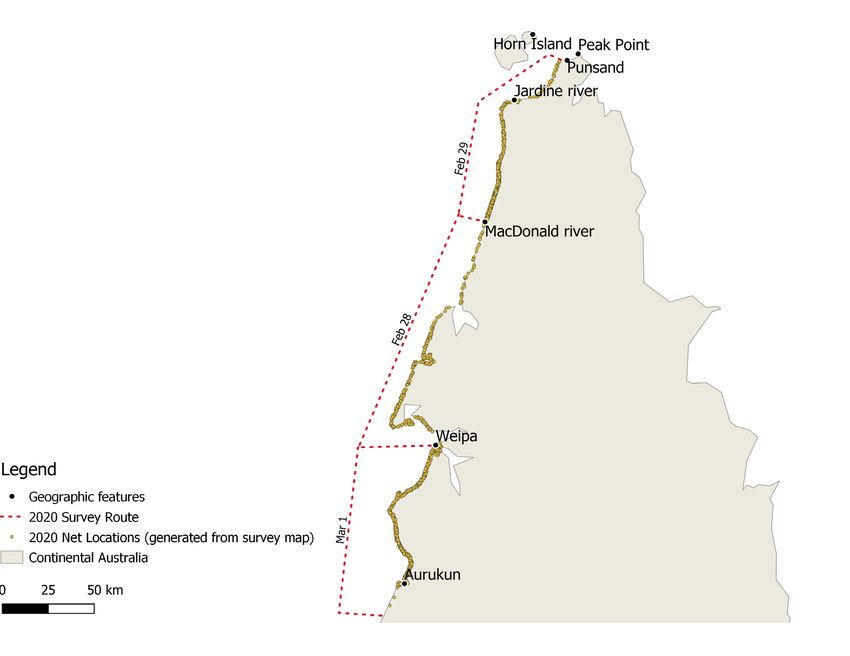
Part I   Surveying ghost gear
         in the Gulf of
         Carpentaria,
         Northern Australia,
         2004 - 2020.

                 Ghost nets in the Gulf of Carpentaria, Australia, 2004-2020 | 7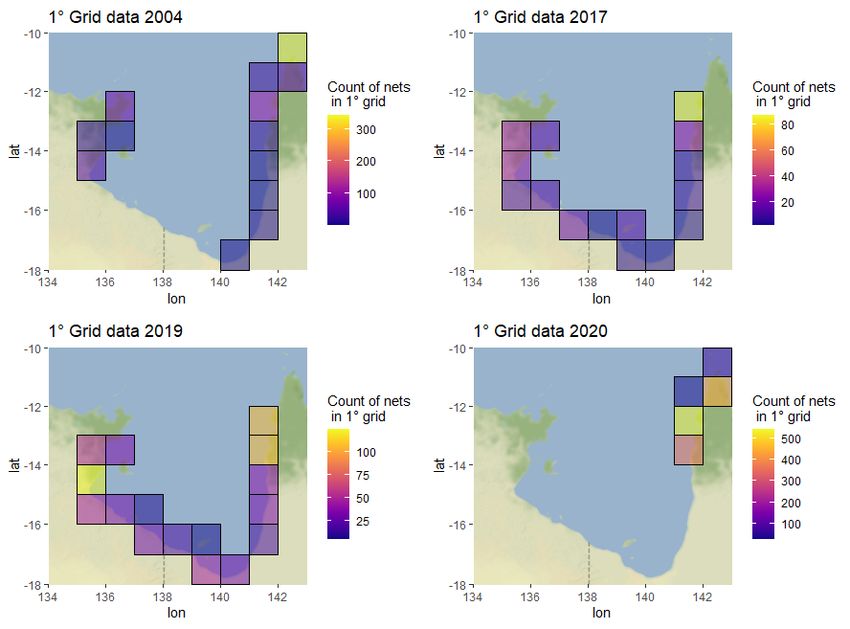
Ghost gear in Northern Australia

In the last decade, the social and political awareness of the ‘ghost gear’ issue has grown
substantially, both locally and internationally. Domestically, the Indigenous Ranger Program across
northern Australia has evolved and grown, enabling more Indigenous people to remain culturally
connected to their land and sea country through meaningful employment. Across northern
Australia, Indigenous ranger groups continue to remove nets on their country, demonstrating the
success of the initial GhostNets Australia (GNA) program supported by the Australian Government.
GhostNets Australia, initiated in 2004, has operated under the principle of ‘saltwater people
working together’. The organisation has worked closely with communities across the region, and
across the country, bringing together stakeholders.
Numerous projects targeting ghost net removal have been operational since the early 2000’s with
support of the Australian Government. Thousands of nets have been recorded and removed by
local ranger groups within this remote region, yielding multiple benefits including new livelihood
skills, converting ghost nets to artwork (with associated domestic and international recognition),
and improved mental health and well-being (Gunn et al., 2010). Collectively, as of 2015, nearly
15,000 ghost nets have been removed from the region. The net removal program has extended
beyond Ranger groups working in the Gulf of Carpentaria to include the Torres Strait, the western
part of the Northern Territory Coast, and parts of the Kimberly coastline in Western Australia.
In recognition of the issue, there is now a multi-stakeholder alliance of fishing industry, private
sector, multinational corporations, non-government organizations, academics and governments,
called the Global Ghost Gear Initiative (GGGI), which is focused on solving the problem of derelict
fishing gear worldwide. Both CSIRO and GhostNets Australia were founding members of this
alliance and have been instrumental in engagement and scientific endeavours which inform the
GGGI.
CSIRO began working with GNA in 2009, helping to analyse data collected by the ranger teams as
part of their management efforts on country. In 2020, CSIRO was involved in supporting an aerial
(re)survey of the coastline across Northern Australia. In affiliation with World Animal Protection
and James Cook University, CSIRO supported surveys aiming to look at changes in the number of
ghost nets along the shoreline. Surveys to date have taken place across the top end of Australia,
with the initial surveys having taken place in the Gulf of Carpentaria.

8 | CSIRO Australia’s National Science Agency
1          Ghost gear surveys

1.1        Description of surveys
To achieve the project goals, we compiled data from coastal aerial surveys across the northern
Australian region. Helicopter surveys took place in November 2004, December 2017, September
2019 and February 2020. In this report we prioritised aerial surveys for data comparability
between the four years of aerial (helicopter) survey to meet the goals of the project. The survey
area represents approximately 2,367 km of Australian coastline in the Gulf of Carpentaria, from
Peak Point/Punsand and Horn Island in Cape York, Queensland, to Gove in the Northern Territory
(excluding 119 km of coastline in the deltas of the Embley and Mission rivers near Weipa), 218 km
around Mornington and Derham Islands (Figure 1). That said, the entire survey area was not
covered by each aerial survey. Furthermore, the methods employed were not consistent across
each of the four aerial surveys (see further description below). However, after quality
assurance/quality control efforts, we employed the best available approaches, given the data at
hand, to enable us to make predictions for estimated ghost net densities for areas that were
unsurveyed.

1.1.1      Aerial surveys

Aerial surveys were conducted by individual spotters in a helicopter. Provided a similar route is
flown by the helicopter, from a similar height, the data collected from aerial surveys is comparable
between years. Ghost nets recorded by aerial surveys are best considered an underestimate of the
true number of nets present along the coastlines, as aerial surveys are less likely to detect smaller
fragments of net, nets buried under sand or those that may be obscured by or hidden in
vegetation.
Four aerial surveys were conducted between 2004 and 2020. The presence of ghost nets in these
surveys was recorded in addition to the primary purpose of the survey, where ghost nets were not
the focus of the survey.
In 2004, an aerial seagrass survey of the intertidal coastlines of the Gulf of Carpentaria was
conducted by the Department of Primary Industries and Fisheries of the Northern Territory, CRC
Reef Research Centre and Biodiversity and Conservation, NT Department of Infrastructure,
Planning and Environment (Roelofs et al., 2005). Following this, helicopter surveys of mangrove
dieback in 2017 and 2019 were conducted through James Cook University as part of the Australian
Government’s National Environmental Science Programme (NESP): Northern Australia
Environmental Resources Research Priorities (Duke et al., 2017). Finally, an additional survey was
conducted in 2020, funded by a private individual (Mr Rupert Imhoff) which aimed to survey ghost
nets from south of Aurukun to Punsand Bay. In this 2020 survey, Professor Duke from James Cook
University also participated to record information on coastal mangroves within the region
surveyed.

                                                          Ghost nets in the Gulf of Carpentaria, Australia, 2004-2020 | 9
Table 1. Summary of information for the four aerial surveys conducted in northern Australia 2004 – 2020, inclusive.
Dates Organised by / Nature of Survey location
participants survey
13-20 Nov 2004 Anthony Roelofs, Seagrass survey Gulf of Carpentaria:
Rob Coles, Neil Van Diemen Gulf to
Smit Castlereagh Bay, Northern
Territory, and from Gove to
Horn Island, Queensland
1-11 December 2017 Norm Duke and Mangrove (GoC Gulf of Carpentaria:
Rob Coles NESP 2017) and Numburindi, Northern
ghost gear Territory along coastline to
surveys Aurukun, Queensland,
Including Wellesley
Islands.
11-23 September Norm Duke, Jock Mangrove and Gulf of Carpentaria:
2019 Mackenzie, ghost gear Numburindi, Northern
Apanie Wood surveys Territory along coastline to
Weipa, Queensland
28 February -1 Norm Duke, Ghost gear and Gulf of Carpentaria:
March 2020 Rupert Imhoff, mangrove Punsand Bay to south of
Nicole McLachlan surveys Aurukun, Queensland
1.1.2 On-ground surveys
Between 2004 and 2009, Indigenous rangers from communities across the northern Gulf region
participated in Caring for Country activities including but not limited to recording information on
and removing ghost nets from country. During this period, several ranger groups worked with
GhostNets Australia on activities around ghost net removal as well as recording of information on
nets found. More than 19 ranger groups were engaged in ghost nets work on country across the
Gulf of Carpentaria. During the five-year period, 6035 nets were recorded and removed across
approximately 1500 km of coastline, with the highest numbers being removed from Mapoon
(n=1,105), Dhimurru (n=828) and Napranum (n=791) (Heathcote et al., 2011). In 2010 alone,
approximately 2600 nets were removed (GhostNets Australia, 2010). During this time, rangers
were also trained in electronic data recording, in addition to ghost net removal (Heathcote et al,
2013). On-ground activities, including surveys and net removal programs are important to ground-
truth aerial surveys, which may miss nets that are buried or hidden from the view among
vegetation.
1.2 2004 aerial survey (seagrass survey)
An aerial helicopter survey of the intertidal habitats between Van Diemen Gulf and Castlereagh
Bay, Northern Territory was conducted between 13 and 17 November 2004 and from Gove to the
Torres Strait between 17 and 20 November 2004. Dates for the survey were selected based on
suitable low tides, to allow the best visible observation of seagrass (and, opportunistically, for
coastal ghost nets). The purpose of this initial survey was to survey seagrass. However, in the
10 | CSIRO Australia’s National Science Agencycourse of seagrass surveys, observers recorded and reported ghost nets. Note, however, the
survey methodology used differed in 2004 than that utilised in subsequent survey efforts.
Regarding ghost gear, the 2004 seagrass report “A survey of intertidal seagrass from Van Diemen
Gulf to Castlereagh Bay, Northern Territory, and from Gove to Horn Island, Queensland” (Roelofs
et al., 2005) states:
“The distribution of discarded fishing gear was clumped with most occurring in two
locations – the north western Gulf and just to the north of Aurukun. The majority of
discarded fishing gear sighted was net pieces (1 – 10 metres in length), not intact fishing
gear. Much of the net was partially buried and many net pieces would not be visible from a
helicopter because of this. Only stranded net would be observed during a seagrass survey.”
Dates of surveys:
• 17 November 2004. Gove to Borroloola.
• 18 November 2004. Borroloola to Karumba.
• 19 November 2004. Karumba to Weipa.
• 20 November 2004. Weipa to Horn Island.
Figure 1. Map of study area from 2004 initial (seagrass-focused) helicopter survey. Note that subsequent surveys
have taken place in some areas outside of this initial survey. Analyses and associated report are based upon all
available information.
Ghost nets in the Gulf of Carpentaria, Australia, 2004-2020 | 11Figure 2. Locations of ghost nets observed in the 2004 aerial surveys.
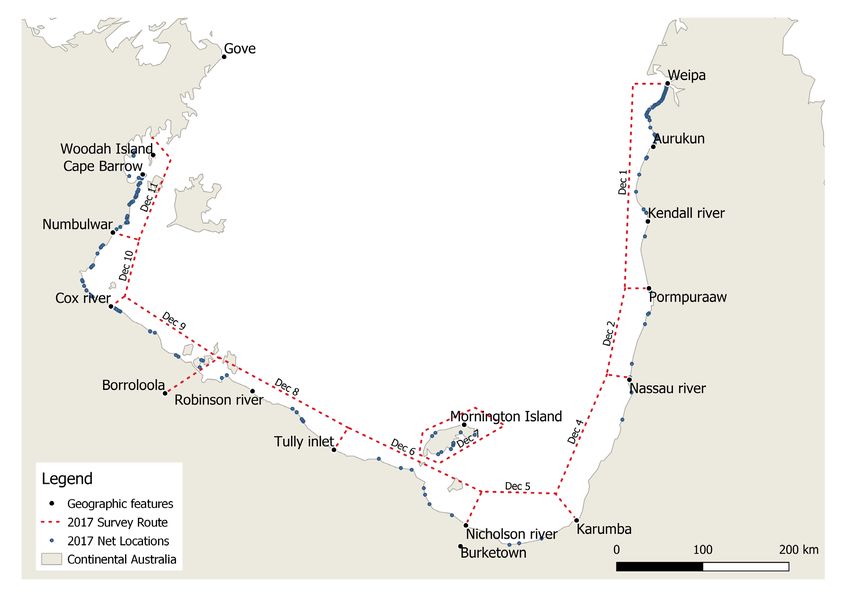
1.3 2017 aerial survey (ghost gear and mangrove)
Between late 2015 and early 2016, extensive areas of mangrove tidal wetland vegetation died
back along 1000 km of the shoreline of Australia’s remote Gulf of Carpentaria (see (Duke et al.,
2017)). The 2017 ghost gear and mangrove dieback aerial helicopter surveys across the Gulf of
Carpentaria began at Weipa, Queensland on 1 December 2017, following the coastline to
Numburindi, Northern Territory. Surveys were completed on 11 December 2017. Surveying both
ghost gear and mangroves, these surveys were conducted in a finer-scale manner than the 2004
seagrass surveys, covering shorter distances per day and taking high resolution imagery along the
way.
As part of the survey methodology, high resolution video footage was taken of the entire coastal
survey, in a consistent manner. This footage was then scanned to identify and count ghost nets.
While the purpose of the survey was primarily to assess mangrove dieback, the technology
employed supported the recording of ghost nets in a reliable, consistent manner.
Dates of surveys with associated survey areas:
• 1st December 2017. Weipa to Pormpurraw.
• 2nd December 2017. Around Pormpurraw to Nassau river.
• 4th December 2017. Pormpurraw to Kurumba.
12 | CSIRO Australia’s National Science Agency• 5th December 2017. Kurumba to Burketown.
• 6th December 2017. Burketown to Tully inlet.
• 7th December 2017. Around Mornington Island.
• 8th December 2017. Tully inlet to Borroloola.
• 9th December 2017. Borroloola to Cox River.
• 10th December 2017. Cox river to Numbulwar.
• 11th December 2017. Numbulwar to above Woodah Island.
Figure 3. Location of ghost nets in the 2017 surveys.
1.4 2019 helicopter survey (ghost gear and mangroves)
As a follow up to the 2017 aerial survey, the same method was employed to evaluate mangrove
dieback (enabling the documentation of ghost nets) across the region in 2019. These aerial surveys
began at Weipa, Queensland, and followed the coastline to Numburindi, Northern Territory
between 11 and 23 September 2019. Again, as part of the survey methodology, high resolution
video footage was taken of the entire coastal survey, in a consistent manner. This footage was
then scanned to identify and count ghost nets.
Ghost nets in the Gulf of Carpentaria, Australia, 2004-2020 | 13Dates of surveys with associated survey areas:
• 12 September 2019. Weipa to Kendall River.
• 13 September 2019. Kendall River to Nassau River.
• 14 September 2019. Nassau River to Karumba.
• 15 September 2019. No survey.
• 16 September 2019. Karumba to Nicholson River.
• 17 September 2019. Nicholson River (Qld) to Robinson River (NT).
• 18 September 2019. Robinson River to Cox River.
• 19 September 2019. No survey.
• 20 September 2019. Cox River to Numbulwar.
• 21 September 2019. Numbulwar to Cape Barrow
Figure 4. Location of ghost nets in the 2019 surveys.
14 | CSIRO Australia’s National Science Agency1.5 2020 helicopter survey (ghost gear and mangroves)
Ghost gear and mangrove dieback helicopter surveys of the Queensland coastline between Peak
Point (-10.7072⁰, 142.4391⁰) and south of Aurukun (-13.4871⁰, 141.5666⁰) were conducted
between 28 February and 1 March 2020, inclusive, by Dr. Norman Duke (James Cook University),
Rupert Imhoff and Nicole McLachlan (Southern Cross University). In this aerial survey, qualitative
information including approximate ghost net locations was provided to the CSIRO team (see
Appendix A., Figure 5, Figure 6, and Figure 7). Two observers or spotters recorded estimated net
numbers, based on ‘zones’ or regions where numbers of nets were recorded. We do not have
imagery access from the survey which was conducted in 2020.
Dates of surveys with associated survey areas:
28 February 2020. Weipa to MacDonald River.
29 February 2020. MacDonald River to Punsand, Cape York.
1 March 2020. Weipa to Aurukun.
Figure 5. First provided map showing Day 1 survey (28 February 2020) from Weipa to MacDonald River,
Queensland, Australia on Friday 28 February 2020. More than 300 intact ghost nets were counted, and a high
abundance of other marine debris was reported (See Appendix A.).
Ghost nets in the Gulf of Carpentaria, Australia, 2004-2020 | 15Figure 6. Map provided showing survey from MacDonald River to Peak Point, Punsand Bay, Cape York on Saturday 29 February 2020. More than 479 intact ghost nets were counted, and a high abundance of other marine debris was reported. Carcasses of five sea turtles, a shark and crabs were observed in the nets. Net numbers are estimated from visual observations from two spotters, with net numbers in ‘zones’ or regions provided. Figure 7. Map provided showing Day 3 survey (1 March 2020) from Weipa to Aurukun. Spotters estimated between 640 and 750 intact ghost nets were observed. 16 | CSIRO Australia’s National Science Agency
Part II An analysis to
        identify ghost gear
        hotspots and changes
        through time in the
        Gulf of Carpentaria,
        Northern Australia.

                Ghost nets in the Gulf of Carpentaria, Australia, 2004-2020 | 17
2 Methodological approach 2.1 Locations Surveys took place across the Gulf of Carpentaria during 2004, 2017, 2019 and 2020. However, data collection approaches, survey times of year, and effort (number of observers x time spent per survey area) was not entirely consistent among surveys. Given one of the key goals of the project was to identify if ghost nets density has changed in space and time, and that some survey areas were not observed during all four of the survey periods, some locations were excluded from analyses (e.g. those areas that were only surveyed once). These locations include Wellesley Islands (surveyed in 2017 only), regional Northern Territory north of Isle Woodah (surveyed 2004 only) and Prince of Wales Island/Horn Island and surrounding islands (surveyed 2004 only). Locations that were not surveyed were also not included in this report and associated analyses. This includes most of the islands in the Gulf of Carpentaria (except where specifically mentioned as included), including larger islands such as Groote Eylandt. We also excluded the three Badu Island nets counted during the 2004 survey. Furthermore, precise locations of nets observed were not reported consistently across all surveys (see Section 2.2.1 below). 2.2 Analysis approach We calculated coastline distances using QGIS version 3.18.0. This was a first step required to ensure geographic distances were consistent among survey years. Statistical analysis was conducted using a Generalized Additive Model (GAM) with the “mgcv” package (Wood, 2019) in R version 3.5.1 (R Core Team, 2018). This approach performs hypothesis testing and allows models to be compared to be fitted to the same data using the same smoothing parameter selection function (Wood 2019). 2.2.1 Generating GPS locations for ghost nets sighted in 2020 surveys Whereas for other survey years geolocation data was available, only qualitative data (descriptive data) was provided for the 2020 aerial surveys. Hence, we did not have specific geolocation information for each ghost net observed in the 2020 helicopter survey. Though locations provided were imprecise, 1,422 nets were recorded in the 2020 survey (see Figure 5, Figure 6, and Figure 7, Appendix A.). There were 300 nets recorded on day one, 479 nets recorded on day two and 643 nets recorded on day three. Hence, we divided the survey routes into 15 survey ‘legs’ between major geographic features noted in the survey notes. To remedy the unknown GPS locations of the nets, we generated GPS net location points based on survey data and placed them randomly within a 0.005⁰ (approximately 1 km width) buffer of the surveyed coastline between Peak Point/Punsand and south of Aurukun (excluding Ducie, Mission and Embley rivers), following the distances in Table 2 (Figure 8). 18 | CSIRO Australia’s National Science Agency
Table 2. Start and end points of survey legs conducted in Queensland in 2020.

  Leg  Number       Start Location        Longitude Latitude       End location                 Longitude Latitude
       of nets
     1       35     Peak point             142.4391 -10.7072 Jardine river                       142.4391 -10.7072
     2       24     Jardine river          142.2112 -10.9221 Crab island                         142.2112 -10.9221
     3       29     Crab island            142.1301 -10.9858 Northern                            142.1301 -10.9858
                                                             peninsula
     4         46 Northern                 142.1531 -11.0842 Vrilya point                        142.1531 -11.0842
                  peninsula
     5        129 Vrilya point             142.1166     -11.2248   Cotterell Creek               142.1166        -11.2248
     6        115 Cotterell Creek          142.1201     -11.3669   Doughboy river                142.1201        -11.3669
     7        101 Doughboy river           142.0949     -11.4591   Macdonald river               142.0949        -11.4591
     8         40 Macdonald river          142.0635     -11.5341   Cullen point                  142.0635        -11.5341
     9         10 Cullen point             141.9102     -11.9501   Mapoon                        141.9102        -11.9501
    10        250 Mapoon                   141.7994     -12.0618   Weipa                         141.7994        -12.0618
    11        230 Weipa                    141.8169     -12.6528   Boyd point                    141.8169        -12.6528
    12         80 Boyd point               141.6314     -12.8968   Norman creek                  141.6314        -12.8968
    13         80 Norman creek             141.6147     -13.0477   Waypoint 3                    141.6147        -13.0477
    14        250 Waypoint 3               141.6311     -13.1605   Aurukun                       141.6311        -13.1605
    15          3 Aurukun                  141.6346     -13.3619   End 2020                      141.6346        -13.3619

Figure 8. Predicted net locations from 2020 surveys. Using the survey maps in Figure 5, Figure 6, and Figure 7, we
generated GPS datapoints within a 0.005 degree buffer of the Queensland coastline surveyed during 2020.

                                                                   Ghost nets in the Gulf of Carpentaria, Australia, 2004-2020 | 19
2.2.2 Grid map of the Gulf of Carpentaria To monitor changes in beached ghost net density across the Gulf of Carpentaria, we divided the GoC region to 1⁰ x 1⁰ grid cells. While coarser in scale, this allowed us to amalgamate data collected over multiple years from each of the four helicopter surveys. Each 1⁰ x 1⁰ grid cell represents an area of approximately 111x111 km (sensu Wilcox et al. 2013, Figure 9 below). Due to tortuosity of the coastline, the actual length of coastline within each 1⁰ grid cell varies (see Table 3 for values). Figure 9. 1⁰ grid cell applied over the gulf of Carpentaria. After determining the length of coastline in each grid cell, we plotted a colour-coded grid map of the count of nets recorded in each grid cell in each year the grid was surveyed (Figure 10). However, these values are not adjusted for the length of the coastline nor the survey effort (the distance of coastline flown during a survey day per year). To determine the density of beached ghost nets per grid cell, we divided the net count per grid cell by the length of coastline per grid cell (Figure 11). Note that the values depicted in Figure 10 and Figure 11 are not adjusted for survey effort. 20 | CSIRO Australia’s National Science Agency
Table 3. The length of the coastline and major geographic features (towns, points and river mouths) in each of the
20 surveyed 1⁰ grid cells. We also include the survey years and any relevant notes (columns 3 and 4, respectively).

  Grid cell   Survey        Geographic features Survey          Notes
              coast                             Years
              length
  -11, 142          52          Horn island, Peak 2004,         Measured coastline from Peak Point/Punsand.
                         point/Punsand, Jardine 2020            Prince of Wales Island 59 km; Horn island 25
                                       river (QLD)              km.
  -12, 141          88        Cullen point (QLD) 2004,
                                                   2020
  -12, 142          39     Vrilya point, Cotterell 2004,
                          creek, Doughboy river, 2020
                          MacDonald river (QLD)
  -13, 136         206                  Gove (NT) 2004          Coastline not measured beyond Gove.
  -13, 141         137    Weipa, Mapoon, Boyd 2004,
                                      point (QLD) 2017,
                                                   2019,
                                                   2020
  -14, 135          39         Cape Barrow (NT) 2004,           Northern part of inlet 210km. Woodah Island,
                                                   2017,        northern Groote Eylandt not surveyed (NT).
                                                   2019
  -14, 136         135          Walker river (NT) 2004,
                                                   2017,
                                                   2019
  -14, 141         125         Aurukun, Norman 2004,
                          creek, southern end of 2017,
                              2020 survey (QLD) 2019,
                                                   2020
  -15, 135         151          Numbulwar (NT) 2004,
                                                   2017,
                                                   2019
  -15, 141         188              Kendall river, 2004,
                             Pormpuraaw (QLD) 2017,
                                                   2019
  -16, 135          62             Cox river (NT) 2004,
                                                   2017,
                                                   2019
  -16, 136         360      Roper gulf coast and 2004,          Roper gulf coast 192km (north of Borroloola),
                                      islands (NT) 2017,        West Island, Centre Island, North Island and
                                                   2019         Vanderlin Island (together 168 km).
  -16, 137          79          Coast and part of 2004,         part Vanderlin Island (NT) and 28 coast.
                            Vanderlin Island (NT) 2017,
                                                   2019
  -16, 141         121        Nassau river (QLD) 2004,
                                                   2017,
                                                   2019
  -17, 137          97   Robinson river, Norther 2004,
                           Territory side of state 2017,
                                      border (NT) 2019

                                                                   Ghost nets in the Gulf of Carpentaria, Australia, 2004-2020 | 21
-17, 138 119 Tully inlet, Queensland 2004,
side of state border 2017,
(QLD) 2019
-17, 139 255 Mornington Island, 2004, Mornington Island (218 km), Forsyth island (21
Forsyth Island and 2017, km) and 16 km of coastline.
coast (QLD) 2019
-17, 141 123 Staaten river, Gilbert 2004,
river, Dinah Island 2017,
nature refuge (QLD) 2019
-18, 139 138 Nicholson river (QLD) 2004,
2017,
2019
-18, 140 151 Karumba (QLD) 2004,
2017,
2019
Figure 10. Raw number of nets counted per grid cell. The mapped density of nets per grid cell is not adjusted for the
length of coastline per grid cell, nor for survey effort.
22 | CSIRO Australia’s National Science AgencyFigure 11. Nets standardised per kilometre of coastline observed within each survey year. This means the number of nets per grid cell has been adjusted for the length of coastline per grid cell, including zeros. The mapped nets per kilometre in each grid cell has not been adjusted for survey effort. Not surprisingly, the number of nets recorded per kilometre of coastline varied between survey year. When nets per kilometre are mapped with a regular colour scale showing a range of 0-12 nets between years, it shows that the number is
Figure 12. Nets standardised per kilometre of coastline observed between survey years. This means the number of
nets per grid cell has been adjusted for the length of coastline within each grid cell, including zeros, with a fixed
legend scale. This differs from Figure 11, in which the colour scale varies each survey year to show variation within
survey year. The mapped nets per kilometre in each grid cell has not been adjusted for survey effort.

2.2.3            Survey effort

Survey effort was applied at the most appropriate scale based on the information available. We
then summarized the data to survey effort based on the number of coastal kilometres surveyed
over each helicopter day (Table 4). Ideally, the number of survey flight hours would provide more
accurate survey effort, but this information was not available across all surveys. As noted
previously, we used QGIS (a free and open source Geographic Information Systems platform) and
the ESRI “Coastlines” package to quantify the coastline length across the Gulf of Carpentaria (ESRI
(Environmental Systems Research Institute) is an international supplier of GIS software).

24 | CSIRO Australia’s National Science Agency
Table 4. Survey effort (kilometres of coastline surveyed per day of aerial surveys) during 2004, 2017, 2019 and 2020
helicopter surveys.

  Survey Date         Start           End               Nets      Coastline       Notes
  year                                                Reported    Surveyed
                                                                  (km)
     2004 17 Nov Gove                 Borroloola           125      878           Measured coastline to/from Roper
                                                                                  Gulf rather than the inland
                                                                                  Borroloola township.
     2004 18 Nov Borroloola           Karumba               1       593           Measured coastline to/from Roper
                                                                                  Gulf rather than the inland
                                                                                  Borroloola township.
     2004 19 Nov Karumba              Weipa                 83      524           Excluded Embley river delta.
     2004 20 Nov Weipa                Horn island          123      372           Excluded Mission river delta.
     2004 20 Nov Horn island          Horn island          338      84            Coastline measurement Horn Island
                                                                                  and Prince of Wales Island. Nets
                                                                                  were on Horn Island, Prince of
                                                                                  Wales Island, Wednesday Island,
                                                                                  Friday Island and Goode Island.
     2017   1 Dec     Weipa           Pormpurraw           120      288
     2017   2 Dec     Pormpurraw      Nassau river          8       123
     2017   4 Dec     Nassau river    Kurumba               3       197
     2017   5 Dec     Karumba         Nicholson             3       145
                                      river
     2017 6 Dec    Nicholson          Tully inlet           7       202
                   river
     2017   7 Dec Mornington          Mornington            12      218
                   island             island
     2017   8 Dec Tully inlet         Borroloola            18      182
     2017   9 Dec Borroloola          Cox river             21      209
     2017   10 Dec Cox river          Numbulwar             17      130
     2017   11 Dec Numbulwar          North of              56      232
                                      Woodah
                                      Island
     2019   12 Sep    Weipa           Kendall river        241      204
     2019   13 Sep    Kendall river   Nassau river          40      207
     2019   14 Sep    Nassau river    Kurumba               25      197
     2019   16 Sep    Kurumba         Nicholson             22      145
                                      river
     2019 17 Sep Nicholson            Robinson              83      327
                 river                river
     2019 18 Sep Robinson             Cox river             23      231
                 river
     2019 20 Sep Cox river            Numbulwar            140      130
     2019 21 Sep Numbulwar            Cape Barrow          127      91
     2020 28 Feb Weipa                MacDonald            300      260
                                      river
     2020 29 Feb MacDonald            Punsand/             479      113
                 river                Peak Point
     2020 1 Mar Weipa                 past Aurukun         643      122

                                                                  Ghost nets in the Gulf of Carpentaria, Australia, 2004-2020 | 25
2.2.4 Scaling survey effort to 1⁰ grid cells
To standardise survey effort, we used general additive models (GAM)s with a Tweedie distribution
(R package “mgcv” (Wood, 2019)), selected due to the commonality of zero counts in the data. As
part of the data validation process, we also visually validated data, ensuring zero values were
included into each surveyed grid cell where no nets were detected in a survey year. GAMs were
used to assess the relationship between the number of nets per grid cell, the grid cell location, the
length of the coastline, year of survey, survey effort (1 / number of kilometres of coastline
surveyed per day), the latitude of survey grid cell (1⁰) and longitude of survey grid cell (1⁰),
examining both additive (+) and interactive (x) relationships. Akaike Information Criterion (AIC)
was used to choose the GAM that best fit the data and comparing these to the null model. Using
AIC, the best model is that which has the lowest AIC, though models which differ by a value less
than 2 may be considered equivalent (Burnham & Anderson, 2002) (see Table 5).
Table 5. Comparison of general additive models (GAMs) that examine the relationship between number of counted
nets and survey effort parameters for each 1⁰ grid cell. Model 4 (bold) is the best model, based on AIC. Tested
models that did not converge are not included in this table.
Model Model parameters AIC
0) Null model Number of nets ~ 1, offset = effort. 548.8
1) Addition only model Number of nets ~ Grid cell + Coastline 498.7
length + Year + 1⁰ latitude * 1⁰ longitude,
offset = effort.
2) Interaction between year and location Number of nets ~ Grid cell + Coastline 486.5
length + Year * 1⁰ latitude * 1⁰ longitude,
offset = effort.
3) Interaction between coastline length and Number of nets ~ Grid cell + Coastline 494.9
year length * Year + 1⁰ latitude * 1⁰ longitude,
offset = effort.
4) Interaction between coastline length, Number of nets ~ Grid cell + Coastline 484.0
year and location length * Year * 1⁰ latitude * 1⁰ longitude,
offset = effort.
5) Interaction between coastline length and Number of nets ~ Grid cell + Year + 498.5
location Coastline length * 1⁰ latitude * 1⁰
longitude, offset = effort.
6) Interaction between grid cell and Number of nets ~ Grid cell * Coastline 499.3
coastline length length + Year + 1⁰ latitude * 1⁰ longitude,
offset = effort.
7) Interaction between grid cell and Number of nets ~ Grid cell * Coastline 486.9
coastline length, year and location length + Year * 1⁰ latitude * 1⁰ longitude,
offset = effort.
26 | CSIRO Australia’s National Science AgencyThe model that best described the relationship between the number of nets, the coastline length,
year of survey, survey effort (1 / number of kilometres of coastline surveyed per day), latitude of
survey grid cell (1⁰) and longitude of survey grid cell (1⁰), was Model 4 (in bold, Table 5). This
model shows that the density of nets per grid cells is most strongly driven by the interaction
between survey year interacting with location (as represented by latitude and longitude).
2.2.5 Survey effort-adjusted net densities in 1⁰ grid cells
Using the Model 4 (see section above (2.2.4), we predicted the number of nets for each grid cell,
for each year, in a scenario where survey effort remained consistent. We performed this
prediction based on the median survey effort of 205 km of coastline surveyed per day. The output
of this survey effort-adjusted ghost net density is shown in Figure 13.
Figure 13. Effort-standardised number of nets predicted to occur per 10 grid cell. The mapped density of nets per
grid cell is not adjusted for the length of coastline per grid cell.
Ghost nets in the Gulf of Carpentaria, Australia, 2004-2020 | 27Figure 14. The number of nets predicted to occur per kilometre in each grid cell for 2004, 2017, 2019 and 2020. 28 | CSIRO Australia’s National Science Agency
3           Findings and their interpretations

In the section below we present and discuss the ghost net density results in in the Gulf of
Carpentaria region, based on aerial helicopter surveys conducted in 2004, 2017, 2019 and 2020. In
regions or grid cells where fewer surveys were conducted, the predictions of ghost net densities
and changes through time will be less reliable than in those regions that were surveyed in each of
the four survey periods.
Overall, because of the bathymetry, geography, monsoonal seasonality and influence of wind,
waves, and currents, the Gulf of Carpentaria acts as an accumulation area, or sink, for ghost nets
and other anthropogenic debris. While previous studies have noted the high density of ghost nets
in the region (see Wilcox et al. 2012, Gunn et al. 2010, Kiessling 2002), it is worth noting that if the
loss of fishing nets is not abated, the issue of net and other debris will continue within the region.
This is a high biodiversity value, with six of the seven threatened marine turtle species occurring
here, with substantial proportions of the remaining global populations for some species (Limpus
and Fien 2009, Biddle and Limpus 2011). The gulf’s shallow waters are extensive, with seagrass
and mangrove-reliant communities. Land and sea management here is complicated due to its
remoteness.

3.1         Ghost net hotspots
Based on the four helicopter surveys, the highest number of nets per kilometre is predicted to
occur in the northern Cape York Peninsula of Queensland, including the coastline passing Vrilya
point, Cotterell creek, Doughboy river, MacDonald river (QLD). Another hotspot occurs south of
the Gove Peninsula. These findings reflect hotspots identified in the 2004-2009 Summary report
by GhostNets Australia, which reported that hotspots were predominantly found in the north-
eastern and north-western corners of the Gulf (Heathcote et al., 2011). The southern portion of
the Gulf of Carpentaria, near the Queensland/Northern territory border, was predicted to contain
the fewest nets (Table 6).

                                                           Ghost nets in the Gulf of Carpentaria, Australia, 2004-2020 | 29
Table 6. Predicted ghost nets per kilometre of coastline in surveyed regions of the Gulf of Carpentaria, standardised
for aerial survey effort. This hotspot table is sorted by descending number of nets for the most recent year of
survey, 2020.
Grid cell 2004 2017 2019 2020 Geographic features
-12, 142 4.2 6.5 6.9 7.1 Vrilya point, Cotterell creek, Doughboy river,
MacDonald river (QLD)
-11, 142 4.3 3.3 3.1 3.1 Horn island, Peak point/Punsand, Jardine river
(QLD)
-13, 141 0.5 1.6 1.9 2.1 Weipa, Mapoon, Boyd point (QLD)
-14, 141 0.2 1 1.2 1.4 Aurukun, Norman creek, southern end of 2020
survey (QLD)
-14, 135 0.3 0.9 1.1 1.2 Cape Barrow (NT)
-15, 135 0.1 0.6 0.8 0.9 Numbulwar (NT)
-16, 135 0 0.3 0.5 0.6 Cox river (NT)
-12, 141 0.2 0.3 0.4 0.4 Cullen point (QLD)
-17, 137 0 0.1 0.3 0.4 Robinson river, Norther Territory side of state
border (NT)
-17, 141 0 0.1 0.2 0.3 Staaten river, Gilbert river, Dinah island nature
refuge (QLD)
-18, 139 0 0.1 0.2 0.3 Nicholson river (QLD)
-16, 141 0 0.1 0.2 0.2 Nassau river (QLD)
-18, 140 0 0.1 0.1 0.2 Karumba (QLD)
-14, 136 0.1 0.1 0.1 0.1 Walker river (NT)
-15, 141 0 0.1 0.1 0.1 Kendall river, Pormpuraaw (QLD)
-16, 136 0 0 0.1 0.1 Roper gulf coast and islands (NT)
-16, 137 0 0 0.1 0.1 Coast and part of Vanderlin island (NT)
-17, 138 0 0 0.1 0.1 Tully inlet, Queensland side of state border (QLD)
-13, 136 0.3 0 0 0 Gove (NT)
-17, 139 0 0 0 0 Mornington Island, Forsyth island and coast (QLD)
3.2 Ghost gear changes through time
The number of ghost nets in most locations (85% or 17 of 20) increased from 2004 until 2020
surveys. The density of beached ghost nets in three grid cells appear to be decreasing. Notably,
ghost net accumulation in some regions is more rapid than in others. This may be a ‘real’
phenomenon or may reflect clean-up activities or changes in fishing locations. It may also reflect a
change in operation of the types of fishing boats that have high rates of gear becoming derelict
and generating ghost nets. Information on net types that are stranded would help us to answer
this question.
There have been substantial changes in fisheries management practices in recent years by our
Indonesian neighbours that have resulted in a reduction of total fishing vessels within the Arafura
and surrounding seas. However, while there has been a prohibition of purse seine and trawl nets,
there has been a concordant increase in gill nets (AFMA, pers. comm.). Hence, it is possible that
the number of nets lots may not have changed substantially, though further investigation into the
30 | CSIRO Australia’s National Science Agencytypes of nets washing ashore in the Gulf of Carpentaria could prove meaningful. Overall, we were
surprised that given the many years of on-ground clean-up activities in which ghost nets have
been removed within the Gulf of Carpentaria, an overall increase in the number of nets was
detected from 2004 through 2020.
Table 7. Changes through time of standardised and predicted ghost nets per grid cell in the Gulf of Carpentaria.
Grid cell Geographic features 2004 2017 2019 2020 Increasing or Change
decreasing
-11, 142 Horn island, Peak 222.9 170.6 163.7 160.4 Decreasing -62.5
point/Punsand, Jardine river
(QLD)
-12, 141 Cullen point (QLD) 17.2 30.5 33.3 34.8 Increasing 17.6
-12, 142 Vrilya point, Cotterell creek, 163.5 251.6 268.8 277.9 Increasing 114.4
Doughboy river, MacDonald
river (QLD)
-13, 136 Gove (NT) 63.9 1.6 0.9 0.7 Decreasing -63.2
-13, 141 Weipa, Mapoon, Boyd point 66.9 219.9 264.1 289.4 Increasing 222.5
(QLD)
-14, 135 Cape Barrow (NT) 13.2 36.8 43.1 46.7 Increasing 33.5
-14, 136 Walker river (NT) 18.5 16 15.6 15.5 Decreasing -3
-14, 141 Aurukun, Norman creek, 25.2 119.6 151.9 171.2 Increasing 146
southern end of 2020 survey
(QLD)
-15, 135 Numbulwar (NT) 17.7 95.1 123.2 140.2 Increasing 122.5
-15, 141 Kendall river, Pormpuraaw 7.1 16.8 19.1 20.4 Increasing 13.3
(QLD)
-16, 135 Cox river (NT) 0.6 17.9 30 38.9 Increasing 38.3
-16, 136 Roper gulf coast and islands 0.2 13.3 25.5 35.4 Increasing 35.2
(NT)
-16, 137 Coast and part of Vanderlin 0.1 3 5.1 6.7 Increasing 6.6
island (NT)
-16, 141 Nassau river (QLD) 1.3 14.2 20.4 24.5 Increasing 23.2
-17, 137 Robinson river, Norther 0.1 13.5 28.2 40.7 Increasing 40.6
Territory side of state border
(NT)
-17, 138 Tully inlet, Queensland side of 0.1 5.5 10.7 15 Increasing 14.9
state border (QLD)
-17, 139 Mornington Island, Forsyth 1.1 6.3 8.3 9.6 Increasing 8.5
island and coast (QLD)
-17, 141 Staaten river, Gilbert river, 1.1 16.8 25.4 31.2 Increasing 30.1
Dinah island nature refuge
(QLD)
-18, 139 Nicholson river (QLD) 0.2 13.3 26.5 37.4 Increasing 37.2
-18, 140 Karumba (QLD) 0.6 13.9 22.4 28.3 Increasing 27.7
Ghost nets in the Gulf of Carpentaria, Australia, 2004-2020 | 313.2.1 Queensland changes through time The number of beached ghost nets increased in all but one grid cell between 2004 and 2020 for Queensland sites (Figure 15). The sharpest increase occurred at the grid cells containing Weipa, Mapoon, Boyd point (QLD) (-13, 141) and Vrilya point, Cotterell creek, Doughboy river, MacDonald river (QLD) (-12, 142), which gained 225.5 and 114.4 nets respectively between 2004 and 2020. This increase is despite clean-up efforts in the area, noted by Rupert during the 2020 northern Queensland survey. This suggests that despite clean-up efforts, beached ghost nets may be increasing in this area. Information about on-ground, local clean-up efforts would be useful to contextualise this information. The northern neighbouring grid cell (-11, 142), containing Horn island, Peak point/Punsand, Jardine river (QLD), likewise demonstrated high numbers of beached nets during 2004, standardised at 222.9 nets. However, this grid cell (-11, 142), was the only location in Queensland where the number of beached nets appeared to have decreased over time, with a reduction to 160.4 nets/km in 2020 (Table 7). The reason for decrease in nets is not known, though it may be due to local clean-up efforts, an artefact of the surveys that were conducted (for example, this grid cell contains several islands, and we only have information on which islands were included in the survey during 2004) or it could be associated with greater detectability due to mangrove dieback. It is possible that this predicted decrease is an artefact of the survey or analysis methods, as this northern point was surveyed in only two years (2004 and 2020), meaning that the data is less robust than other regions. We urge caution against overinterpretation of this finding. One interesting observation is the sharp increase in nets at the southern Queensland latitudes. The 2004 surveys revealed very few nets in these regions, but later (2017, 2019) surveys showed nets accumulating in this southern region. From this data alone, and without more specific information on clean-up effort in the region, we do not know whether all southern regions are rapidly accumulating ghost nets or whether it reflects less clean up occurring than other sections of the Queensland coastline, given its sparse population. 32 | CSIRO Australia’s National Science Agency
Figure 15. Changes in net numbers through time in each grid cell across Queensland.

3.2.2        Northern Territory changes through time

Across the Northern Territory, the change in the number of ghost nets through time was not as
dramatic as for Queensland (Figure 16), except for two grid cells. The sharpest increase in
predicted net density in the Northern Territory occurs on the coast and among the grid cell
containing Numbulwar (-15, 135), which experienced a nine-fold increase in nets. The remaining
regions within the Northern Territory showed a gradual increase (two showed a gradual decrease)
in ghost nets between 2004 and 2020. The sharpest decrease occurred in the grid cell containing
the Gove peninsula ( -13, 136), however this grid cell was only surveyed once in 2004 and
therefore the expected decrease is based on modelled variables rather than real observations of a
decrease, so we urge caution in over-interpreting this finding. Other sites within the Northern
Territory were fairly consistent in numbers of nets observed across the 16 years of aerial surveys
(Figure 16).

                                                                 Ghost nets in the Gulf of Carpentaria, Australia, 2004-2020 | 33
Figure 16. Changes in net numbers through time in each grid cell in Northern Territory. Considerations and caveats The hotspot tables and maps produced herein are influenced by a number of factors that are relevant to consider. For instance, ghost net accumulation hotspots are likely influenced by clean- up efforts on other beaches, that may be masking accumulation areas in other parts of the Gulf. This in turn relates to accessibility, location and engagement of local Indigenous ranger groups and their activities, resources, seasonality, and other important points to consider that may affect where and how many ghost nets are observed from aerial surveys. In addition, it has been noted that mangrove dieback has been a very strong phenomenon across the Gulf of Carpentaria (N. Duke, J. Mackenzie, personal communication). Hence, it may be that the increase in ghost nets recorded across the GoC reflects the increase in detectability of nets, due to lack of vegetation cover. It was beyond the scope of this project to analyse the mangrove data in concert with ghost net data, though adding a simple rank score of mangrove dieback/increased visibility at even the 10 x 10 scale would provide insights to this potential issue (and would allow the analyses to take the phenomenon into account if indeed it is a mitigating factor affecting net counts). Finally, there have been a number of major weather events in the last few years within the region, with substantial seasonal storms, including multiple ‘severe’ tropical cyclones. Such weather events have been known to dislodge nets or other items and to move debris substantial distances. It is possible that such weather events have also contributed to the increased detection of ghostnets within the region. 34 | CSIRO Australia’s National Science Agency
One key consideration that would improve our understanding and interpretation of these results
would be to add coastal net clean-up data (including location, effort, seasonality, and net types) to
this aerial survey information. Hotspots reflect the arrival of ghost-nets on the beach, minus the
offshore transport of ghost nets away from the beach. For the moment, the findings in this report
do not include clean-up efforts that may have (likely have) influenced numbers of nets observed
(see notes in Appendix A.). Therefore, the hotspots denoted herein may not necessarily reflect
solely where the most nets are accumulating. They may also reflect the remoteness, accessibility
and on-ground activities taking place within the region. Likewise, those areas where nets are not
observed may reflect the intensity of on-ground clean-up efforts, rather than a region that does
not or has not accumulated ghost nets.

                                                          Ghost nets in the Gulf of Carpentaria, Australia, 2004-2020 | 35
4 Opportunities and Suggestions
4.1 Improving ghost gear management
In the preceding section, we briefly touched on some of the challenges inherent to interpretation
of the data presented, based on the variability in data recording, areas surveyed, time of year, and
on ground activities.
We make the following specific recommendations to improve the understanding of sources,
movement and distribution of beached ghost nets in the Gulf of Carpentaria:
1) Conduct annual or semi-annual helicopter aerial surveys for ghost nets, with consistent
observer effort, meta data recording and data collation;
a. Specific data to include flight hours per day, number and seating arrangement of
observers, type of aircraft, kilometres of coastline surveyed, ambient weather conditions.
b. If fixed cameras used, ensure metadata associated with image capture/processing is
provided.
c. We suggest or encourage the use of fixed cameras as an independent record and
validation of ‘spotter’ observation data.
d. Ensure helicopter surveys are conducted at similar times of the year to previous surveys,
within weather restrictions and safety limitations.
e. Align future survey efforts with the best practices and approaches from previous surveys
where possible.
2) In concert, add coastal net survey and/or clean-up data (including location, effort, seasonality,
and net characteristics) to ‘ground truth’ or allow one to measure the differences between
on-ground and aerial survey efforts. This will facilitate predictions of numbers of ghost nets,
hotspots, and other key information desired to improve management efforts and reduce
ghost nets, in the absence of complete aerial or on-ground surveys.
3) Seek consistency in data collection, collation and management among aerial surveys and on-
ground net removal/clean-up efforts through working closely with Ranger groups.
a. Specific training within and among data collection groups will ensure consistency in
this regard;
b. Development of training modules and a shared data portal that allows accessibility
to appropriate parties would benefit the data collection, maintenance, and analysis
opportunities for such efforts.
4) Ensure data are made available for comparison between aerial surveys and on-ground net
removal/clean-up efforts.
5) Apply hindcasting models with validation from trackers on actual nets (see Wilcox et al. 2013
for example) to estimate how long and where nets move within and beyond the Gulf of
Carpentaria, and to identify potential low cost, safer areas for net retrieval/interdiction.
36 | CSIRO Australia’s National Science AgencyYou can also read


