Sentinel-1 Intensity Analysis in ENVI SARscape Tutorial
←
→
Page content transcription
If your browser does not render page correctly, please read the page content below

Sentinel-1 Intensity Analysis in ENVI SARscape Tutorial

Sentinel-1 Intensity Analysis in ENVI SARscape Tutorial
This tutorial provides an introduction to working with Sentinel-1 synthetic aperture radar
(SAR) data in ENVI® SARscape. You will learn about SAR remote sensing and how to prepare
Sentinel-1 data for backscatter intensity analysis. Steps are provided for downloading data,
importing data into SARscape, setting preferences, multilooking, spatial subsetting (sample
selection), filtering, and geocoding. You will also learn how to create a color composite of
intensity images.
The following software must be installed and licensed on your system:
   n   ENVI 5.5.1
   n   ENVI SARscape 5.5 Basic Module
See the following sections:
   n   Files Used in This Tutorial
   n   Introduction to SAR
   n   Working with Sentinel-1 Data in ENVI SARscape
           n   Set ENVI Preferences
           n   Set SARscape Preferences
           n   Download and Import Sentinel-1 Scenes
           n   Open and Display Intensity Images
           n   Process Intensity Images
           n   Create a Color Composite
   n   Using the ENVI Modeler for Batch Processing
   n   References

Files Used in This Tutorial
Sample data files for the tutorial are available from our ENVI Tutorials web page. Click the
"SAR Getting Started" link under "ENVI Tutorial Data." Extract the data to a new directory on
your local drive called SARGettingStarted. Make sure this directory has write permissions.
Then create a subfolder called TempFiles.

                                                   Page 1 of 32
                         © 1988-2021 Harris Geospatial Solutions, Inc. All Rights Reserved.
 This information is not subject to the controls of the International Traffic in Arms Regulations (ITAR) or the Export
                                          Administration Regulations (EAR).
Sentinel-1 Intensity Analysis in ENVI SARscape Tutorial

               File                                                   Description
 2017-12-12-SLC-Power/                 Folder containing Sentinel-1 intensity (power) images of a
                                       region in Chile
 StudySite.shp (and .dbf,              Shapefile indicating the boundary of the study area
  .shx)

You will also need to download a digital elevation model (DEM) for geocoding. The Geocode
the Images section of this tutorial provides instructions for downloading an ASTER Global DEM
or SRTM-3 V4 DEM.

Introduction to SAR
Synthetic aperture radar (SAR) is an active imaging system, whereby the sensor provides its
own energy source to illuminate the Earth's surface. It emits microwave radiation toward the
surface and receives the reflected signal. In contrast, optical sensors—such as Landsat,
Sentinel-2, and WorldView—rely on the sun to illuminate the surface. They measure the
amount of reflected sunlight at the sensor. Thus, optical sensors that measure visible to
shortwave-infrared (SWIR) wavelengths can only provide useful images during the daytime.
Cloud cover can obscure the surface for optical sensors, which severely limits the extraction
of meaningful information about the surface. SAR sensors, on the other hand, can obtain
measurements any time of day and in any cloud-cover condition.

                                                   Page 2 of 32
                         © 1988-2021 Harris Geospatial Solutions, Inc. All Rights Reserved.
 This information is not subject to the controls of the International Traffic in Arms Regulations (ITAR) or the Export
                                          Administration Regulations (EAR).
Sentinel-1 Intensity Analysis in ENVI SARscape Tutorial

SAR imaging is sensitive to the effects of topography, surface roughness, and moisture. This
makes it suitable for a wide variety of scientific applications. The interactions between
microwave sensing and the Earth's surface are complex. This, combined with the amount of
processing involved, tends to discourage some users from working with SAR data. This
tutorial provides an introduction to SAR remote sensing so that you can begin to explore its
full potential.
Spaceborne and airborne radar systems transmit microwave pulses toward the Earth's
surface in a side-looking (oblique) direction. The sensor's antenna focuses the regular pulses
into a beam, which illuminates the surface at a right angle to the direction the sensor is
moving. The direction of the antenna beam is called the range, or ground range. The direction
of the flight path is called the azimuth.

                                                   Page 3 of 32
                         © 1988-2021 Harris Geospatial Solutions, Inc. All Rights Reserved.
 This information is not subject to the controls of the International Traffic in Arms Regulations (ITAR) or the Export
                                          Administration Regulations (EAR).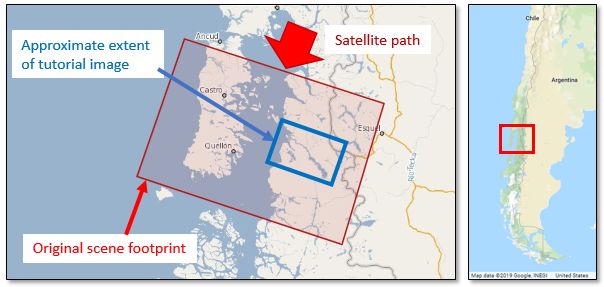
Sentinel-1 Intensity Analysis in ENVI SARscape Tutorial

Sentinel-1 transmits energy at a frequency of 5.405 GHz, in the microwave region called the
C-band. In this region, microwave energy only partially penetrates through surfaces such as
vegetation and soils, compared to L-band sensors that can penetrate all the way through those
materials under dry conditions. (Moisture prevents the energy from penetrating through most
soils.) X-band sensors are primarily used for investigations of surface features since the
microwave energy only penetrates the top layer layer of materials.
The following figure shows the different SAR missions and their microwave regions. Click on
the thumbnail to see a larger version.

The antenna receives a portion of the microwave energy reflected from the surface objects
within the beam pattern. The ratio of the power between the transmitted and reflected energy
is called backscatter.

                                                   Page 4 of 32
                         © 1988-2021 Harris Geospatial Solutions, Inc. All Rights Reserved.
 This information is not subject to the controls of the International Traffic in Arms Regulations (ITAR) or the Export
                                          Administration Regulations (EAR).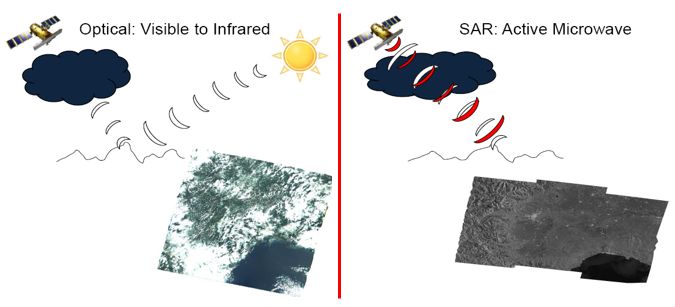
Sentinel-1 Intensity Analysis in ENVI SARscape Tutorial

Backscatter is dimensionless; however, it is typically reported in decibels (dB). Backscatter
consists of two variables: amplitude and phase. Amplitude—also called magnitude—is a
measure of the strength of the reflected signal at the sensor. Phase represents the point along
the wave of the reflected signal when it is received at the sensor. The difference in phase
between the transmitted signal and the received signal provides information about the
surface. This difference is measured in radians or degrees.
The following diagram shows the relationship between amplitude and phase in a microwave
signal:

                                                   Page 5 of 32
                         © 1988-2021 Harris Geospatial Solutions, Inc. All Rights Reserved.
 This information is not subject to the controls of the International Traffic in Arms Regulations (ITAR) or the Export
                                          Administration Regulations (EAR).
Sentinel-1 Intensity Analysis in ENVI SARscape Tutorial

Since the backscattered signal is a combination of two variables, that signal must be
represented as a complex number for the purposes of creating a digital image. Thus, in an
unprocessed radar image, each pixel represents a complex value that contains amplitude and
phase information about the microwave field backscattered by all the scattering objects within
the radar beam. The amplitude/magnitude is the real part of the complex value, while the
phase is the imaginary part. Phase is more difficult for us to visualize, so that is why it is
represented as the imaginary part.
The Sentinel-1 data used in this tutorial were acquired in Interferometric Wide swath (IW)
mode. This is the primary acquisition mode over land, and it is the most frequently used mode
for Sentinel-1 applications. See the Interferometric Wide Swath topic in the Sentinel-1 SAR
User Guide for details.
For more detailed information about the physical processes involved with radar remote
sensing, consult the references at the end of the tutorial.
In the next section, you will explore some of the tools available in ENVI SARscape for working
with Sentinel-1 data.

Working with Sentinel-1 Data in ENVI SARscape
ENVI SARscape provides many different tools for importing and processing various radar
formats. The SARscape folder in the ENVI Toolbox contains all of the available tools for the
SARscape modules you have installed and licensed. Also included are options for setting
preferences, performing administrative tasks, and reading the ENVI SARscape documentation
provided by sarmap SA.

                                                   Page 6 of 32
                         © 1988-2021 Harris Geospatial Solutions, Inc. All Rights Reserved.
 This information is not subject to the controls of the International Traffic in Arms Regulations (ITAR) or the Export
                                          Administration Regulations (EAR).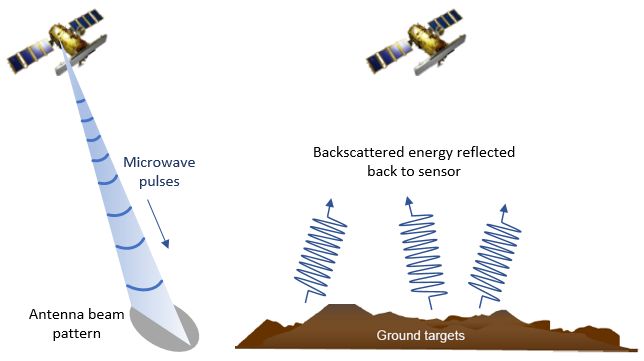
Sentinel-1 Intensity Analysis in ENVI SARscape Tutorial

Given the large number of tools that are provided, knowing where to begin with Sentinel-1
data processing can be a challenge. This tutorial describes one specific workflow: preparing
Sentinel-1 data for backscatter intensity analysis. The workflow involves the following steps:
   n   Setting preferences
   n   Downloading and importing data within ENVI
   n   Performing basic processing steps such as multilooking, subsetting, spatial filtering, and
       geocoding
   n   Creating a color composite of processed bands

Set ENVI Preferences
  1. Start ENVI.
  2. From the ENVI main menu bar, select File > Preferences.
  3. Click the Directories item on the left side of the Preferences dialog.
  4. Click inside the Input Directory field, then click the > button that appears. The
     Browse for Folder dialog appears.
  5. Navigate to the SARGettingStarted directory and click OK. You created this directory
     earlier in the Files Used in This Tutorial section.
  6. Click the > button next to Output Directory.

                                                   Page 7 of 32
                         © 1988-2021 Harris Geospatial Solutions, Inc. All Rights Reserved.
 This information is not subject to the controls of the International Traffic in Arms Regulations (ITAR) or the Export
                                          Administration Regulations (EAR).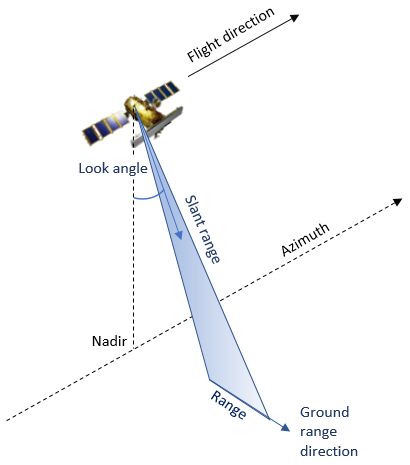
Sentinel-1 Intensity Analysis in ENVI SARscape Tutorial

  7. Select the SARGettingStarted directory and click OK.
  8. Click the > button next to Temporary Directory.
  9. Navigate to the SARGettingStarted\TempFiles folder. Click OK in the Browse for
     Folder dialog.
 10. Click OK in the Preferences dialog.

Set SARscape Preferences
  1. In the ENVI Toolbox, select SARscape > Preferences > Preferences common. The
     Preferences [General] dialog appears.
  2. Select the Directories and batch file name item on the left side.
  3. Click inside the Working directory preference field, then click the > button. The
     Browse for Folder dialog appears.
  4. Select the SARGettingStarted\TempFiles directory. Log files and trace files from
     SARscape processes will be saved to this directory.
      Tip: You do not need to set the Sentinel-1 auxiliary directory preference for this tutorial. You would
      normally set this preference to a directory that contains precise or restituted orbit files, which are
      used for interferometry.

  5. Click Ok in the Preferences [General] dialog.
  6. In the ENVI Toolbox, double-click Preferences specific.
  7. Click the Load Preferences button in the Preferences dialog and select Sentinel
     TOPSAR.
  8. When prompted to load the Sentinel TOPSAR preferences, click Yes.
  9. Click Ok in the Preferences [Sentinel TOPSAR] dialog.

                                                   Page 8 of 32
                         © 1988-2021 Harris Geospatial Solutions, Inc. All Rights Reserved.
 This information is not subject to the controls of the International Traffic in Arms Regulations (ITAR) or the Export
                                          Administration Regulations (EAR).
Sentinel-1 Intensity Analysis in ENVI SARscape Tutorial
Tip: Be sure to set the specific preferences each time you start ENVI. This will automatically set the
processing parameters that are optimized for the dataset with which you are working. You may still change
these in your workflows at any time, but these are good places to start.
Download and Import Sentinel-1 Scenes
This section provides general steps for choosing, downloading, and importing Sentinel-1 data
into SARscape.
Choose Sentinel-1 Scenes
Here are some things to consider when choosing Sentinel-1 scenes:
When you search and order Sentinel-1 Level-1 data from the Copernicus Sentinel Open Access
Hub or other data portal, you can download Single Look Complex (SLC), Ground Range
Detected (GRD), or Ocean (OCN) data. An SLC dataset contain both amplitude and phase,
recorded as complex numbers. Both are needed if you will be creating coherence images or
doing interferometry. An SLC dataset provides the highest possible spatial resolution.
If you are only interested in amplitude (pixel intensity) and will not be doing interferometry,
you can download GRD data as long as the spatial resolution is sufficient for your needs. GRD
data is already preprocessed to ground range but still needs to be geocoded. The primary
advantage of GRD data is a much smaller compressed file size (approximately 1.5 GB)
compared to SLC data (7 to 9 GB). However, GRD data may not be available in the same high
resolution as SLC data.
If you will be using multiple scenes for change detection or interferometry, the scenes must
be in the same orbital direction (ascending or descending), and from the same relative orbit.
Download Sentinel-1 Scenes
Depending on your internet connection, downloading a full Sentinel-1 Level-1A SLC dataset
can take several minutes to several hours.
You do not need to download any data for this tutorial; however, instructions are provided for
downloading Sentinel-1 data on your own at a later time. To skip these steps and continue
with the interactive part of the tutorial, go to the Open and Display Intensity Images section.
You can search and order Sentinel-1 data from the following sources:
n Copernicus Sentinel Open Access Hub
n Alaska SAR Facility
You must register for a free account for these sites if you have not done so already.
Page 9 of 32
© 1988-2021 Harris Geospatial Solutions, Inc. All Rights Reserved.
This information is not subject to the controls of the International Traffic in Arms Regulations (ITAR) or the Export
Administration Regulations (EAR).Sentinel-1 Intensity Analysis in ENVI SARscape Tutorial
Another option is to use the SARscape Sentinel Download tool in the ENVI Toolbox. This is a
convenient option, especially for downloading multiple scenes. The following steps describe
this process:
1. In the ENVI Toolbox, select SARscape > Import Data > Sentinel Download. The
Sentinel Data Download dialog appears.
2. Define the geographic location you are interested in. All full Sentinel-1 scenes that
intersect the specified geographic extent will be downloaded. This step does not define
any spatial subsets for downloading. The options for defining a geographic extent are as
follows:
n Click the Optional Files tab. Here, you can select a shapefile that defines the
geographic area you are interested in. All Sentinel-1 scenes that intersect the
footprint of the shapefile will be downloaded.
Tip: You can create a shapefile in ENVI by creating a new vector layer on top of a raster that
is georeferenced to a standard projection. Export the vector to a shapefile on disk.
n Or, click the Parameters tab and enter geographic coordinates (in decimal
degrees) in the WEST, NORTH, EAST, and SOUTH fields.
3. Click the Parameters tab and enter values for the search criteria, especially the
following:
n Acquisition time (From and To)
n Orbit direction: Choose Ascending, Descending, or ALL. If you will be using
multiple scenes for change detection or interferometry, the scenes must be in the
same direction. The ALL option is for dual-pair interferometry (not covered in this
tutorial) to resolve both vertical and horizontal displacement. If only horizontal
displacement is of interest, then the Ascending or Descending options are
sufficient.
n Product Type: Choose from Single Look Complex, Ground Range, or All.
n Acquisition Mode: IW (Interferometric Wide) is suitable for most applications.
n Polarisation Model: Choose from VV+VH, VV, HH+HV, HH, or All.
4. Under the Parameters tab, enter your Copernicus login credentials in the Login-
USERNAME and Login-PASSWORD fields.
5. Under the Parameters tab, set Unzip Files to True.
The following image shows an example:
Page 10 of 32
© 1988-2021 Harris Geospatial Solutions, Inc. All Rights Reserved.
This information is not subject to the controls of the International Traffic in Arms Regulations (ITAR) or the Export
Administration Regulations (EAR).Sentinel-1 Intensity Analysis in ENVI SARscape Tutorial
6. Click the Output Files tab.
7. Choose a directory and filename for the Progress file name. The progress file will
contain a running list of all data files that have been fully downloaded. Its purpose is to
prevent the same file from being downloaded again. If you use the Sentinel Download
tool in the future, you can choose a progress file that you previously created. The tool
will not download any files that have been previously downloaded.
8. In the Unzip files to this directory field, specify a directory where you want to
extract the downloaded files.
9. Click Exec in the Sentinel Data Download dialog. A new command window appears and
reports the progress of the download. You can continue to use ENVI and SARscape tools
during this time.
Page 11 of 32
© 1988-2021 Harris Geospatial Solutions, Inc. All Rights Reserved.
This information is not subject to the controls of the International Traffic in Arms Regulations (ITAR) or the Export
Administration Regulations (EAR).Sentinel-1 Intensity Analysis in ENVI SARscape Tutorial
When download is complete, the files are automatically unzipped to the working directory that
you specified. Using an SLC dataset as an example, the directory containing the data files will
be named S1B_IW_SLC_1SV__*.SAFE. The directory will contain a
manifest.safe file, a PDF report, and the following subdirectories: annotation,
measurement, preview, and support.
Import Sentinel-1 Data into SARscape
After downloading Sentinel-1 data, you must import the data into SARscape.
You do not need to import any data for this tutorial; however, instructions are provided for
future reference. These steps were used to create the intensity image that you will use later
in this tutorial.
1. From the ENVI Toolbox, select SARscape > Import Data > SAR Spaceborne >
Single Sensor > SENTINEL-1. The Import Sentinel-1 dialog appears.
2. Under the Input Files tab, click Browse under Input File List. A Select Input Files
dialog appears.
3. Navigate to your working directory and select the file manifest.safe. Click Open.
4. Optional: Click the Optional Files tab and select a shapefile that defines the
geographic extent of your area of interest. This can significantly reduce processing
time, as only the radar bursts that intersect the shapefile will be imported.
5. Click the Parameters tab.
6. Setting the Make power QL option to True will automatically create a multilooked
intensity image so that you do not have to perform this step separately at a later time.
Multilooking is a process by which the pixels in an SLC dataset are averaged in the
range direction. This is essentially a slant-range to ground-range conversion that
averages adjacent oblong pixels and creates a square pixel from them. As an added
benefit, the averaging also smooths the image and reduces some speckling effects. See
the Multilooking section of the sarmap help for details. You can access the sarmap help
by selecting SARscape > Help in the ENVI Toolbox.
The Make power QL option was set to True to create the intensity image used in this
tutorial. If you want more control over the multilooking parameters, set this option to
False. Then use the Multilooking tool later under SARscape > Basic > Intensity
Processing. You can use the Multilooking tool to set the number of looks used in the
range or azimuth direction, as well as the grid size for the suggested number of looks.
7. Under the Parameters tab, choose a Polarization option. The choices are ALL,
Copolarization only (HH or VV), or Crosspolarization only (HV or VH). If you will
Page 12 of 32
© 1988-2021 Harris Geospatial Solutions, Inc. All Rights Reserved.
This information is not subject to the controls of the International Traffic in Arms Regulations (ITAR) or the Export
Administration Regulations (EAR).Sentinel-1 Intensity Analysis in ENVI SARscape Tutorial
be doing interferometry, the Crosspolarization only option is recommended in order
to reduce processing time, since you should only use cross-polarized data for
interferometric analysis.
8. Under the Parameters tab, setting the Make mosaic same track option to True will
automatically mosaic the radar bursts that were acquired sequentially along the same
track.
9. Click the Output Files tab.
10. Select an output directory and filename for the output files that will be created.
11. Click the Exec button in the Import Sentinel-1 dialog.
When processing is complete, the output files are written to the location you specified in Step
9. Refer to the Import Data – SAR Spaceborne – SENTINEL-1 topic in the sarmap help for
more information about the structure and content of the output files.
Open and Display Intensity Images
In this section, you will explore a Sentinel-1 intensity image that covers a region of Chile in
December of 2017. Follow these steps:
1. From the ENVI main menu bar, select File > Open.
2. Navigate to the SARGettingStarted directory. You created this directory earlier in the
Files Used in This Tutorial section.
3. Navigate to the 2017-12-12-SLC-Power directory and select the file sentinel1_83_
20171212_095750732_IW_SIW1_D_VH_slc_list_pwr. Click Open. An Interferometric
Wide (IW) Single Look Complex (SLC) intensity image appears in the ENVI display.
4. Press the F12 key on your keyboard to view the full extent of the image.
Page 13 of 32
© 1988-2021 Harris Geospatial Solutions, Inc. All Rights Reserved.
This information is not subject to the controls of the International Traffic in Arms Regulations (ITAR) or the Export
Administration Regulations (EAR).Sentinel-1 Intensity Analysis in ENVI SARscape Tutorial
This is a spatial subset of a Sentinel-1 multilooked SLC intensity image. The radar data were
acquired from a descending pass, so the image appears flipped. The bottom of the image
represents a northeastern direction. Later you will use the Geocoding and Radiometric
Calibration tool to georeference the image, which will correct the orientation. The dark region
on the right side of the image is the Pacific Ocean. The image covers a portion of Corcovado
National Park. The lake in the upper-left corner is Lago Yelcho.
The following steps were taken to create this image:
n The Sentinel Data Download tool was used to download Level-1B SLC scenes that
covered an area of interest defined by a shapefile. The selected time coverage was 10
December to 16 December 2017. Only one scene was available, from 12 December.
n The Import Sentinel-1 tool was used to import the scene into ENVI SARscape. The Make
mosaic same track option was set to True, and the Make power QL option was set
to True to apply multilooking. The result was a multilooked intensity image that
covered a large geographic area.
n The Sample Selection SAR Geometry Data tool (which you will use later in this tutorial)
was used to spatially subset the full multilooked image into a smaller image to use for
the tutorial.
Page 14 of 32
© 1988-2021 Harris Geospatial Solutions, Inc. All Rights Reserved.
This information is not subject to the controls of the International Traffic in Arms Regulations (ITAR) or the Export
Administration Regulations (EAR).Sentinel-1 Intensity Analysis in ENVI SARscape Tutorial
The pixel values in this image represent the intensity of the backscatter. Intensity is
amplitude squared. When SLC datasets are processed with multilooking, the resulting
intensity images are called power images, with the characters _pwr appended to the
filenames. Intensity images are useful in change detection. When multiple images are
coregistered to the same geographic location, they can help answer the question, "Did a pixel
get brighter or darker over time?" Intensity images are also used to create coherence images,
which are used in SAR processing for flood mapping and landslides.
Intensity images show how different surface types reflect incoming energy back to the
sensor. For example, smooth bodies of water appear black. They are flat surfaces that reflect
incoming energy away from the sensor—a process known as specular reflection. Bright pixels
indicate areas where a large fraction of the incoming energy is reflected back to the sensor.
This occurs most often with rough surfaces in a process known as diffuse reflection. Bright
pixels can also result from surfaces that are inclined toward the sensor. In urban areas,
buildings often appear very bright because incoming energy is bounced off of them multiple
times—a process known as double bounce. For more information, consult the references at
the end of the tutorial.
Page 15 of 32
© 1988-2021 Harris Geospatial Solutions, Inc. All Rights Reserved.
This information is not subject to the controls of the International Traffic in Arms Regulations (ITAR) or the Export
Administration Regulations (EAR).Sentinel-1 Intensity Analysis in ENVI SARscape Tutorial
Page 16 of 32
© 1988-2021 Harris Geospatial Solutions, Inc. All Rights Reserved.
This information is not subject to the controls of the International Traffic in Arms Regulations (ITAR) or the Export
Administration Regulations (EAR).Sentinel-1 Intensity Analysis in ENVI SARscape Tutorial
The image you are viewing represents cross-polarized intensity (VH). Cross-polarized images
are often better than co-polarized images (VV or HH) in applications such as flood detection.
VV images are more sensitive to changes in the wind-induced surface roughness of water,
which can result in inaccurate change detection over water. To view a co-polarized (VV)
image, follow these steps:
1. Select File > Open from the ENVI main menu bar.
2. Navigate to the SARGettingStarted directory.
3. Select the file sentinel1_83_20171212_095750732_IW_SIW1_D_VV_slc_list_pwr and
click Open. The VV image displays over the VH image in the ENVI display.
4. Toggle between the two images by unchecking and checking the VV layer in the Layer
Manager:
Page 17 of 32
© 1988-2021 Harris Geospatial Solutions, Inc. All Rights Reserved.
This information is not subject to the controls of the International Traffic in Arms Regulations (ITAR) or the Export
Administration Regulations (EAR).Sentinel-1 Intensity Analysis in ENVI SARscape Tutorial
The following images show the differences in intensity between a cross-polarized (VH) image
and co-polarized (VV) image over a large lake. The VV image shows more variation in
intensity within the lake.
To get meaningful scientific results from intensity images—particularly when comparing
multiple images over time—you must do some further processing with the images. The most
critical processing steps include multilooking, coregistration, spatial subsetting, filtering, and
geocoding and radiometric calibration. You will explore some of these processes next.
Process Intensity Images
In this section, you will learn how to:
n Create spatial subsets of the VH and VV intensity images, also called sample selection
n Apply a filter to reduce speckling noise in the VH and VV images
n Georeference the VH and VV images to a standard map projection, also called
geocoding. As part of this step, you will also perform radiometric calibration and
normalization.
Multilooking is typically the first processing step before sample selection; however, the
intensity images used in this tutorial already have already been corrected for multilooking by
setting the Make power QL option to True in the Import Sentinel-1 Data tool. Multilooking is
the process by which SLC image pixels are averaged in the range and/or azimuth direction,
thus converting from slant range resolution to ground range resolution.
Page 18 of 32
© 1988-2021 Harris Geospatial Solutions, Inc. All Rights Reserved.
This information is not subject to the controls of the International Traffic in Arms Regulations (ITAR) or the Export
Administration Regulations (EAR).Sentinel-1 Intensity Analysis in ENVI SARscape Tutorial
Because you are only working with a single image in this tutorial, you will not perform
coregistration. You would need to coregister multiple images if you were doing change
detection or other time-series analysis. Coregistration is typically done after multilooking.
Create Spatial Subsets (Sample Selection)
In this step, you will create spatial subsets from the VH and VV intensity images. The subsets
cover a region around Villa Santa Lucia, Palena Province, Los Lagos Region in Chile. This
community was devastated by a landslide that occurred after heavy rains on 16 December
2017. The images in this tutorial were acquired before the landslide, on 12 December.
Defining a spatial subset allows you to focus analysis on a specific area, while reducing
processing time and output file sizes.
1. In the ENVI Toolbox, select SARscape > General Tools > Sample Selections
> Sample Selection SAR Geometry Data. This tool is used to subset SLC or
intensity (power) data using a shapefile that was drawn on a non-geocoded SAR scene.
The shapefile defines the boundary of the spatial subset. You would use the other tool,
Sample Selection Geographic Data, if you had a shapefile that was derived from a
geocoded scene.
2. In the Sample Selection SAR Geometry Data dialog, click the Browse button under the
Input Files tab.
3. Navigate to the SARGettingStarted\2017-12-12-SLC-Power directory.
4. Use Ctrl-click to select the following files, then click Open:
n sentinel1_83_20171212_095750732_IW_SIW1_D_VH_slc_list_pwr
n sentinel1_83_20171212_095750732_IW_SIW1_D_VV_slc_list_pwr
5. Click the Optional Files tab.
6. Click the File Select button next to Area of Interest.
7. In the SARGettingStarted directory, select the file StudySite.shp. Click Open. This
shapefile defines the spatial subset you will use.
8. Click the Parameters tab.
9. Click SELECT next to the Geographical Region field and select the False option. The
shapefile was derived from the intensity image, and it is not geocoded.
10. Click inside the field next to Use Min and Max Coordinates and select the True
option. This will clip the spatial subset to a rectangular region if the shapefile itself is
not perfectly rectangular.
Page 19 of 32
© 1988-2021 Harris Geospatial Solutions, Inc. All Rights Reserved.
This information is not subject to the controls of the International Traffic in Arms Regulations (ITAR) or the Export
Administration Regulations (EAR).Sentinel-1 Intensity Analysis in ENVI SARscape Tutorial
11. Click the Output Files tab and notice that the output filenames will be appended with _
cut_pwr. They will be saved to the SARGettingStarted directory. You do not need to
change anything here.
12. Click the Exec button in the Sample Selection SAR Geometry Data dialog.
13. When the Completed dialog appears, click OK. The spatial subsets for the VH and
VV images appear in the Layer Manager and the ENVI display.
14. Click the Close button in the Sample Selection SAR Geometry Data dialog.
15. Right-click on the following layers in the Layer Manager and select Remove. These are
the original intensity images:
n sentinel1_83_20171212_095750732_IW_SIW1_D_VH_slc_list_pwr
n sentinel1_83_20171212_095750732_IW_SIW1_D_VV_slc_list_pwr
Only the _cut_pwr images should be listed.
16. Press the F12 key on your keyboard to see the full extent of the subsets.
Page 20 of 32
© 1988-2021 Harris Geospatial Solutions, Inc. All Rights Reserved.
This information is not subject to the controls of the International Traffic in Arms Regulations (ITAR) or the Export
Administration Regulations (EAR).Sentinel-1 Intensity Analysis in ENVI SARscape Tutorial
Apply Image Filtering
In this step, you will apply a spatial filter to the subset intensity images to reduce the
speckled appearance. You will use a mean filter, which replaces each pixel with the mean
value of its surrounding pixels in a 5 x 5 pixel moving window.
1. In the ENVI Toolbox, select SARscape > Basic > Intensity Processing > Filtering
> Single Image Filtering.
2. In the Single Image Filtering dialog, click Browse under the Input Files tab.
3. Use Ctrl-click to select both _cut_pwr images that you created in the previous section.
Click Open.
4. Click the Parameters tab.
5. Click SELECT next to the Filter Method field, then select the Mean option.
6. Leave the other parameters at their default values.
7. Select the Output Files tab and notice that the output filenames will be appended with
_fil to indicate filtering. They will be saved to the SARGettingStarted directory. You
do not need to change anything here.
8. Click the Exec button in the Single Image Filtering dialog.
9. When the Complete dialog appears, click OK. The filtered images appear in the Layer
Manager and ENVI display. Notice their smoother appearance, compared to the original
images.
Page 21 of 32
© 1988-2021 Harris Geospatial Solutions, Inc. All Rights Reserved.
This information is not subject to the controls of the International Traffic in Arms Regulations (ITAR) or the Export
Administration Regulations (EAR).Sentinel-1 Intensity Analysis in ENVI SARscape Tutorial
10. Click the Close button in the Single Image Filtering dialog.
11. In the Layer Manager, right-click on the View layer and select Remove All Layers.
Geocode the Images
In this section, you will perform geometric and radiometric calibration of the filtered intensity
images. These steps are important if you will be comparing multiple intensity images over
time.
Geocoding requires a DEM. You will need to download the DEM data on your own, as we cannot
redistribute certain DEM files. Here are some recommended options:
n SRTM-3 Version 4 DEM: This is the simplest option. You can use ENVI SARscape to
download Shuttle Radar Topography Mission (SRTM)-3 Version 4 DEM data from the
CIAT-CSI website. Note that service may be intermittent. Step 5 in the geocoding /
radiometric calibration instructions below describes how to download this data.
n ASTER Global DEM (GDEM): The ASTER GDEM is available for download from NASA
Earthdata. A free account is required to order and download data from these sites. For
this tutorial, you will need the ASTER GDEM with an entity ID of ASTGDEMV2_
Page 22 of 32
© 1988-2021 Harris Geospatial Solutions, Inc. All Rights Reserved.
This information is not subject to the controls of the International Traffic in Arms Regulations (ITAR) or the Export
Administration Regulations (EAR).Sentinel-1 Intensity Analysis in ENVI SARscape Tutorial
0S44W073. Once you download the ASTER GDEM file, you need to perform some extra
steps to import the data into SARscape:
1. Extract the contents of the compressed file to the SARGettingStarted directory.
2. In the ENVI Toolbox, select SARscape > Import Data > Generic Format >
Tiff. Importing the ASTER GDEM as a TIFF file will force ENVI to create a .sml file
on disk. The .sml file is required for the DEM to be compatible with SARscape.
3. In the Import TIFF dialog, click Browse under the Input Files tab.
4. Select the ASTER GDEM TIFF file and click Open.
5. Click the DEM/Cartographic System tab.
6. From the State drop-down list, select GEO-GLOBAL.
7. Click the Parameters tab.
8. Click SELECT in the Data Units field, and select the DEM option.
9. Click the Exec button in the Import TIFF dialog. The ASTER GDEM is now ready
for use in ENVI SARscape. The filename will be appended with _dem_bil.
10. Click the Close button in the Import TIFF dialog.
Follow these steps to perform geocoding and radiometric calibration:
1. In the ENVI Toolbox, select SARscape > Basic > Intensity Processing
> Geocoding > Geocoding and Radiometric Calibration.
2. In the Geocoding and Radiometric Calibration dialog, click Browse under the Input
Files tab.
3. Use Ctrl-click to select both _fil images you created in the Apply Image Filtering
section. Click Open.
4. Click the DEM/Cartographic System tab.
5. Select a DEM file. Choose one of the following options:
n To download SRTM-3 Version 4 DEM data, click the Download DEM button .
Select the SRTM-3 Version 4 option, then click the OK button . When the DEM
Extraction - SRTM3 Version 4 dialog appears, click the DEM/Cartographic
System tab. From the State drop-down list, select GEO-GLOBAL. Click the Exec
button. SARscape will search for DEM tiles that match the location of the filtered
intensity images. It will mosaic the tiles if multiple tiles are found.
Page 23 of 32
© 1988-2021 Harris Geospatial Solutions, Inc. All Rights Reserved.
This information is not subject to the controls of the International Traffic in Arms Regulations (ITAR) or the Export
Administration Regulations (EAR).Sentinel-1 Intensity Analysis in ENVI SARscape Tutorial
n If you downloaded an ASTER GDEM, click the Open button . In the Select DEM
File dialog, navigate to the location where you saved the DEM. Change the File
name filter to *.*. Select the _dem_bil file, then click Open.
6. In the Geocoding and Radiometric Calibration dialog, click the Parameters tab.
7. Accept all of the default values. (You can optionally change the Output type to dB, if
desired.)
8. Click the Output Files tab, and notice that the output filenames will be appended with _
geo. The files will be saved to the SARGettingStarted directory. You do not need to
change anything here.
9. Click the Exec button.
10. When the Completed dialog appears, click OK. ENVI creates a raster series with the
geocoded VH and VV images. It displays the VH image.
11. Press the F12 key on your keyboard to view the full extent of the geocoded and
calibrated VH image.
12. Click the Close button in the Geocoding and Radiometric Calibration dialog.
Page 24 of 32
© 1988-2021 Harris Geospatial Solutions, Inc. All Rights Reserved.
This information is not subject to the controls of the International Traffic in Arms Regulations (ITAR) or the Export
Administration Regulations (EAR).Sentinel-1 Intensity Analysis in ENVI SARscape Tutorial
The following image shows an example of a geocoded VH image created using an
ASTER GDEM.
13. Right-click in the middle segment of the Status bar and select Raster Data Values.
The Status bar is located at the bottom of the ENVI application. It is divided into three
segments.
14. Move the cursor over the image. The "Data" line in the Status bar reports the pixel data
values (in units of intensity or decibels); for example:
Page 25 of 32
© 1988-2021 Harris Geospatial Solutions, Inc. All Rights Reserved.
This information is not subject to the controls of the International Traffic in Arms Regulations (ITAR) or the Export
Administration Regulations (EAR).Sentinel-1 Intensity Analysis in ENVI SARscape Tutorial
Also notice that the left segment of the Status bar reports the geographic latitude and
longitude coordinates as you move around the image.
ENVI creates a raster series (also called a time series) of the geocoded VH and VV
images. The raster series is indicated by a icon in the Layer Manager. This raster
series is not helpful at the moment, as it only contains two images. You will display a
different dataset in the following steps.
15. Right-click the raster series layer in the Layer Manager, and select Remove.
16. Click the Data Manager button in the ENVI toolbar. The Data Manager lists two
separate entries for the geocoded dataset. The first dataset is the raster series as
indicated by _geo_db_series in the filename. The second dataset is a metaspectral
dataset (also called a band stack) of the geocoded VH and VV images. The filename for
the metaspectral dataset is appended with _geo_db_meta. This dataset is highlighted in
the following figure:
Page 26 of 32
© 1988-2021 Harris Geospatial Solutions, Inc. All Rights Reserved.
This information is not subject to the controls of the International Traffic in Arms Regulations (ITAR) or the Export
Administration Regulations (EAR).Sentinel-1 Intensity Analysis in ENVI SARscape Tutorial
17. In the Layer Manager, click the + icon next to the sentinel1_83*_geo_db_meta
layer. This expands the layer so that you can tell what image is currently displayed in
the view. It shows that the Meta 1 layer (the geocoded VH band) is currently displayed.
18. In the Data Manager, select the Meta 2 (Band 1...) band, then click the Load
Grayscale button. Now the VV image is displayed in the view.
19. Uncheck and check the VV layer in the Layer Manager to toggle between it and the VH
image.
Create a Color Composite
A common task in SAR analysis is to create a color composite image from different
polarizations. This can help to visually distinguish between different surface features such as
mountains, cities, and water bodies. In this section, you will create a color composite of the
geocoded metaspectral dataset using the following polarization combinations:
n Red: VV
n Green: VH
n Blue: VV/VH ratio
First, create a band ratio of the VV and VH images:
1. In the ENVI Toolbox, select Band Algebra > Band Ratios.
2. In the Band Ratio Input Bands dialog, select the Meta 2 band. The Numerator field is
populated with the name of the VV image.
3. Select the Meta 1 band. The Denominator field is populated with the name of the VH
image.
Page 27 of 32
© 1988-2021 Harris Geospatial Solutions, Inc. All Rights Reserved.
This information is not subject to the controls of the International Traffic in Arms Regulations (ITAR) or the Export
Administration Regulations (EAR).Sentinel-1 Intensity Analysis in ENVI SARscape Tutorial
4. Click the Enter Pair button. The VV/VH ratio is added to the Selected Ratio Pairs
section.
5. Click OK.
6. In the Band Ratios Parameters dialog, select to output the result to Memory.
7. Click OK. When processing is complete, the VV/VH ratio image appears in the display.
8. In the Data Manager, click to expand the Band Selection area. The red box is currently
selected.
9. Select the Meta 2 band. This populates the red box with the geocoded VV band.
Page 28 of 32
© 1988-2021 Harris Geospatial Solutions, Inc. All Rights Reserved.
This information is not subject to the controls of the International Traffic in Arms Regulations (ITAR) or the Export
Administration Regulations (EAR).Sentinel-1 Intensity Analysis in ENVI SARscape Tutorial
10. Select the Meta 1 band. This populates the green box with the geocoded VH band.
11. Select the Ratio band. This populates the blue box with the geocoded VV/VH band.
12. Click the Load Data button. The color composite appears in the display.
The different colors, especially yellow and red, highlight variations in topography.
13. From the ENVI menu bar, select Views > Reference Map Link. A separate dialog
appears with a map view that shows the geographic location of the image (indicated by
a cyan-colored box).
Page 29 of 32
© 1988-2021 Harris Geospatial Solutions, Inc. All Rights Reserved.
This information is not subject to the controls of the International Traffic in Arms Regulations (ITAR) or the Export
Administration Regulations (EAR).Sentinel-1 Intensity Analysis in ENVI SARscape Tutorial
14. Use the Zoom tools in ENVI to zoom in and out of the image. The Reference Map Link
dialog updates to show the geographic location of the view extent.
15. When you are finished viewing the color composite image, click the Close All Files
button in the Data Manager.
16. Close the Data Manager.
This concludes the tutorial.
Using the ENVI Modeler for Batch Processing
So far, you have completed several processing steps using a single image. What if you have
multiple input images to process, for example, with change detection or interferometry? An
efficient way to batch-process multiple images in ENVI SARscape is to use the ENVI Modeler.
The ENVI Modeler is a visual programming tool that leverages ENVI's powerful analytics wtih
a simple user interface. It allows you to create custom workflows using different inputs and
parameters. With the release of ENVI SARscape version 5.5, most SARscape analytics are
available to use with the ENVI Modeler.
References
Closson, D., editor. Land Applications of Radar Remote Sensing. IntechOpen (2014), 307 pp.
Page 30 of 32
© 1988-2021 Harris Geospatial Solutions, Inc. All Rights Reserved.
This information is not subject to the controls of the International Traffic in Arms Regulations (ITAR) or the Export
Administration Regulations (EAR).Sentinel-1 Intensity Analysis in ENVI SARscape Tutorial
Committee on Earth Observation Satellites (CEOS). "A Layman’s Interpretation Guide to L-
band and C-band Synthetic Aperture Radar Data." Version 2.0 (2018). Available online at
http://ceos.org/ard/files/Laymans_SAR_Interpretation_Guide_2.0.pdf.
Davies, R. "Chile – Heavy Rain Causes Deadly Landslide in Los Lagos Region." FloodList.com.
http://floodlist.com/america/chile-landslide-los-lagos-region-december-2017, accessed
January 2019.
European Space Administration (ESA). "Sentinel-1 SAR User Guide." Available online at
https://sentinel.esa.int/web/sentinel/user-guides/sentinel-1-sar.
Jarvis, A., H. Reuter, A. Nelson, and E. Guevara. "Hole-filled Seamless SRTM Data V4."
International Centre for Tropical Agriculture (2008). Available online at
http://srtm.csi.cgiar.org.
Massonnet, D., and J.-C. Souyris. Imaging with Synthetic Aperture Radar. EPFL Press (2008),
250 pp.
NASA/METI/AIST/Japan Spacesystems, and U.S./Japan ASTER Science Team. ASTER Global
Digital Elevation Model (2009). Distributed by NASA EOSDIS Land Processes DAAC,
https://doi.org/10.5067/ASTER/ASTGTM.002.
Page 31 of 32
© 1988-2021 Harris Geospatial Solutions, Inc. All Rights Reserved.
This information is not subject to the controls of the International Traffic in Arms Regulations (ITAR) or the Export
Administration Regulations (EAR).You can also read