SO2- D2.5.2.1 - AESI Case Definition Companion Guide for 1st Tier AESI Guillain Barré and Miller Fisher Syndromes - AESI Case Definition Companion ...
←
→
Page content transcription
If your browser does not render page correctly, please read the page content below
Safety Platform for Emergency vACcines

SO2- D2.5.2.1 - AESI Case Definition Companion
            Guide for 1st Tier AESI

     Guillain Barré and Miller Fisher Syndromes

Work Package: WP2 Standards and tools
V1.0 – February 9th, 2021
Authors: Barbara Law
Nature: Report | Diss. level: Public
V1.0. 09-Feb-2020 | Diss. level: Public

TABLE OF CONTENTS
DOCUMENT INFORMATION……………………………………………………………………………………………………………………..2
DOCUMENT HISTORY……………………………………………………………………………………………………………………………….3
DEFINITIONS & ACRONYMS………………………………………………………………………………………………………………………4
1.      BACKGROUND……………………………………………………………………………………………………………………………………….5
2.      OBJECTIVES OF THIS DELIVERABLE…...…………………………………………………………………..………………………………..6
3.      METHODS…………………………………………………………………………………………………………………………………………….6
4.      RESULTS……………………………………………………………………………………………………………………………………………… 6
5.      RECOMMENDATIONS & DISCUSSION………………………………………………………………………………………………………… 6
6.      REFERENCES………………………………………………………………………………………………………………………………………… 7

APPENDIXES

APPENDIX 1. GBS RISK FACTORS ..……………………………………………………………………………………………………….……….… 12
APPENDIX 2. GBS BACKGROUND RATES .………………………………………………………………………………………………………… 14
APPENDIX 3. GBS CASE DEFINITION KEY CAVEATS FOR DIAGNOSIS, DATA ANALYSIS AND PRESENTATION …………………..….23
APPENDIX 4. GBS DIAGNOSTIC CODES: ICD-9/10-CM AND MEDDRA ……………..…………………………………………..……..25
APPENDIX 5. GBS DATA ABSTRACTION AND INTERPRETATION FORM FOR MEDICAL CHART REVIEW …………………….….……26
APPENDIX 6. GBS TABULAR CHECKLIST FOR KEY CASE DEFINITION CRITERIA AND LEVEL OF CERTAINTY ALGORITHM…….…..33
APPENDIX 7. GBS PICTORIAL LEVEL OF CERTAINTY ALGORITHM ……………………………………………………………………………..35
APPENDIX 8. METHODOLOGY: BRIEF SUMMARY ………………………………………………………………………………………………….36

                                                          THIS PROJECT HAS BEEN FUNDED IN WHOLE BY CEPI.   1
V1.0. 09-Feb-2020 | Diss. level: Public
DOCUMENT INFORMATION
Master Service Agreement Service order SO2
Project acronym SPEAC Full project title Safety Platform for Emergency Vaccines
CEPI Project Lead Nadia Tornieporth / Jakob Cramer
CEPI Project Manager Brett Barnett
CEPI Contract Manager Nishat Miah
Deliverable number SO2 D2.5.2.1 Title Transform Tier 1 AESI Tools
Work package number WP2 Title Standards and tools
Delivery date Actual date February 9th
Changes on due date ☑
Status Draft ☐ Final ☑ Old due date Version 1.0
Nature Report ☑ Toolbox ☐ List ☐ Template ☐ Guidance ☐ Handbook ☐ Questionnaire ☐
Dissemination
Public ☑ Confidential ☐
Level
SPEAC Project Lead Robert Chen E-mail: robert.chen@cepi.net
Scientific Coordinator Miriam Sturkenboom E-mail: miriam.sturkenboom@cepi.net
Reviewer 1 Cornelia L. Dekker E-mail: corry.dekker@cepi.net
Reviewer 2 Miriam Sturkenboom E-mail: miriam.sturkenboom@cepi.net
Main Author(s) Barbara Law E-mail: barbara.law@cepi.net
WP Leader Barbara Law E-mail: barbara.law@cepi.net
This deliverable collates into a single document the SPEAC Guillain Barré Syndrome and Miller
Fisher Syndrome resources (risk factors, background rates, ICD9/10-CM & MedDRA codes),
Description tools (data abstraction & interpretation form, tabular summary of key case definition criteria
of the and algorithm for level of certainty determination, pictorial level of certainty algorithm) and
deliverable guidance (real time investigation, data collection, analysis and presentation). This guide can
be used by stakeholders to assess the occurrence of GBS in several settings including as an
adverse event following immunization.
Guillain Barré Syndrome, GBS, Miller Fisher Syndrome, Brighton case definition, risk factors,
Key words
background rates, ICD-9-CM, ICD-10-CM, MedDRA, case definition level of certainty.
THIS PROJECT HAS BEEN FUNDED IN WHOLE BY CEPI. 2V1.0. 09-Feb-2020 | Diss. level: Public
DOCUMENT HISTORY
NAME OF DOCUMENT DATE VERSION CONTRIBUTOR(S) DESCRIPTION
SO2-D2.5.2.1 Transform Tier 1 18 January Barbara Law, Marta
V0.1 First draft
AESI Tools 2021 Rojo Villaescusa
SO2-D2.5.2.1 Transform Tier 1 29 January
V0.1 Corry Dekker Review
AESI Tools 2021
SO2-D2.5.2.1 Transform Tier 1 31 January
V0.1 Miriam Sturkenboom Review
AESI Tools 2021
SO2-D2.5.2.1 Transform Tier 1 09 February
V1.0 Barbara Law Final version
AESI Tools 2021
THIS PROJECT HAS BEEN FUNDED IN WHOLE BY CEPI. 3V1.0. 09-Feb-2020 | Diss. level: Public
DEFINITIONS & ACRONYMS
AESI Adverse Events of Special Interest
AIDP Acute inflammatory demyelinating polyneuropathy
AMAN Acute motor axonal neuropathy
AMSAN Acute motor and sensory axonal neuropathy
ADEM Acute Disseminated Encephalomyelitis
BC Brighton Collaboration
CD Case Definition
CEPI Coalition for Epidemic Preparedness and Innovation
CIDP Chronic inflammatory demyelinating polyneuropathy
CM Clinical Modification (relates to numbered versions of ICD codes)
CMV Cytomegalovirus
CSF Cerebrospinal Fluid
CT Computed Tomography
CUI Concept Unique Identifier
EBV Epstein Barr Virus
EEG Electroencephalogram
EMG Electromyelogram
GBS Guillain Barré Syndrome
HIV Human Immunodeficiency Virus
ICD International Classification of Diseases
LOC Level of certainty
LP Lumbar Pucture
MedDRA Medical Dictionary for Regulatory Activities
MF Miller Fisher Syndrome
MRI Magnetic Resonance Imaging
NCS Nerve Conduction Sstudies
RBC Red Blood Cell
SPEAC Safety Platform for Emergency Vaccines
UMLS Unified Medical Language System
VAAP Vaccine Associated Paralytic Poliomyelitis
WBC White Blood Cell
THIS PROJECT HAS BEEN FUNDED IN WHOLE BY CEPI. 4V1.0. 09-Feb-2020 | Diss. level: Public
1. Background
CEPI has contracted with the Brighton Collaboration, through the Task Force for Global Health, to harmonize the safety
assessment of CEPI-funded vaccines via its Safety Platform for Emergency vACcines (SPEAC) Project.
A key aspect of this harmonization has been creation of lists of priority potential adverse events of special interest (AESI)
that are relevant to vaccines targeting CEPI target diseases.
SPEAC Work Package 2 is creating resources and tools for the AESI including:
1. Tabular summaries of risk factors and background rates for each AESI.
2. Guidance on AESI real time investigation, data collection, analysis and presentation.
3. Spreadsheet summaries of ICD9/10 and MedDRA codes for each AESI.
4. Tools to facilitate capturing the specific clinical data needed to meet BC AESI case definitions across a variety of
settings applicable to clinical trials, epidemiologic studies and individual case causality assessment. These include:
a. Data abstraction and interpretation forms to facilitate capturing data from medical charts and applying it
to determine a given AESI case definition level of certainty.
b. Tabular checklists that are a stand-alone tool useful for summarizing key clinical data needed to determine
the level of diagnostic certainty for a given case definition.
c. Tabular logic and pictorial decision tree algorithms, also stand-alone tools, to facilitate correct application
of key clinical data to determine the level of diagnostic certainty for each AESI.
d. Glossary of terms relevant to anaphylaxis and the neurologic AESI.
To guide timelines for the activities above, the AESIs have been prioritized into 4 tiers as shown in the Table below (process
described in SO1-D2.0 Addendum to SO1-D2.2 & 2.3 Landscape Analyses Priority Tiers for All CEPI Vaccine Development
AESI). This is available in the Developers Toolbox and on the Brighton Collaboration website.
TABLE 1. AESI PRIORITIZED BY TIER
Tier 1 Tier 2 Tier 3 Tier 4
Vaccine associated Acute/Chronic
Anaphylaxis Sensorineural hearing loss
enhanced disease inflammatory rheumatism
Acute respiratory distress
Thrombocytopenia Anosmia/ageusia Total/partial loss of vision
syndrome
Generalized convulsion Acute cardiovascular injury Chilblain like lesions Optic neuritis
Aseptic meningitis Coagulation disorder Erythema multiforme Alopecia
Encephalitis Acute kidney injury Acute aseptic arthritis Neonatal sepsis
Single organ cutaneous
Myelitis Acute liver injury Neonatal encephalopathy
vasculitis
Acute disseminated Neonatal neuro-
Stillbirth Maternal death
encephalomyelitis developmental delay
Guillain Barré & Miller Spontaneous abortion and
Neonatal death
Fisher Syndromes ectopic pregnancy
Pathways to Preterm birth
Peripheral facial nerve palsy
& Preterm birth
THIS PROJECT HAS BEEN FUNDED IN WHOLE BY CEPI. 5V1.0. 09-Feb-2020 | Diss. level: Public
To simplify access to AESI specific tools and resources, companion guides to the Brighton AESI case definitions are being
prepared for each AESI. This deliverable focuses on Guillain Barré Syndrome and Miller Fisher Syndrome hereinafter
referred to simply as GBS and MF.
2. Objective of this deliverable
To collate SPEAC & BC tools, resources and guidance that have been developed for GBS.
3. Methods
The methods for developing each of the tools included in this guide were detailed in previously completed SPEAC
deliverables as follows:
• GBS risk factors and background rates and risk factors: SO1-D2.4 Tier 1 AESI: Risk Factors and Background Rates.
• GBS Case Definition key caveats for diagnosis, data analysis and presentation: SO1-D2.7 Guidance for CEPI
Developers
• GBS Diagnostic Codes: SO2-D2.3 Tier 1 AESI: ICD-9/10-CM and MedDRA Codes
• GBS Data Abstraction, Tabular Checklist and Level of Certainty Algorithms: SO2-D2.5.1.1-Tools for Tier 1 AESI Data
Collection and Interpretation.
The methods are briefly described in Appendix 8 of this Guide along with links to source documents which have more
detailed methodology.
4. Results
The outputs are provided as separate appendices to simplify printing as needed. These are provided as shown below.
1. GBS Risk Factors
2. GBS Background Rates
3. GBS Case Definition key caveats for diagnosis, data analysis and presentation
4. GBS Diagnostic Codes: ICD-9CM, ICD-10CM, MedDRA
5. GBS Data Abstraction and Interpretation Form for Medical Chart Review
6. GBS Tabular Checklist for key case definition criteria and level of certainty algorithm
7. GBS Pictorial Level of Certainty Algorithm
8. Summary of methods. Also provides links, as appropriate, to the original deliverable documents with more
detailed methodology.
5. Recommendations & discussion
This guide brings together resources and tools related to the AESI of GBS including risk factors, background rates,
guidance for real time investigation, ICD-9/10-CM and MedDRA codes for data entry or database searching and
provides tools for collecting and interpreting clinical data to apply the Brighton GBS case definition and determine
the level of diagnostic certainty.
The choice of tabular or pictorial algorithm is up to the user in terms of what is best suited to the situation and the
assessor. SPEAC recommends that the tools be used in order to assign level of certainty for all identified AEFI with
THIS PROJECT HAS BEEN FUNDED IN WHOLE BY CEPI. 6V1.0. 09-Feb-2020 | Diss. level: Public
features of GBS. This standard, harmonized approach will facilitate signal detection and assessment as well as the
capacity to combine data across trials for meta-analyses.
6. References
1. Sejvar JJ, Kohl KS, Gidudu J et al. Guillain-Barré Syndrome and Fisher syndrome: Case definitions and guidelines for
collection, analysis and presentation of immunization safety data. Vaccine 2011; 29:599-612 Doi:
10.1016/j.vaccine.2010.06.003
2. Esposito S, Longo MR. Guillain Barré syndrome. Autoimmunity reviews 2017; 16:96-101.
http://dx.doi.org/10.1016/j.autrev.2016.09.022
3. Willison HJ, Jacobs BC, van Doorn PA. Guillain-Barré Syndrome. Lancet 2016; 388:717-27.
http://dx.doi.org/10.1016/S0140-6736(16)00339-1
4. Sejvar JJ, Baughman AL, Wise M, Morgan OW. Population incidence of GBS: a systematic review and meta-analysis.
Neuroepidemiology 2011; 36:123-33.
5. Yuki N, Hartung HP. Guillain-Barré Syndrome. NEJM 2012; 366:2294-304.
6. McGrogan A, Madle GC, Seaman HE, de Vries CS. The epidemiology of GBS worldwide. A systematic literature review.
Neuroepidemiology 2008 Dec 17; 32(2): 150-63
7. Haber P, Sejvar J, Mikaeloff Y, DeStefano F. Vaccines and Guillain-Barré Syndrome. Drug Safety 2009; 32(4): 309-323.
8. Stowe J, Andrews N, Wise L, Miller E. Investigation of the temporal association of GBS with influenza vaccine and
influenzalike illness using the United Kingdom General Practice Research Database. AmJEpidemiology 2008; 169(3):
382-388. https://doi.org/10.1093/aje/kwn310
9. IOM (Institute of Medicine). 2011. Adverse effects of vaccines: Evidence and Causality. Washington, DC: The national
Academies Press.
10. Dodd CN, Romio SA, Black S et al. International collaboration to assess the risk of Guillain Barré Syndrome following
Influenza A (H1N1) 2009 monovalent vaccines. Vaccine 2013; 31:4448-4458.
http://dx.doi.org/10.1016/j.vaccine.2013.06.032
11. Dudley MZ, Halsey NA, Omer SB et al. The state of vaccine safety science: systematic reviews of the evidence. Lancet
ID 2020; published online April 9. https://doi.org/10.1016/S1473-3099(20)30130-4.
12. Rowhani-Rahbar A, Klein NP, Dekker CL et al. Biologically plausible and evidence-based risk intervals in immunization
safety research. Vaccine 2012; 31:271-7.
13. Radhakrishnan K, El-Mangoush MA, Rerryo SE. Descriptive epidemiology of selected neuromuscular disorders in
Benghazi, Libya. Acta Neurol Scand 1987; 75: 95–100.
14. Howlett WP, Vedeler CA, Nyland H, Aarli JA: Guillain-Barré syndrome in northern Tanzania: a comparison of
epidemiologic and clinical findings with western Norway. Acta Neurol Scand 1996; 93: 44–49.
15. Beghi E, Kurland LT, Mulder DW, Wiederholt WC. Guillain-Barré syndrome. Clinicoepidemiologic features and effect of
influenza vaccine. Arch Neurol. 1985; 42:1053–1057
16. Rantala H, Cherry JD, Shields WD, Uhari M: Epidemiology of Guillain-Barré syndrome in children: relationship of oral
polio vaccine administration to occurrence. J Pediatr 1994; 124: 220–223.
17. Alshekhlee A, Hussain Z, Sultan B, Katirji B. Guillain-Barré syndrome: incidence and mortality rates in US hospitals.
Neurology 2008; 70: 1608–1613.
18. Kaplan JE, Poduska PJ, McIntosh GC, Hopkins RS, Ferguson SW, Schonberger LB. Guillain-Barré syndrome in Larimer
County, Colorado: a high incidence area. Neurology 1985; 35: 581–584.
19. Church Potter R, Kaneene JB: A descriptive study of Guillain-Barré syndrome in high and low Campylobacter jejuni
incidence regions of Michigan: 1992–1999. Neuroepidemiology 2003; 22: 245–248.
THIS PROJECT HAS BEEN FUNDED IN WHOLE BY CEPI. 7V1.0. 09-Feb-2020 | Diss. level: Public
20. Koobatian TJ, Birkhead GS, Schramm MM,Vogt RL: The use of hospital discharge data for public health surveillance of
Guillain-Barré syndrome. Ann Neurol 1991; 30: 618– 621.
21. Hoppock KC, Greer GG, Walling AD: The incidence of Guillain-Barré syndrome in a metropolitan county, 1984–1988.
Kans Med 1994; 95: 45–47
22. Riggs JE, Cutmann L, Whited JD: Guillain-Barré syndrome: another immune-mediated disease with a predilection for
young women? W V Med J 1989; 85: 382–383.
23. Salinas JL, Major CG, Pastula DM, Dirlikov E, Styczynski A, Luciano CA, et al. Incidence and clinical characteristics of
Guillain-Barre syndrome before the introduction of Zika virus in Puerto Rico. J Neurol Sci. 2017; 377:102–6.
https://doi.org/10.1016/j.jns.2017.04.006
24. Deceuninck G, Boucher RM, De Wals P, Ouakki M. Epidemiology of Guillain-Barré syndrome in the province of
Quebec. Can J Neurol Sci. 2008; 35:472–475
25. Hauck LJ, White C, Feasby TE, Zochodne DW, Svenson LW, Hill MD: Incidence of Guillain-Barré syndrome in Alberta,
Canada: an administrative data study. J Neurol Neurosurg Psychiatry 2008; 79: 318–320.
26. McLean M, Duclos P, Jacob P, Humphreys P: Incidence of Guillain-Barré syndrome in Ontario and Quebec, 1983–1989,
using hospital services databases. Epidemiology 1994; 5: 443–448.
27. Silveira CMd, Salisbury DM, Quadros CAd. Measles vaccination and Guillain-Barre syndrome. Lancet. 1997;
349(9044):14–6. https://doi.org/10.1177/08830738030180110801
28. Suryapranata FS, Ang CW, Chong LL, Murk JL, Falconi J, Huits RM. Epidemiology of Guillain-Barre Syndrome in Aruba.
Am J Trop Med Hyg. 2016; 94(6):1380–4. https://doi.org/10.4269/ajtmh.15-0070
29. Dias-Tosta E, Kuckelhaus CS. Guillain Barre syndrome in a population less than 15 years old in Brazil. Arq
Neuropsiquiatr. 2002; 60(2 B):367–73. https://doi.org/10.1590/s0004-282x2002000300005
30. Dourado ME, Felix RH, Silva WKAd, Queiroz JW, Jeronimo SMB. Clinical characteristics of Guillain-Barre syndrome in a
tropical country: a Brazilian experience. Acta Neurol Scand. 2012; 125(1):47–53. https://doi.org/10.1111/j.1600-
0404.2011.01503.x
31. Guimaraes Rocha MS, Dozzi Brucki SM, De Siqueira Carvalho AA, Poti Lima UW. Epidemiologic features of Guillain-
Barre syndrome in Sao Paulo, Brazil. Arq Neuropsiquiatr. 2004; 62(1):33–7. https://doi.org/10.1590/s0004-
282x2004000100006
32. Rivera-Lillo G, Torres-Castro R, Burgos PI, Varas-Diaz G, Vera-Uribe R, Puppo H, et al. Incidence of Guillain-Barre
syndrome in Chile: a population-based study. J Peripher Nerv Syst. 2016; 21(4):339–44.
https://doi.org/10.1111/jns.12182
33. van Koningsveld R, Rico R, Gerstenbluth I, Schmitz PI, Ang CW, Merkies IS, et al. Gastroenteritis-associated Guillain-
Barre syndrome on the Caribbean island Curacao. Neurology. 2001; 56(11):1467–72.
https://doi.org/10.1212/wnl.56.11.1467
34. Molinero MR, Varon D, Holden KR, Sladky JT, Molina IB, Cleaves F. Epidemiology of childhood Guillain-Barre syndrome
as a cause of acute flaccid paralysis in Honduras: 1989–1999. J Child Neurol. 2003; 18(11):741–7.
https://doi.org/10.1177/08830738030180110801
35. Balavoine S, Pircher M, Hoen B, Herrmann-Storck C, Najioullah F, Madeux B, et al. Guillain-Barre syndrome and
chikungunya: description of all cases diagnosed during the 2014 outbreak in the French West Indies. Am J Trop Med
Hyg. 2017; 97(2):356–60. https://doi.org/10.4269/ajtmh.15-0753
36. Hart DE, Rojas LA, Rosario JA, Recalde H, Roman GC. Childhood Guillain-Barre syndrome in Paraguay, 1990 to 1991.
Ann Neurol. 1994; 36(6):859–63. https://doi.org/10.1002/ana.410360609
37. Landaverde JM, Danovaro-Holliday MC, Trumbo SP, Pacis-Tirso CL, Ruiz-Matus C. Guillain-Barre´ Syndrome in Children
AgedV1.0. 09-Feb-2020 | Diss. level: Public
39. Cheng Q, Wang DS, Jiang GX, Han H, Zhang Y, Wang WZ, et al. Distinct pattern of age specific incidence of Guillain-
Barré syndrome in Harbin, China. J Neurol 2002; 249: 25–32.
40. Hui AC, Chow KM, Tang AS, Fu M, Kay R, Wong KS. Electrophysiological, clinical and epidemiological study of Guillain-
Barré Syndrome in Hong Kong Chinese. J Clin Neurosci 2005; 12: 134–136.
41. Kusumi M, Nakashima K, Nakayama H, Takahashi K. Epidemiology of inflammatory
neurological and inflammatory neuromuscular diseases in Tottori Prefecture, Japan. Psychiatry Clin Neurosci 1995;
49:169–174.
42. Huang WC, Lu Cl, Chen SCC. A 15-year nationwde epidemiological analysis of Guillain-Barré Syndrome in Taiwan.
Neuroepidemology 2015; 44:249-254. https://doi.org/10.1159/000430917
43. Hung KL, Wang HS, Liou WY, Mak SC, Chi CS, Shen EY, et al: Guillain-Barré syndrome in children: a cooperative study in
Taiwan. Brain Dev 1994; 16: 204–208.
44. D’Souza RM. Retrospective hospital-based searches for cases of acute flaccid paralysis. Australian and New Zealand
Journal of Public Health 2002; 26(1):45-49.
45. Storey E, Cook M, Peppard R, Newton-John H, Byrne E. Guillain-Barré syndrome and related conditions in Victorian
teaching hospitals 1980–1984. Aust NZ J Med 1989; 19:687–693
46. Hankey JG. Guillain-Barré syndrome in Western Australia, 1980–1985. Med J Aust 1987; 146: 130–133
47. Esteghamati A, Gouya MM, Keshtkar AA, Mahoney F. Relationship between occurrence of Guillain-Barre syndrome
and mass campaign of measles and rubella immunization in Iranian 5–14 years old children. Vaccine
2008;26(39):5058–61. 10.1016/j.vaccine.2008.07.014
48. Barzegar M, Dastgiri S, Karegarmaher MH, Varshochiani A: Epidemiology of childhood Guillan-Barré syndrome in the
north west of Iran. BMC Neurology 2007; 7:22.
49. Arami MA, Yazdchi M, Khandaghi R: Epidemiology and characteristics of Guillain-Barré syndrome in the northwest of
Iran. Ann Saudi Med 2006; 26: 22–27.
50. Ismail EA, Shabani IS, Badawi M, Sanaa H, Madi S, Al Tawari A, et al: An epidemiologic, clinical, and therapeutic study
of childhood Guillain-Barré syndrome in Kuwait: is it related to the oral polio vaccine? J Child Neurol 1998; 13: 488–
492.
51. Bak P. Guillain-Barré syndrome in a Danish county. Neurology 1985; 35: 207–211.
52. Halls J, Bredkjaer C, Friis ML: Guillain-Barré syndrome: diagnostic criteria, epidemiology, clinical course and prognosis.
Acta Neurol Scand 1988; 78: 118–122.
53. Winner SJ, Evans JG. Age-specific incidence of Guillain-Barré syndrome in Oxfordshire. Q J Med. 1990; 77:1297–1304.
54. Rees JH, Thompson RD, Smeeton NC, Hughes RA. Epidemiological study of Guillain-Barré syndrome in south east
England. J Neurol Neurosurg Psychiatry. 1998; 64:74–77.
55. Haberman S, Benjamin B, Rose FC, Capildeo R. North west Thames’s registry of neurological disease. J Royal Soc Med
1982; 75: 443–449.
56. Sridharan GV, Tallis RC, Gautam PC: Guillain-Barré syndrome in the elderly: a retrospective comparative study.
Gerontology 1993; 39: 170–175.
57. Hughes RA, Charlton J, Latinovic R, Gulliford MC. No association between immunizationand Guillain-Barré syndrome
in the United Kingdom, 1992 to 2000. Arch Intern Med 2006; 166: 1301–1304.
58. MacDonald BK, Cockerell OC, Sander JWAS, Shorvon SD. The incidence and lifetime prevalence of neurological
disorders in a prospective community-based study in the
UK. Brain 2000; 123: 665–676.
59. Rantala H, Cherry JD, Shields WD, Uhari M: Epidemiology of Guillain-Barré syndrome in children: relationship of oral
polio vaccine administration to occurrence. J Pediatr 1994; 124: 220–223.
60. Kinnunen E, Junttila O, Haukka J, Hovi T. Nationwide oral poliovirus vaccination campaign and the incidence of
Guillain-Barré Syndrome. Am J Epidemiol 1998; 147:69–73.
THIS PROJECT HAS BEEN FUNDED IN WHOLE BY CEPI. 9V1.0. 09-Feb-2020 | Diss. level: Public
61. Lehmann HC, Köhne A, Meyer zu Hörste G, Kieseier BC: Incidence of Guillain-Barré syndrome in Germany. J Peripher
Nerv Syst 2007; 12: 285.
62. Chroni E, Papapetropoulos S, Gioldasis G, Ellul J, Diamadopoulos N, Papapetropoulos T. Guillain-Barré syndrome in
Greece: seasonality and other clinico-epidemiological features. Eur J Neurol 2004;11(6):383–8.
https://doi.org/10.1111/j.1468-1331.2004.00799.x
63. Markoula S, Giannopoulos S, Sarmas I, Tzavidi S, Kyritsis AP, Lagos G: Guillain-Barré syndrome in northwest Greece.
Acta Neurol Scand 2007; 115: 167–173.
64. Govoni V, Granieri E, Manconi M, Capone J, Casetta I. Is there a decrease in Guillain-Barré syndrome incidence after
bovine ganglioside withdrawal in Italy? A population-based study in the Local Health District of Ferrara, Italy. J Neurol
Sci. 2003; 216:99–103 https://doi.org/10.1016/s0022-510x(03)00215-6
65. Guillain-Barré syndrome variants in Emilia-Romagna, Italy, 1992–3: incidence, clinical features, and prognosis. Emilia-
Romagna Study Group on Clinical and Epidemiological Problems in Neurology. J Neurol Neurosurg Psychiatry. 1998;
65:218–224
66. Bogliun G, Beghi E. Incidence and clinical features of acute inflammatory polyradiculoneuropathy in Lombardy, Italy,
1996. Acta Neurol Scand. 2004; 110:100–106.
67. Chio A, Cocito D, Leone M, Giordana MT, Mora G, Mutani R. Piemonte, and Valle d’Aosta Register for Guillain-Barré
Syndrome. Guillain-Barré syndrome: a prospective, population-based incidence and outcome survey. Neurology.
2003; 60:1146–1150
68. Beghi E, Bogliun G: The Guillain-Barré syndrome (GBS): implementation of a register of the disease on a nationwide
basis. Ital J Neurol Sci 1996; 17: 355–361
69. Paolino Z, Govoni V, Tola MR, Casetta I, Granieri E. Incidence of the Guillain-Barré syndrome in Ferrara, Northern Italy,
1981–1987. Neuroepidemiology 1991; 10: 105–111.
70. Congia S, Melis M, Carboni MA. Epidemiologic and clinical features of the Guillain-Barré syndrome in Sardinia in the
1961-1980 period. Acta Neurol 1989; 11:15-20.
71. Van Koningsveld R, Van Doorn PA, Schmitz PI, Ang CW, Van der Meché FG. Mild forms of Guillain-Barré syndrome in
an epidemiologic survey in The Netherlands. Neurology. 2000; 54:620–625.
72. Sedano MJ, Calleja J, Canga E, Berciano J. Guillain-Barré syndrome in Cantabria, Spain. An epidemiological and clinical
study. Acta Neurol Scand. 1994; 89:287–292
73. Cuadrado JI, de Pedro-Cuesta J, Ara JR, Cemillán CA, Díaz M, Duarte J, Fernández MD, Fernández O, García-López F,
García-Merino A, García-Montero R, Martínez-Matos JA, Palomo F, Pardo J, Tobías A. Spanish GBS Epidemiological
Study Group. Guillain-Barré syndrome in Spain, 1985–1997: epidemiological and public health views. Eur Neurol.
2001; 46:83–91.
74. Cuadrado JI, de Pedro-Cuesta J, Ara JR, Cemillán CA, Díaz M, Duarte J, Fernández MD, Fernandez O, García-López F,
García- Merino A, Velasquez JM, Martínez-Matos JA, Palomo F, Pardo J, Tobías A. Spanish GBS Epidemiological Study
Group. Public health surveillance and incidence of adulthood Guillain-Barré syndrome in Spain, 1998– 1999: the view
from a sentinel network of neurologists. Neurol Sci. 2004; 25:57–65.
75. Jiang GX, Cheng Q, Link H, et al. Epidemiological features of Guillain-Barré syndrome in Sweden, 1978–93. J Neurol
Neurosurg Psychiatry 1997; 62:447–53. https://doi.org/10.1136/jnnp.62.5.447
76. Cheng Q, Jiang GX, Fredrikson S, Link H, De Pedro-Cuesta J. Incidence of Guillain-Barré syndrome in Sweden 1996. Eur
J Neurol. 2000; 7:11–16.
77. Jiang GX, Cheng Q, Ehrnst A, Link H, de Pedro-Cuesta J: Guillain-Barré syndrome in Stockholm county, 1973–1991. Eur
J Epidemiol 1997; 13: 25–32
78. Jiang GX, de Pedro-Cuesta J, Fredrikson. Guillain-Barré syndrome in south-west Stockholm, 1973–1991. 1. Quality of
registered hospital diagnoses and incidence. Acta Neurol Scand 1995; 91: 109–117.
79. Willame C, Dodd C, van der Aa L et al. Incidence rates of autoimmune diseases in European Healthcare databases: a
contribution of the ADVANCE project. Drug Safety 2021, Jan 19. https://doi.org/10.1007/s40264-020-01031-1.
THIS PROJECT HAS BEEN FUNDED IN WHOLE BY CEPI. 10V1.0. 09-Feb-2020 | Diss. level: Public
80. Becker BFH, Avillach P, Romio S, van Mulligen EM, Weibel D, Sturkenboom MCJM, Kors J. CodeMapper: Semi-
automatic coding of case definitions. A contribution from the ADVANCE project. Pharmacoepidemiology and
Drug Safety, 2017 (8) 26: 998-1005. Doi:10.1002/pds.4245
81. McCray AT, Burgun A, Bodenreider O. Aggregating UMLS semantic types
for reducing conceptual complexity. Studies Health Technology Information, 2001 84(Pt 1): 216-20. PMID: 11604736;
PMCID: PMC4300099.
82. Rogers F. Medical subject headings. Bull Med Libr Assoc, 1963. 51(1): 114-6. PMID: 13982385; PMCID: PMC197951.
83. Brown EG, Wood L, Wood S. The medical dictionary for regulatory activities (MedDRA). Drug Safety, 1999. 0(2):109-
17. Doi: 10.2165/00002018-199920020-00002.
84. Schuemie MJ, Jelier R, Kors JA. Peregrine: Lightweight gene name normalization by dictionary lookup. In: Proc of the
Second BioCreative Challenge Evaluation Workshop., 2007. 131–133.
THIS PROJECT HAS BEEN FUNDED IN WHOLE BY CEPI. 11V1.0. 09-Feb-2020 | Diss. level: Public
APPENDIX 1.
GBS Risk Factors
1.1. GBS Risk Factors
TABLE 1. GBS RISK FACTORS 1-12
Age • Incidence increases with age (see appendix 2).
• In general males have a higher incidence than females although this varies by age (see
Gender
appendix 2).
• Prevalence of GBS type varies geographically:
o AIDP: up to 90% of cases in North America and Europe versus 22-46% of cases in
China, Japan, Bangladesh, Mexico 1,5
Geography o AMAN/AMSAN: 30-65% of cases in China, Japan, Bangladesh, Mexico; about 5% of
cases in North America and Europe 5
o MF variant: more prevalent in eastern Asia; overall about 5% of all GBS cases but up
to 20% of cases in Taiwan, 25% of cases in Japan 1,5
Comorbidity • Malignancy, especially Hodgkin’s and other lymphomas1
• Antecedent diarrheal or respiratory illness reported in 2/3 of cases 1-5
o Campylobacter jejuni the strongest association, and most notably in Asia, usually
presenting as AMAN or Miller Fisher
Infection
o Influenza, HIV, EBV, CMV, Enterovirus D68, Mycoplasma pneumoniae
o Hepatitis E association noted in Netherlands, Bangladesh
o Zika and Chikungunya infection
• Rabies vaccine cultured in mammalian brain tissues (e.g. Semple vaccine, made using mature
sheep or goat brain or SMB vaccine made in suckling mouse brain) may induce T cells
reactive to myelin basic protein. GBS was observed in about 1 in 7500 SMB vaccinees and
made up about 7% of all hospitalizations following Semple vaccine.1,7
• 1976 pandemic H1N1 swine influenza vaccine was associated with an attributable risk of
about 1 case / 100,000 vaccinated1,7
• A 2008 study using the UK General Practice Research Database found a higher relative
incidence of GBS following influenza-like illness than after influenza vaccine.8
• Institute of Medicine 20119 reviewed evidence for link between MMR, VZV, influenza,
Hepatitis A/B, HPV, D/T/aP, meningococcal vaccines and GBS, and concluded evidence was
Vaccine inadequate to accept or reject a causal relationship.
• A global collaborative study found a relative incidence of GBS of 2.42 (95% CI 1.58–3.72) in
the 42 days following exposure to pH1N1 vaccine with no increased risk following adjuvanted
vaccines.10
• Updated review of evidence published since 2011 IOM report for similar range of vaccines
had similar conclusion to IOM regarding no evidence to accept/reject causality11
• Risk window for GBS as a vaccine product related reaction12
o Inactivated or subunit vaccines –Immune-mediated mechanism for GBS likely similar
to ADEM, where recommended risk window for individuals is 2-42 days: for
epidemiologic studies 5-28 days for primary analysis, and 2-42 days for secondary
analysis.
THIS PROJECT HAS BEEN FUNDED IN WHOLE BY CEPI. 12V1.0. 09-Feb-2020 | Diss. level: Public
o Live attenuated vaccines – this should be based on the incubation period for the
vaccine strain, adding as above, 5-28 days for primary analysis and 2-42 days for
secondary analysis following the end of the incubation period.
Other • Prior surgical procedure – reported following surgery for obesity1
THIS PROJECT HAS BEEN FUNDED IN WHOLE BY CEPI. 13V1.0. 09-Feb-2020 | Diss. level: Public
APPENDIX 2.
GBS Background Rates
2.1 GBS Background Rates 13-79
TABLE 1. GBS BACKGROUND RATES BY GEOGRAPHIC REGION: STUDIES OF ALL AGES OR ADULTS ONLY
Country reference Study Population Incidence rate per 100,000 person years
years (age in [95% confidence interval] (total cases)
years) All Males Females
AFRICA
1983- 0-9 0.3 (2) -- (0) 0.7 (2)
1985 10-19 1.8 (6) 2.3 (4) 1.2 (2)
20-29 3.1 (6) 4.0 (4) 2.1 (2)
30-39 5.9 (9) 3.9 (3) 8.1 (6)
Libya 13
40-49 1.7 (2) 1.6 (1) 1.8 (1)
50-59 1.5 (1) -- (0) 3.1 (1)
≥ 60 1.1 (1) 2.1 (1) -- (0)
All ages 1.73 (27) 1.62 (13) 1.85 (14)
1984- 12-29 0.7 (25)
Tanzania 14
1992 30-49 1.3 (28)
≥ 50 0.5 (6)
≥ 12 0.83 (59)
AMERICAs
≤17 0.81 (8)
USA (Minnesota) 15 18-39 1.34 (13)
1935-
40-59 2.84 (16)
1980
≥60 3.25 (11)
All ages 1.68[1.24-2.23] (48)
1980-
USA (California) 16V1.0. 09-Feb-2020 | Diss. level: Public
1984-
USA (Kansas) 21 10-88 2.2 (43)
1988
0-9 1.3 (10) 1.3 (5) 1.3 (5)
10-19 1.8 (16) 1.5 (7) 2.0 (9)
20-29 2.2 (18) 1.4 (6) 2.9 (12)
30-39 1.7 (14) 1.9 (8) 1.4 (6)
1967-
USA (Virginia) 22 40-49 0.9 (6) 1.2 (4) 0.6 (2)
1987
50-59 2.2 (11) 1.6 (4) 2.8 (7)
60-69 2.4 (11) 3.6 (8) 1.3 (3)
≥70 1.4 (6) 1.4 (3) 1.4 (3)
All ages 1.7 (92) 1.7 (45) 1.7 (47)
Puerto Rico 23 2013 3-82 1.7 (61)
1-4 2.1 [1.2-3.6]
2000-
Canada 24 5-22 0.6 [0.3-0.9]
2002
0.2-22 0.8 [0.56-1.14] (33)
1994-
Canada 25 (Alberta) 1-110 1.6 (496)
2004
Canada 26
1983-
i. Quebec All ages i. 1.51 (1302)
1989
ii. Ontario ii. 1.78 (1031)
1-4 0.86 [0.78-0.89]
Argentina, Brazil, 1990-
5-14 0.52 [0.49-0.53]
Chile&Columbia 27 1994
1-14 0.62 [0.61-0.64] (2296)
2003-
Aruba 28 14-77 3.93 (39)
2011
1990-
Brazil 29V1.0. 09-Feb-2020 | Diss. level: Public
2011 1.76 (14)
2012 1.89 (15)
Martinique &
2013 All ages 1.65 (13)
Guadalupe 35
2014 3.45 (27)
2015 1.93 (15)V1.0. 09-Feb-2020 | Diss. level: Public
All ages 0.59 (441) 0.72 (276) 0.45 (165)
0-9 1.15 (10) 1.34 (6) 0.94 (4)
10-19 0.74 (7) 0.82 (4) 0.65 (3)
20-29 0.61 (7) 0.50 (3) 0.72 (4)
1997- 30-39 0.40 (4) 0.79 (4) -- (0)
China 39 (Harbin)
1998 40-49 0.75 (4) 0.38 (1) 1.10 (3)
50-59 0.44 (2) 0.89 (2) -- (0)
≥ 60 0.50 (2) 0.49 (1) 0.52 (1)
All ages 0.74 [0.46-1.13] (36) 0.74 [0.46-1.13] (21) 0.57 [0.32-0.94] (15)
China 40 1993- >15 0.44 (20)
(Hong Kong) 1998
1988 1.13 (7)
1989 0.97 (6)
1990 1.30 (8)
Japan 41 1991 All ages 1.14 (7)
1992 1.14 (7)
All 1.14 (32)
years
0-9 0.76 0.88 0.63
10-19 0.56 0.62 0.49
20-29 0.92 1.10 0.73
30-39 1.04 1.35 0.73
1997- 40-49 1.36 1.71 1.01
Taiwan 42
2011 50-59 2.12 2.54 1.71
60-69 4.10 4.85 3.39
70-79 6.35 7.71 4.92
≥80 6.34 8.51 4.22
All ages 1.65 (5998) 1.99 29
1986-
Taiwan 43 ≤15 0.66 (72)
1990
AUSTRALIA/OCEANIA
Australia 44
1995-
i.New South Wales 15 0.9 (110)
1984
0-9 1.13 (15)
10-19 0.62 (9)
20-29 1.61 (23)
30-39 1.32 (17)
1980- 40-49 0.68 (6)
Australia 46
1985 50-59 2.07 (15)
60-69 2.60 (14)
70-79 1.77 (6)
80-90 3.30 (4)
All ages 1.35 (109) 1.49 (61) 1.20 (48)
THIS PROJECT HAS BEEN FUNDED IN WHOLE BY CEPI. 17V1.0. 09-Feb-2020 | Diss. level: Public
MIDDLE EAST
2002 0.68 (121)
Iran 47 2003 5-14 0.76 (135)
2004 0.65 (114)
2001 1.49 ([0.8-2.4]
2002 1.95 [1.2-2.9]
2003 3.44 [2.4-4.7]
2004 2.14 [1.3-3.2]
Iran 48 0-15
2005 2.04 [1.2-3.1]
2006 2.57 [1.7-3.7]
All 2.27 [1.9-2.6] (143)
years
< 15 2.28
Iran 49
2003 ≥ 15 2.06
All ages 2.11 (76) 2.5 (45) 1.73 (31)
1992- 0-4 1.15 (10)
Kuwait 50
1997 0-12 0.95 (19)
EUROPE
1965-
Denmark 51 All ages 1.14 (51)
1982
1977-
Denmark 52 20-90 2.0 (34)
1984
0-4 1.3 ()
5-14 0.1 (1)
15-24 0.7 (9)
25-34 1.2 (12)
1974- 35-44 1.0 (8)
England 53
1986 45-54 1.5 (10)
55-64 2.0 (12)
65-74 1.8 (9)
≥ 75 1.9 (6)
All ages 1.1 [0.8-1.4] (72) 1.0[0.6-1.3] (32) 1.2[0.8-1.6] (40)
1993-
England 54 All ages 1.2 [0.9-1.4] (79) 1.1 [0.7-1.4] (35) 1.3 [0.9-1.5] (44)
1994
0-4 0.5 (1)
5-14 0.6 (3)
15-44 1.1 (16)
England & Wales 55 1978 45-64 1.4 (11)
65-74 1.9 (6)
≥ 75 1.1 (2)
All ages 1.1 (39) 1.32 (22) 0.95 (17)
19-60 0.80 [0.46-1.15]
1980-
Scotland 56 61-89 1.62 [0.80-2.43]
1988
≥19 1.1 [0.81-1.40] (56)
THIS PROJECT HAS BEEN FUNDED IN WHOLE BY CEPI. 18V1.0. 09-Feb-2020 | Diss. level: Public
0-14 0.47 [0.19-0.96] (7) 0.42 [0.15-0.92] (6)
15-24 0.63 [0.23-1.38] (6) 1.08 [0.52-1.98] (10)
25-34 0.87 [0.43-1.56] (11) 1.11 [0.61-1.86] (14)
35-44 1.00 [0.52-1.75] (12) 1.29 [0.72-2.13] (15)
1992- 45-54 1.98 [1.24-3.00] (22) 1.21 [0.64-2.06] (13)
UK 57
2000 55-64 3.15 [2.05-4.61] (26) 2.30 [1.39-3.23] (19)
65-74 3.86 [2.50-5.70 {25) 1.86 [1.02-3.13] (14)
75-84 2.85 {1.37-5.25] (10) 2.54 [1.39-4.27] (14)
85-100 2.26 [0.27-8.14] (2) 0.86 [0.10-3.11] (2)
All ages 1.33 [1.15-1.50] (228) 1.45 [1.19-1.72] (121) 1.22 [0.98-1.46] (107)
1995-
UK 58 All ages 3.0 [1.0-6.0]
1996
1980-
Finland 59V1.0. 09-Feb-2020 | Diss. level: Public
1995-
Italy 67 All ages 1.36 [1.13-1.63] (120) 1.78 [1.4-2.24] (74) 1.11[0.81-1.48] (46)
1996
1994-
Italy 68 All ages 0.92 [0.75-1.09] (109)
1995
0-9 0.86 (1)
10-19 -- (0)
20-29 -- (0)
30-39 0.58 (1)
1981-
Italy 69 40-49 3.25 (6)
1987
50-59 0.50 (1)
60-69 3.98 (6)
70-79 0.72 (1)
All ages 1.08 (16) 1.39 (10) 0.81 (6)
1961-
Italy 70 2-75 0.4 (120) 0.41 (62) 0.39 (58)
1980
1987-
Netherlands 71 All ages 1.18[1.08-1.29] (476) 1.42[1.26-1.59] 0.94 [0.82-1.09]
1996
0-9 0.59 (6)
10-19 1.57 (18)
20-29 0.79 (9)
30-39 0.64 (6)
1975-
Spain 72 40-49 1.05 (8)
1988
50-59 1.41 (12)
60-69 1.23 (8)
≥70 0.32 (2)
All ages 0.95 (69) 1.18 (43) 0.71 (26)
20-29 0.50 (45)
30-39 0.61 (48)
40-49 0.67 (46)
1985- 50-59 1.05 (62)
Spain 73
1990 60-69 1.66 (86)
70-79 1.25 (40)
≥80 0.65 (10)
All ages 0.85 (337) 1.14 (218) 0.58 (119)
20-29 0.45 (8) 0.55 (5) 0.34 (3)
30-39 0.64 (10) 1.03 (8) 0.26 (2)
40-49 1.03 (14) 1.19 (8) 0.87 (6)
1998- 50-59 1.72 (20) 2.26 (13) 1.19 (7)
Spain 74
1999 60-69 2.42 (25) 3.89 (19) 1.10 (6)
70-79 2.32 (15) 4.15 (1) 1.05 (4)
≥80 1.91 (6) 2.86 (3) 1.44 (3)
All ages 1.25 (98) 1.77 (67) 0.76 (31)
1978-
Sweden 75 All ages 1.77 (2257) 2.01 1.54
1993
0-9 1.02 (6) 0.99 (3) 2.04 (3)
Sweden 76 1996
1-19 1.21 (6) 1.18 (3) 1.24 (3)
THIS PROJECT HAS BEEN FUNDED IN WHOLE BY CEPI. 20V1.0. 09-Feb-2020 | Diss. level: Public
20-29 1.25 (8) 1.54 (5) 0.94 (3)
30-39 1.24 (8) 1.81 (6) 0.63 (2)
40-49 1.27 (8) 1.57 (5) 0.96 (3)
50-59 0.94 (5) 1.49 (4) 0.38 (1)
60-69 3.10 (12) 5.99 (11) 0.49 (1)
70-79 4.48 (16) 3.89 (6) 4.94 (10)
≥80 1.98 (4) 1.47 (1) 2.24 (3)
All ages 1.63 [1.28-2.05] (73) 2.00 [1.28-2.05] (44) 1.27 [0.85-1.83] (29)
1973-
Sweden 77 All ages 1.84 (556) 2.15 (281) 1.57 (275)
1991
0-9 0.25 (2) 0.49 (2) -- (0)
10-19 1.07 (9) 0.70 (3) 1.45 (6)
20-29 1.35 (12) 1.58 (7) 1.13 (5)
30-39 1.59 (15) 1.26 (6) 1.93 (9)
1973- 40-49 0.78 (6) 1.03 (4) 0.53 (2)
Sweden 78
1991 50-59 3.38 (19) 3.17 (9) 3.59 (10)
60-69 2.49 (11) 4.28 (9) 0.86 (2)
70-79 2.93 (8) 2.65 (3) 3.14 (5)
≥ 80 1.87 (2) -- (0) 2.73 (2)
All ages 1.56 [1.24-1.93] (84) 1.64 [1.19-2.2] (43) 1.46 [1.05-1.99] (41)
European ADVANCE (Accelerated Development of Vaccine benefit-risk Collaboration in Europe) Project 79
0-1 2.86 [2.43-3.37]
2-4 2.71 [2.35-3.13]
5-14 1.79 [1.63-1.97]
All country data 2003-2014 15-24 3.10 [2.90-3.32]
combined 25-44 6.99 [6.79-7.21]
45-64 6.31 [6.11-6.52]
≥65 5.34 [5.11-5.58]
All ages 5.25 [5.15-5.34]
0-1 0.4 [0.17-0.82]
2003-2014 2-4 1.0 p0.68-1.48]
Denmark for all 5-14 0.7 [0.51-0.85]
(Aarhus University 15-24 1.2 [0.99-1.41]
Hospital and Staten 25-44 2.0 [1.83-2.23]
Serum Institute) 45-64 3.4 [3.12-3.66]
≥65 4.6 [4.19-5.00]
All ages 2.4 [2.27-2.49] (1711)
0-1 1.0 [0.47-2.09]
2-4 1.7 [1.03-2.67]
5-14 0.9 [0.64-1.29]
Italy 15-24 1.5 [1.14-1.96]
(Agenzia regionale 25-44 1.7 [1.47-1.94]
di sanità) 45-64 3.1 [2.79-3.43]
≥65 4.5 [4.14-5.00]
All ages 2.6 [2.49-2.80]
(1085)
THIS PROJECT HAS BEEN FUNDED IN WHOLE BY CEPI. 21V1.0. 09-Feb-2020 | Diss. level: Public
Italy 0-1 0.0
(Val Padana) 2-4 0.0
5-14 1.1 [0.42-2.97]
15-24 1.2 [0.45-3.17]
25-44 1.8 [1.14-2.81]
45-64 2.8 [1.99-4.01]
≥65 5.7 [4.32-7.47]
All ages 2.8 [2.30-3.35] (109)
Italy 0-1 -- (0 cases)
(Pedianet) 2-4 1.9 [0.48-7.73]
5-14 -- (0 cases)
All 0-14 0.5 [0.13-2.04] (24)
0-1 0.4 [0.14-1.34]
Spain 2-4 0.5 [0.17-1.20]
(Base de Datos 5-14 0.5 [0.28-0.82]
para la Ivestigación 15-24 0.5 [0.33-073]
Farmacoepidemiol 25-44 1.0 [0.77-1.17]
ógica en Atención 45-64 1.6 [1.36-1.97]
Primaria) ≥65 1.8 [1.43-2.24]
All ages 1.1 [0.97-1.21] (321)
0-1 0.8 [0.25-2.45]
UK
2-4 1.2 [0.55-2.73]
(Royal College of
5-14 0.5 [0.24-0.97]
General
15-24 1.0 [0.59-1.56]
Practitioners
25-44 1.4 [1.08-1.83]
Research and
45-64 2.2 [1.74-2.67]
Surveillance
≥65 3.4 [2.75-4.21]
Centre)
All ages 1.8 [1.57-2.00] (257)
0-1 0.4 [0.19-0.93]
2-4 1.0 [0/67-1.60]
UK 5-14 0.6 [0.48-0.87]
(The Health 15-24 1.0 [0.76-1.25]
Improvement 25-44 1.3 [1.15-1.50]
Network) 45-64 2.3 [2.12-2.60]
≥65 3.2 [2.86-3.57]
All ages 1.8 [1.67-1.89] (1021)
THIS PROJECT HAS BEEN FUNDED IN WHOLE BY CEPI. 22V1.0. 09-Feb-2020 | Diss. level: Public
APPENDIX 3
GBS Case Definition Key Caveats for Diagnosis, Data Analysis and Presentation
3.1. GBS Case Definition1 Key Caveats for Diagnosis, Data Analysis and Presentation
• Key elements of Case Definition (CD)
• Both GBS and MF have 3 levels of diagnostic certainty and the lowest, level 3, is limited to clinical findings.
• Critical for GBS to meet CD level 3 is demonstration of absent or decreased deep tendon reflexes in the same
limbs that are weak. Without this it cannot meet any level of certainty.
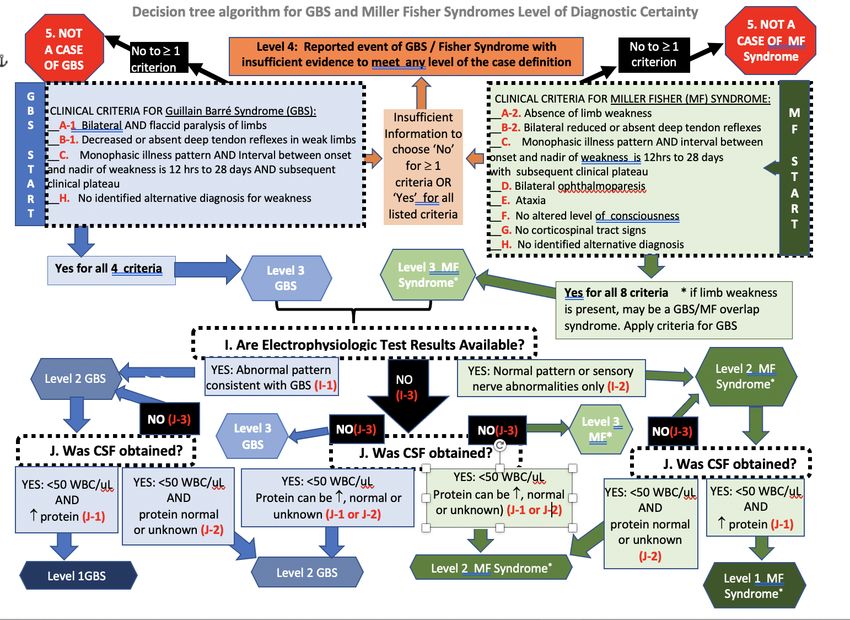
• Miller Fisher is an infrequent GBS subtype that includes bilateral ophthalmoparesis and ataxia, usually without
limb weakness. GBS/MF overlap syndromes may occur, where there is weakness and features of MF. (See
Appendix 7, Pictorial Algorithm). In such cases the level of certainty should be based on the GBS criteria, but it
can also be described as GBS/MF overlap syndrome.
• For both GBS and MF there must be sufficient follow-up to demonstrate a monophasic illness pattern (see
Appendix 7, Pictorial algorithm) and no alternative diagnosis for weakness. That said, lack of testing for
alternative diagnoses does not impact on the ability to meet the case definition.
• CIDP must be distinguished from GBS; the clinical picture may be identical but CIDP tends to onset over 8 or
more weeks and weakness tends to remit and relapse 1
• Recommendations for real time assessment (see Appendix 7, Pictorial Algorithm)
• Ensure that the degree and distribution of limb weakness is assessed and that deep tendon reflexes are assessed
in all weak limbs.
• If possible, seek assessment by a neurologist and ask that the following assessments be recorded: manual muscle
testing using the Medical Research Council scale; deep tendon reflexes; sensory and cranial nerve examination;
presence or absence of ataxia. Measures of functionality or disability would also be helpful. These are provided
in the published case definition appendices and reproduced here in Appendix 5, Table 5.
• Full assessments should ideally be done at:
o Initial presentation to medical care
o At clinical nadir (see below)
o At all subsequent points where there is significant change in neurologic status until a final outcome
endpoint is reached (recovery, death, end of follow-up). If not possible, assessments should be done
weekly for 4 weeks, monthly for 5 months and then once every 3 months.
• A date/time for the clinical nadir (defined as the worst state of clinical symptoms) should be determined.
Normally for GBS there is a steady progression in weakness to a nadir point followed by a plateau, fatal outcome
or gradual improvement. Therapies such as immunoglobulins or steroids may cause fluctuations in levels of
weakness – all of which should be carefully documented. These are usually within the first 9 weeks.
• Level 1 of certainty requires CSF WBC and protein results showing cyto-albuminologic disassociation (WBCV1.0. 09-Feb-2020 | Diss. level: Public
• Level 3 relies solely on clinical findings, of which the most important are the requirement, for GBS (not Miller
Fisher variant) that the deep tendon reflexes be absent or decreased in the same limbs that are weak.
• Confirmed alternate etiologies that exclude a diagnosis of GBS, or Miller Fisher Syndrome are listed in Table 6 in
Appendix 5. Investigation for these is not required to meet the case definition but if found do rule out GBS or
Miller Fisher syndrome.
• If real time assessment is not possible, the SPEAC data abstraction and interpretation tool (Appendix 5, Tables 1
& 2) can be used in conjunction with medical records to gather the information needed to assess the level of
diagnostic certainty.
• Testing for autoantibodies is not required for the case definition. May be relevant to type of GBS with anti-
ganglioside antibodies absent in AIDP, but present in AMAN/AMSAN (GM1, GD1a) and Miller Fisher (GQ1b,
GT1a). 5
Data Collection Guidelines
• Gather detailed clinical descriptions of symptoms/signs and time course including severity of weakness at the
clinical nadir, additional neurologic signs of GBS (e.g., fasciculations, atrophy, myoclonus).
• Document other concurrent signs, symptoms and diseases.
• Document the dates and results of all:
o electrophysiologic studies (electromyography [EMG] and nerve conduction velocity studies [NCS].
o additional neurophysiologic studies including electroencephalography [EEG], neuroimaging studies
(computed tomography [CT] or magnetic resonance imaging [MRI].
o CSF examinations including WBC (cells/uL), RBC (cells/uL), differential WBC count if available, protein
(mg/dL), glucose (mg/dL) and if done a concomitant serum glucose. The upper limits of normal for the
laboratory performing the CSF analysis should be documented.
o Tests done to identify and/or rule out alternative etiologies for weakness.
• Document nature and dates of all therapy given for GBS/MF.
• Document the neurologic/functional outcome and disposition at last observation.
Data Analysis Guidelines
• In the setting of pre-licensure trials, it is unlikely that more than one or a few cases will be reported. The
guidelines in the published case definition provide suggestions for data analysis and presentation of scenarios
where several cases are assessed (e.g., self-controlled case series study). These are not reproduced here but can
be easily found in the published guidelines section 3.2.1
THIS PROJECT HAS BEEN FUNDED IN WHOLE BY CEPI. 24V1.0. 09-Feb-2020 | Diss. level: Public
APPENDIX 4
GBS Diagnostic Codes: ICD-9/10-CM and MedDRA
4.1 GBS Diagnostic Codes: ICD-9/10-CM and MedDRA
TABLE 1. CONCEPTS FOR GUILLAIN BARRÉ AND MILLER FISHER SYNDROMES
UMLS Diagnostic Coding System Term and Codes
CUI Name Term MedDRA ICD9CM ICD10CM
C0018378 Guillain-Barre Guillain-Barre syndrome 10018767 G61.0
Syndrome Guillain Barre syndrome 10018766
Syndrome Guillain-Barre 10042812
Acute infective polyneuritis 10000813 357.0
Acute inflammatory demyelinating 10067898
polyradiculoneuropathy
Paralysis ascending 10033803
C0393799 Miller Fisher Miller Fisher Syndrome 10049567 G61.0
Syndrome Fisher’s syndrome 357.0
No broader concepts identified.
THIS PROJECT HAS BEEN FUNDED IN WHOLE BY CEPI. 25V1.0. 09-Feb-2020 | Diss. level: Public
APPENDIX 5
GBS Data Abstraction Form and Interpretation form for Medical Chart Review
5.1. GBS Data Abstraction and Interpretation Form for Medical Chart Review
Instructions are provided with each table. The focus is on the specific data needed to meet and/or exclude GBS or MF based on the Brighton case definition.1 This
form will be most applicable to situations where a hospital/other institutional chart is available and used retrospectively to gather the information needed to validate
that a case coded as GBS meets or does not meet the Brighton case definition. It may also serve as a guide for the type of data to be collected and investigations to
be done at the time a possible case is identified or reported during a clinical trial or active surveillance for cases as part of pharmacovigilance. A neurologic glossary
of terms is available as well.
Six tables are included in the form.
• Table 1 is a guide to likely sources of information for the key case definition clinical and laboratory criteria.
• Table 2 is the main data abstraction form. Use it to record data from the chart and based on the evidence to assign a value to each case definition criterion.
Space is limited and additional paper can be used as appropriate to capture key clinical and laboratory data.
• Table 3 should be used to summarize the criterion values as determined once table 2 is completed.
• Table 4 is the key to determine the level of certainty based on the summary data in Table 3. It follows the logic of the Brighton case definition.
• Table 5 is the Medical Research Council manual muscle testing scale for assessing severity of weakness at clinical nadir and follow-up
• Table 6 is a checklist of alternative causes for weakness from brain to muscle which can be used to record investigations that were done for differential
diagnoses.
TABLE 1. GBS/Miller Fisher key case definition criteria, likely and actual sources of information
Criterion Criterion category Likely sources of information Actual source of Information
A Muscle weakness • Outpatient clinic / emergency room record(s)
B Deep tendon reflexes • Neurology / Infectious Disease / other consultation notes
C Temporal illness pattern • Hospital admitting history & physical exam; discharge summary
D Ophthalmoparesis • ICU admission notes
E Ataxia • Follow-up clinic records
F Encephalopathy
G Corticospinal long tract signs
H Alternative causes for weakness Differential diagnosis, investigations & results (see Appendix 1)
I Electrophysiologic testing EMG, nerve conduction study reports
J Cerebrospinal fluid (CSF) testing Laboratory reports – CSF analysis
THIS PROJECT HAS BEEN FUNDED IN WHOLE BY CEPI. 26V1.0. 09-Feb-2020 | Diss. level: Public
TABLE 2. Data abstraction form
NOTE: glossary of neurologic terms available as a separate document.
1. Record specific information, to the extent possible, for all column 1 criteria in the results column 2 below.
2. Use recorded results to circle most appropriate BCCD criterion value based on the formulae in column 3.
1. Clinical Criteria 2. Results 3. BCCD Criteria Value Determination
* wherever ‘yes’ is chosen, indicate the worst grade of muscle strength during course A=A-1 (bilateral flaccid paralysis) IF:
( See Appendix 1. Assessment of Muscle Strength) Both legs and/or both arms are weak or have a
R = right; L = left 1. 2. 3. 4. quantitative muscle strengthV1.0. 09-Feb-2020 | Diss. level: Public
2. nadir and last observation: __Yes __No __ Not documented
If ‘Yes’ for f-1 and/or f-2, were the fluctuations associated with disease modifying
therapies (e.g. IVIG, steroids)? __ Yes* __No __not described
* if Yes, provide details:
Criterion D a) R extraocular muscle weakness: __Yes __No __Not described D = Present IF yes for both R & L
Ophthalmo- D = Absent IF No for both R & L
paresis b) L extraocular muscle weakness: __Yes __No __Not described D = UNKNOWN IF not described for R+/ or L
E = Present or Absent if either is checked
Criterion E Ataxia Ataxia __ Present __Absent __Not described OR = UNKNOWN IF Not described checked
Criterion F. Reduction or alteration of level of consciousness: ___ Present F = Present or Absent if either is checked
Altered level of ___ Absent
F = Unknown IF Not described checked
consciousness ___ Not described
Criterion G Corticospinal tract signs were: __Present __Absent ___Not described
G = Present or Absent if either is checked
Corticospinal (e.g., extensor plantar responses, spasticity, Increased muscle tone)
tract signs G = Unknown IF Not described is checked
Complete Table 6 checklist as completely as possible and then choose the best choice H = circle whatever is checked
for the statement:
An identified alternative
diagnosis for weakness was: __Present* __ Absent (check if no testing done) Present Absent
Criterion H *Describe alternative cause and basis for diagnosis:
Alternative cause
for weakness
found
THIS PROJECT HAS BEEN FUNDED IN WHOLE BY CEPI. 28V1.0. 09-Feb-2020 | Diss. level: Public
Laboratory
Results
Criteria
Neurophysiologic testing: __DONE* __Not Done __Unknown if Done I = I-1 “Typical for GBS” IF a (AIDP) OR b
or Results unavailable (AMAN) or c (AMSAN) checked
*if DONE check the result that is most consistent with the report
Criterion I a. ___Acute Inflammatory Demyelinating Polyneuropathy (AIDP) I = I-2 if d (sensory only) or g (normal) checked
Electro- b. ___Acute Motor Axonal Neuropathy (AMAN)
physiologic c. ___Acute Motor and Sensory Axonal Neuropathy (AMSAN) I = I-3 if testing Not done OR unknown if done
findings d. ___Sensory abnormalities only OR results unavailable OR Done and e checked
e. ___Inexcitable or unknown pattern (inexcitable / unknown pattern).
f. ___normal result
g. ___other (describe): NOTE: If g(other) checked, seek expert help for
interpretation.
Lumbar Puncture: __DONE* __Not done __Unknown if Done J = J-1 ‘cytoalbuminologic dissociation’ IF
* If DONE: Date (dd / mon / yy) __ / ___ / __ ) CSF WBC < 50/uL and CSF protein elevated
Criterion J
Lumbar puncture CSF protein (mg/L if known ____): __Normal __Elevated __Unknown J = J-2 IF CSF WBCYou can also read