State of the Epidemic in Scotland - 18 February 2022 Background - The ...
←
→
Page content transcription
If your browser does not render page correctly, please read the page content below
State of the Epidemic in Scotland – 18 February
2022

Background
This report summarises the current situation of the Covid-19 epidemic in Scotland. It
brings together the different sources of evidence and data about the epidemic in
Scotland at this point in time, why we are at that place, and what is likely to happen
next. This updates the previous publication published on 11 January 20221. The
information in this document helps the Scottish Government, the health service and
the wider public sector respond to the epidemic and put in place what is needed to
keep us safe and treat people who have the virus.

This edition of the State of the Epidemic summarises current data on Covid-19 at a
national and local level, and how Scotland currently compares to the rest of the UK.
It looks at the vaccination program in Scotland and its impact. Information is provided
about variants of concern and what impact these may have. Bringing this information
together in one place gives the opportunity to better understand the current state of
the epidemic in Scotland.

The State of the Epidemic report this week will summarise data up to and including
16 February 2022.

Notices around Covid-19 policy and reporting changes

On 5 January 2022, the Scottish Government announced that people who do not
have symptoms of Covid-19 will no longer be asked to take a Polymerase Chain
Reaction (PCR) test to confirm a positive Lateral Flow Device (LFD) result. Changes
have been made to the national Covid-19 case definition to reflect the revised testing
strategy.

From Thursday 13 January, the Scottish Government and PHS began reporting on
the number of people with a Covid-19 infection confirmed by either a PCR or first
LFD positive test, which was presented as ‘experimental statistics’. Starting from 10
February 2022, Covid-19 case numbers are no longer published under experimental
statistics and are using the established methodology that utilises the new case
definition. Previously published cases figures have now been retrospectively updated
since 5 January 2022 to match the new established methodology.

1
    Scottish Government: Coronavirus (Covid-19): state of the epidemic - gov.scot (www.gov.scot)

                                                                                                   i
Following changes in the Covid-19 Case definition and changing testing policies
since 5 January 2022, hospital and ICU occupancy figures now include patients with
Covid-19 cases confirmed by either PCR or LFD. Historical figures have been
updated retrospectively from 9 January 2022.

Similarly, Covid-19 admissions to hospital (including for children and young people)
now include patients with Covid-19 cases confirmed either by PCR or LFD. Historical
figures have been updated retrospectively from 5 January 2022. Please note that
admissions to ICU only include PCR confirmed Covid-19 cases.

                                                                                   ii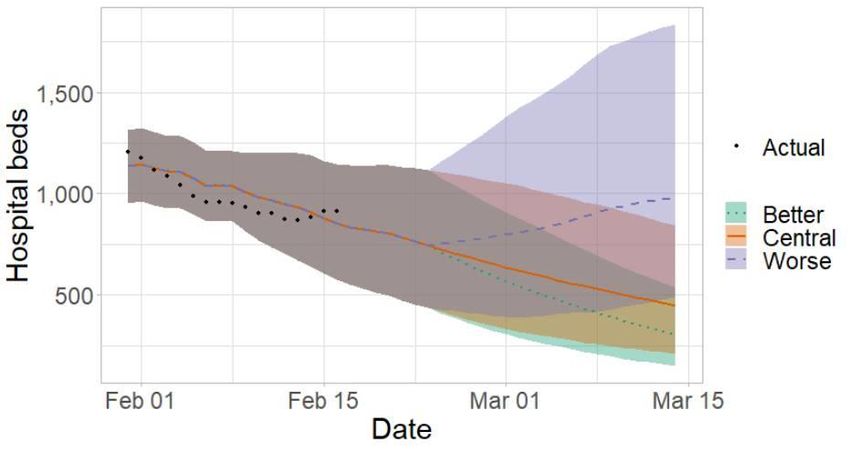
Contents
   Summary ............................................................................................................... 1
   Key Points .............................................................................................................. 1
   Method.................................................................................................................... 3
Estimated Infection Levels and Case Numbers ..................................................... 4
   Estimated Infection Levels ...................................................................................... 4
   Covid Infection Survey ............................................................................................ 5
   Wastewater Estimates ............................................................................................ 6
   Testing Rates and Positivity ................................................................................. 11
   Covid-19 Reinfections........................................................................................... 12
Severe Illness: Hospitalisation, ICU and Deaths ................................................. 13
   Hospital and ICU Occupancy and Admissions ..................................................... 13
   Deaths .................................................................................................................. 16
Resilience: Vaccinations and Antibody Estimates .............................................. 18
   Vaccinations ......................................................................................................... 18
   Antibodies Estimates ............................................................................................ 19
   Vaccine Effectiveness Against Omicron ............................................................... 19
Situation by Local Authority within Scotland ...................................................... 20
Looking ahead ........................................................................................................ 22
   Scottish Contact Survey ....................................................................................... 22
   Modelling the Epidemic ......................................................................................... 22
   Long Covid ........................................................................................................... 23
Next steps ............................................................................................................... 24

                                                                                                                            iii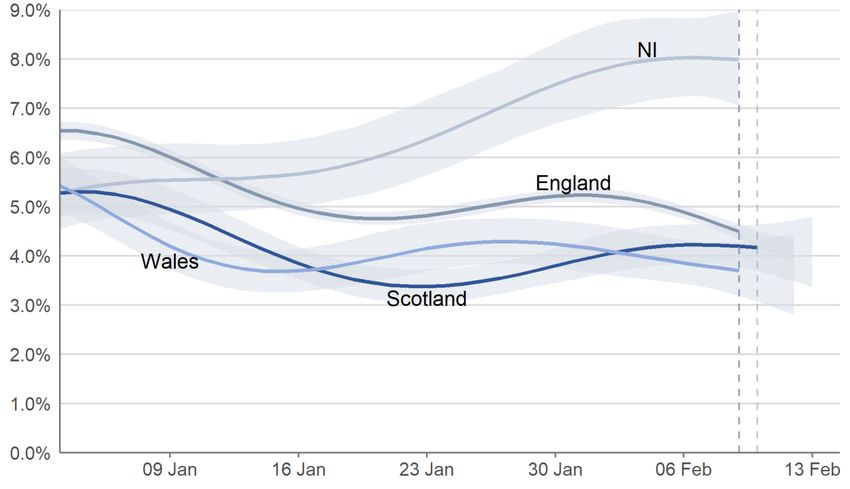
Summary
The daily positivity estimate from the Covid-19 Infection Survey for Scotland has
fluctuated in recent weeks, and may be showing early signs of levelling off in the
most recent week to 13 February, although the trend is (statistically) uncertain. By
comparison, there remains a high weekly case rate compared to previous phases of
the pandemic in Scotland, with a slight decrease in the latest two weeks. Nationwide,
wastewater (WW) Covid-19 levels have shown an upturn in the week ending on 14
February, compared to the previous week, and this moderate increase in wastewater
viral levels is observed across many of the local authorities in Scotland.

Weekly PCR or LFD case rates by specimen date across Scotland continue to
slightly decrease with some difference between age groups. In the most recent
week, younger age groups have seen decreasing case rates while there has been a
slight increase in case rates for those aged 50 or over compared to the previous
week. The majority of local authorities saw a decrease in the weekly PCR or LFD
case rate by specimen date in the most recent week, but 14 local authorities saw an
increase.

Admissions to hospital have continued to decrease in the most recent week since
peaking in early January 2022, and admissions to ICU have also decreased in the
most recent week. Covid-19 deaths have decreased overall in the week leading up
to 13 February. This decrease was seen in older age groups, and deaths remained
at low levels for the younger age groups.

Key Points

  •   The UK Health Security Agency’s (UKHSA) consensus estimate for R in
      Scotland as at 1 February is between 0.8 and 1.0. The lower limit and upper
      limit of the R value have remained unchanged since the last published figure.

  •   As at 1 February 2022, the UKHSA’s consensus view was that the incidence
      of new daily infections in Scotland was between 204 and 377 per 100,000
      people.

  •   The latest growth rate for Scotland as at 1 February was between -3% and
      1%. The upper and lower limits have increased since the last published figure.

  •   As determined through the latest weekly ONS infection survey, the
      percentage of people testing positive for Covid-19 increased in the two weeks
      up to 13 February 2022, but the trend was (statistically) uncertain in the most
      recent week. It is estimated that around 1 in 25 people (95% credible interval:
      1 in 25 to 1 in 20) in Scotland had Covid-19 at any given time in the week
      ending 13 February 2022

  •   Nationwide, wastewater Covid-19 levels have shown an upturn, with the week
      ending on 14 February recording levels of 88 million gene copies per person
      per day (Mgc/p/d), up from 51 Mgc/p/d the previous week (ending 7

                                                                                      1
February). This moderate increase in wastewater viral levels is observed
across many of the local authorities in Scotland.
• By specimen date, the seven-day combined PCR and LFD case rate
continued to decrease in Scotland in the week leading up to 12 February.
There were 794 weekly combined PCR and LFD cases per 100,000
population in the week to 12 February, which is a slight 4% decrease the
previous week. This remains a high case rate compared to previous phases of
the pandemic in Scotland.
• Data from the PHS Daily Dashboard shows that as of 12 February, the
highest combined PCR and LFD weekly case rates by specimen date per
100,000 were observed amongst those aged 20 to 39, followed by those aged
40 to 49, 19 and younger, and 50 to 59. The lowest case rates were seen
among those aged 60 to 69, 70 to 79, and 80 or older.
• The total combined PCR and LFD weekly case rates per 100,000 by
specimen date among children and young adults (aged 19 or younger) in the
week leading up to 12 February have decreased for all age groups compared
to the previous week (ending 5 February). The exception is those aged 16 to
17, where case rates remain similar to the previous week.
• In the week to and including 16 February, Covid-19 hospital occupancy
showed a decrease of 2% compared to the previous week ending 9 February,
while combined ICU occupancy has decreased by 8 patients in the week to 16
February compared to the previous week ending 9 February.
• Admissions to hospital in the week to 12 February decreased by 18%
compared to the previous week ending 5 February, while ICU admissions
have decreased by 32% in the week to 15 February compared to the previous
week ending 8 February.
• While remaining at a high level, average hospital admissions related to Covid-
19 in children and young adults have decreased among those aged younger
than 12 in the three weeks leading up to 9 February compared to the previous
three-week period leading up to 2 February, and remained at similar levels for
those aged between 12 and 21 in the same period. These figures refer both to
young patients in hospital because of Covid-19 and with Covid-19, and are
linked to PCR cases only.
• The overall number of Covid-19 deaths has continued to decrease in the
week leading up to 13 February. Compared to the previous week ending 6
February, the number of deaths decreased by 33%, or 39 deaths, to a total of
79 deaths in the week leading up to 13 February.
• In the week leading up to 12 February 2022, Shetland Islands had the highest
combined PCR and LFD weekly case rate by specimen date, reporting 2,147
cases per 100,000 population. Na h-Eileanan Siar had the lowest weekly
combined LFD and PCR case rate in the same time period, reporting 460
cases per 100,000.
2Method
This report brings together a wide range of publically available figures from a range
of data sources. These include publications by Scottish Government, Public Heath
Scotland, National Records of Scotland and Office for National Statistics along with
scientific publications and SAGE and UKHSA summaries where appropriate to
summarise the state of the epidemic in Scotland in a given week. We also provide
information on public attitudes to the virus from weekly YouGov polling surveys.
3Estimated Infection Levels and Case Numbers
Estimated Infection Levels
The reproduction number (R) is the average number of secondary infections
produced by a single infected person. If R is greater than one the epidemic is
growing, if R is less than one the epidemic is shrinking. The higher R is above
one, the more people one infectious person might further infect other people and
so the faster the epidemic grows. Please note that R is an indicator that lags
by two or three weeks. For more information please visit the UK government
website.
The UK Health Security Agency’s (UKHSA) consensus estimate for R in Scotland as
at 01 February is between 0.8 and 1.0. The lower limit and upper limit of the R value
have remained unchanged since the last published figure (Figure 1) 2 3.
Figure 1: R in Scotland over time by publishing week4
1.6
1.4
1.2
1
0.8
0.6
0.4
Feb 2021
Feb 2022
Jan 2022
May 2021
Jan 2021
Jun 2021
Oct 2021
Apr 2021
Jul 2021
Nov 2021
Dec 2021
Aug 2021
Sep 2021
Mar 2021
As at 1 February 2022, the UKHSA’s consensus view was that the incidence of new
daily infections in Scotland was between 204 and 377 per 100,000 people. This
equates to between 11,200 and 20,600 people becoming infected each day in
Scotland5 6.
2
Scottish Government: Coronavirus (Covid-19): modelling the epidemic - gov.scot (www.gov.scot)
3
Using data to 14 February 2022.
4
No R value was published for the week beginning 27 December 2021 as publications were paused over the
festive period. The most recent data point for R is dated 16 February 2022, reflecting the R value as of 1
February 2022.
5
Using data to 14 February 2022.
6
Scottish Government: Coronavirus (Covid-19): modelling the epidemic - gov.scot (www.gov.scot)
4The growth rate reflects how quickly the numbers of infections are changing day
by day. It is an approximation of the percentage change in the number of new
infections each day. More information can be found on the UK government
website.
The latest growth rate for Scotland as at 1 February was between -3% and 1%. The
upper and lower limits have increased since the previous week7 8.
Covid Infection Survey
The Covid-19 Infection Survey is a UK wide study carried out by the Office for
National Statistics (ONS) and the University of Oxford. The survey invites private
residential households to test whether they have the infection, regardless of
whether they have symptoms, using a PCR test. Participants are also asked to
provide a blood sample to test for antibodies. This means the study is unaffected
by testing policy changes mentioned at the start of this report.
In Scotland, the percentage of people testing positive for Covid-19 increased in the
two weeks up to 13 February 2022, but the trend was (statistically) uncertain in the
most recent week. The estimated percentage of people testing positive for Covid-19
in the private residential population is 4.17% (95% credible interval: 3.69% to
4.64%)9, equating to around 1 in 25 people (95% credible interval: 1 in 25 to 1 in 20).
This is higher than the latest peak of 2.29% recorded in the week to 11 September
2021, and higher than the previous peak of 1.24% recorded in the week to 17 July
2021.
Figure 2 shows the Covid-19 Infection Survey daily positivity estimates for Scotland
fluctuating in recent weeks, and showing early signs of levelling off in the most
recent week. By comparison, the Scotland weekly case rate by specimen date has
levelled off since around 18 January, with a slight decrease in the latest two weeks.
In the week 6 to 12 February 2022, estimates for the other nations of the UK are as
follows and can be seen in Figure 2.
• In England, the percentage of people testing positive for Covid-19 decreased
in the most recent week: 4.49% (95% credible interval: 4.34% to 4.64%),
equating to around 1 in 20 people (95% credible interval: 1 in 25 to 1 in 20).
• In Wales, the percentage of people testing positive for Covid-19 continued to
decrease in the most recent week: 3.71% (95% credible interval: 3.19% to
4.27%), equating to around 1 in 25 people (95% credible interval: 1 in 30 to 1
in 25).
• In Northern Ireland, the percentage of people testing positive for Covid-19
increased in the two weeks up to 12 February 2022, but the trend was
uncertain in the most recent week; the estimated percentage of people testing
7
Using data to 14 February 2022.
8
Scottish Government: Coronavirus (Covid-19): modelling the epidemic - gov.scot (www.gov.scot)
9
A credible interval gives an indication of the uncertainty of an estimate from data analysis based on a sample
population. 95% credible intervals are calculated so that there is a 95% probability of the true value lying in the
interval.
5positive is 7.99% (95% credible interval: 7.05% to 8.98%), equating to around
1 in 13 people (95% credible interval: 1 in 14 to 1 in 11)10 11.
In Scotland, the trend over time for the estimated percentage of people testing
positive for Covid-19 in private residential households were uncertain for all age
groups in the most recent week due to wide confidence intervals. Meanwhile, weekly
PCR or LFD case rates by specimen date across Scotland continue to see a slight
decrease with some difference between age groups12.
Figure 2: Modelled daily estimates of the percentage of the private residential
population testing positive for Covid-19 in each of the four nations of the UK,
between 3 January and 13 February 2022, including 95% credible intervals.
Wastewater Estimates
The Scottish Government has been working with the Scottish Environment
Protection Agency (SEPA) to detect and analyse fragments of Covid-19 virus
RNA in wastewater. The number of locations where the levels of SARS-CoV-2 in
wastewater are monitored has increased to 141 sites around Scotland. In
contrast to Covid-19 case records, virus shedding into wastewater is a biological
process. This means that wastewater data is unaffected by factors that impact
whether testing is done.
Nationwide, wastewater Covid-19 levels have shown an upturn, with the week
ending on 14 February recording levels of 88 million gene copies per person per day
(Mgc/p/d), up from 51 Mgc/p/d the previous week (ending 7 February). This
10
Scottish Government: Coronavirus (Covid-19): infection survey - gov.scot (www.gov.scot)
11
The ratios presented are rounded to the nearest 100 if over 1,000, to the nearest 10 if under 1,000, to the
nearest 5 if under 100 and to 1 if under 20. This may result in credible intervals that appear to be similar to the
estimated average ratio.
12
Scottish Government: Coronavirus (Covid-19): infection survey - gov.scot (www.gov.scot)
6moderate increase in wastewater viral levels is observed across many of the local
authorities in Scotland13.
Compared to before December 2021, wastewater Covid-19 levels appear lower than
anticipated given the known levels of Covid-19 activity. This effect may be due to the
switchover from Delta variants to the new Omicron variant, and their shedding
properties. Thus, Figure 3 shows only data from after the end of 2021, at which point
the Omicron variant already represents almost all cases in Scotland. From this, we
see a rapid decline from peak levels in early January with stable wastewater viral
levels since late January14.
Figure 3: National running average trends in wastewater Covid-19 from 31
December 2021 to 14 February 202215
Covid-19 Cases
Please note that on 5 January 2022 people were advised that they no longer
need to seek a confirmatory PCR test following a positive lateral flow test. This
will impact the number of cases reported from 5 January 2022, and means that
comparisons over time need to be made with caution. The Omicron variant
represents the dominant variant in Scotland. For more information on the
difference between reporting and specimen date, please see this earlier
publication.
By reporting date16, an average number of 6,270 cases confirmed by either PCR
only, LFD only or both PCR and LFD tests were reported per day in the week leading
13
Scottish Government: Coronavirus (Covid-19): modelling the epidemic - gov.scot (www.gov.scot)
14
Ibid.
15
Ibid.
16
The reporting date is when the result of the test is authorised and released to Public Health Scotland by NHS
Scotland and UK Government Regional Testing Laboratories.
7up to 16 February. The seven-day average number of daily reported cases levelled
off between mid to late January, and has been slightly decreasing since. In the most
recent week there continued to be a slight decrease of 7% from the daily average of
6,744 cases reported in the week leading up to 9 February (Figure 4)17.
Figure 4: Positive daily reported case numbers by the type of test used. Using
data to 16 February 202218.
20,000
Daily Number of Cases
15,000
10,000
5,000
- 01 Feb
03 Feb
05 Feb
07 Feb
09 Feb
11 Feb
13 Feb
15 Feb
16 Jan
30 Jan
06 Jan
08 Jan
10 Jan
12 Jan
14 Jan
18 Jan
20 Jan
22 Jan
24 Jan
26 Jan
28 Jan
Reported Date
LFD Only Cases
Cases confirmed by both PCR and LFD
PCR only Cases
Total Cases Seven-day Average
For comparisons over time it is more reliable to look at case rates by specimen
date19. Up until 5 January, case rates by specimen date were only identifiable for
cases confirmed by a PCR test, but following the change in testing policy, case rates
by specimen date are now available for cases confirmed either by PCR or LFD test.
Comparisons over this time period must be made with caution, as changes might
reflect changes in testing behaviour rather than changing infection levels.
Following a sharp drop in the weekly rate of PCR or LFD confirmed Covid-19 cases
after the testing policy change on 5 January, the rate of decrease has slowed since
mid-January. By specimen date, the seven-day combined PCR and LFD case rate
continued to decrease in Scotland in the week leading up to 12 February. There
were 794 weekly combined PCR and LFD cases per 100,000 population in the week
to 12 February, which is a slight 4% decrease from 828 weekly cases per 100,000
on 5 February and a 9% decrease from 871 weekly cases on 15 January (Figure
17
Scottish Government: Coronavirus (COVID-19): trends in daily data
18
Ibid.
19
The specimen date is the date the sample was collected from the patient.
85)20. This remains a high case rate compared to previous phases of the pandemic in
Scotland.
Figure 5: Seven-day combined PCR and LFD case rate for Scotland by
specimen date. Data to 12 February 2022 21.
2,500 From 5 Jan 2022
Weekly Case Rate per 100,000
cases include
2,000 PCR and LFD
confirmed cases
1,500
1,000
500
0
Feb 2021
Feb 2022
May 2020
May 2021
Jun 2021
Jun 2020
Jan 2021
Jan 2022
Oct 2020
Oct 2021
Apr 2020
Jul 2020
Nov 2020
Dec 2020
Apr 2021
Jul 2021
Nov 2021
Dec 2021
Aug 2020
Sep 2020
Aug 2021
Sep 2021
Mar 2020
Mar 2021
As at 12 February, the highest combined PCR and LFD weekly case rates by
specimen date per 100,000 were seen among those aged 20 to 39, at 1,118 weekly
cases per 100,000, followed by those aged 40 to 49, 19 and younger, and 50 to 59.
The lowest case rates were seen among those aged 60 to 69, 70 to 79, and 80 or
older. All age groups for people younger than 50 years old had a higher weekly case
rate per 100,000 than the Scottish average in this week.
There are some differences in the trend of weekly case rates over time between age
groups. With the exception of those aged 19 or younger, weekly case rates were
decreasing across all age groups in early January. In mid-January weekly case rates
levelled off among those aged 20 or older, but in the most recent week leading up to
12 February there has been a slight increase in case rates for all age groups aged
50 or over compared to the week leading up to 5 February.
Among those aged 19 or younger, weekly PCR or LFD case rates by specimen date
increased from mid-January, peaking on 26 January with 1,620 weekly cases per
100,000 (Figure 6)22. The overall weekly case rate for those aged 19 or younger has
since decreased to 886 per 100,000 in the week to 12 February. The weekly case
rates decreased for all age bands younger than 20, apart from 16 to 17 where it
remained similar to the previous week 23.
20
Public Health Scotland: Covid-19 Daily Dashboard
21
Before 5 January 2022, the case rate includes only positive laboratory confirmed PCR tests.
22
Public Health Scotland: Covid-19 Daily Dashboard
23
Ibid.
9For those aged 19 or younger, the highest combined PCR and LFD weekly case
rates by specimen date per 100,000, as of 12 February, were observed amongst
those aged 18 to 19, followed by those aged 5 to 11, 12 to 13, and 16 to 17. The
lowest weekly case rates were seen among those aged 14 to 15, 2 to 4, and 1 or
younger.
Figure 6: Weekly total combined PCR and LFD cases per 100,000 population in
Scotland by age group, by specimen date. Data to 12 February 2022 24.
4,000
From 5 Jan 2022
3,500 cases include
Weekly Case Rate per 100,000
PCR and LFD
3,000 confirmed cases 20 to 39
40 to 49
2,500
19 or younger
2,000 All Scotland
50 to 59
1,500
60 to 69
1,000 70 to 79
80 or older
500
-
Dec 2021 Jan 2022 Feb 2022
Due to different case definitions across the UK, comparisons between
countries cannot be made at this time. Cases data from Scotland and Northern
Ireland includes both PCR and LFD test results. Cases data from Wales includes
both PCR only results, and cases data from England includes PCR, LFD and
LAMP (loop-mediated isothermal amplification) test results.
Additionally, from 31 January 2022, case reporting in England and Northern
Ireland has changed to an episode-based definition which includes possible
reinfections. Historical data on cases by specimen date from these two countries
has been revised back to the beginning of the pandemic, but cases by reporting
dates have not. This changing case definition has not yet been implemented for
data from Scotland or Wales. Reported case numbers can be found on the UK
Government Dashboard.
Due to the different case definitions outlined above, we have not included case
comparisons across the four UK nations using data from the UK Government
dashboard in this edition of the report. When these definitions are more aligned we
24
Before 5 January 2022, the case rate includes only a positive laboratory confirmed PCR tests.
10will resume reporting on these comparisons. To compare estimated infection levels in
private residential households across the UK, please see the previous section on the
Covid-19 Infection Survey.
Testing Rates and Positivity
After a period of increase, the seven-day total of conducted PCR tests per 1,000
population peaked at 83 on 7 January 2022, and then decreased to 33 on 23
January. The seven-day total of conducted PCR tests per 1,000 has since
plateaued, with 28 tests per 1,000 people in the week leading up to 16 February.
Showing a similar trend, the proportion of positive PCR tests in the last seven days
(test positivity rate) reached 29.4% on 4 January and then sharply decreased to
17.9% on 18 January. The PCR test positivity rate fluctuated between 17.2% and
18% in the two weeks to 9 February, and has increased to a 18.8% PCR positivity
rate in the week to 16 February25. Please note that caution must be exercised when
interpreting these figures following changes to the testing policy on 5 January 2022.
After a decrease in the number of LFD tests that were reported between 27
December 2021 and 9 January 2022, there was a peak in reported LFD tests on 16
January 2022, with 810,225 reported tests26. The weekly total of tests reported in the
week to 13 February decreased by 5% from the previous week leading up to 6
February. There were 714,319 reported tests in the week to 13 February (Figure
7)27.
Figure 7: Number of LFD Tests Reported by Week Ending. Data up to the 13
February 2022.
1,000,000
Number of LFD Tests Reported
800,000
714,319
600,000
400,000
200,000
0
Feb 2021
Feb 2022
May 2021
Jan 2021
Jun 2021
Jan 2022
Oct 2021
Dec 2020
Apr 2021
Jul 2021
Nov 2021
Dec 2021
Aug 2021
Sep 2021
Mar 2021
Date (by week ending)
25
Scottish Government: Coronavirus (COVID-19): daily data for Scotland
26
Public Health Scotland: Covid-19 Statistical Report
27
Ibid.
11YouGov survey results have shown that on 15 to 16 February, 52% of respondents
had taken a LFD/antigen test and 9% a PCR test in the past week28. Of those who
had taken a LFD/antigen test, 45% recorded the result of their last LFD/antigen test
online and 50% did not record the results online29.
Scottish Contact Survey asks whether people use Lateral Flow Device tests and if so
how often. Approximately 76% of individuals had taken at least one lateral flow test
within the last 7 days for the survey pertaining to the 3 February - 9 February,
decreasing from 78% two weeks prior 30.
There are differences in the results from the YouGov and the Scottish Contact
Survey (SCS) which may be likely to be due to differences in sampling and
methodology. YouGov is an online survey based on an active sample which is
representative of the Scottish population with around 1,000 respondents31. The
SCS32 is based on a longitudinal survey with a larger sample of around 3,000, with
the responses being modelled to represent the Scottish population.
Covid-19 Reinfections
In Scotland, possible reinfections are defined as a positive test 90 days or
more after a previous positive test. This amount of time is set in order to be
able to distinguish between viral persistence of the primary Covid-19 episode and
a true reinfection. The current Covid-19 Case definition only includes the first time
a person is infected, but Public Health Scotland is currently reviewing its
methodologies and infrastructure to incorporate reinfection reporting routinely in
late February 2022, as well as provide revised historical data on hospitalisations
and deaths. See more in the PHS Weekly Report.
See previous publications on the most recent updates on reinfections in Scotland.
28
Results are taken from questions run on behalf of Scottish Government on the YouGov online omnibus survey.
Question ‘Coronavirus tests typically take two forms – Rapid ‘Lateral Flow or LFD’ tests (sometimes called
Antigen Tests), which give a test result in 30 minutes and are usually self-administered, or PCR Tests mostly
conducted at official Test Sites (but also available as a ‘Home Kit) – processed by a laboratory, with results
available within 48 hours. In both tests, a swab of nose and/or throat is needed. Which of the following applies to
you in relation to testing for Covid-19 in the past week (i.e. since 18 January)?’
29
Question -Thinking about the LAST lateral flow/antigen test you did in the past week…Which of the following
best describes you in relation to that test? (Base: 550 - All who have taken a Lateral Flow/antigen test in the last
week)
30
Scottish Government: Coronavirus (COVID-19): modelling the epidemic - gov.scot (www.gov.scot)
31
The sample is demographically and geographically representative of adults 18+ across Scotland, with circa
1000 responses each week fieldwork is conducted. YouGov apply weighting to the data to match the population
profile to adjust for any over/under representations and to maximise consistency from wave to wave. Parameters
used include age, gender, social class, region and level of education.
32
The sample is demographically representative of adults 18+ across Scotland, with circa 3000 responses over
two alternating panels. This is modelled to represent the Scottish population.
12Severe Illness: Hospitalisation, ICU and Deaths
Hospital and ICU Occupancy and Admissions
Following changes in the Covid-19 Case definition and changing testing policies
since 5 January 2022, hospital and ICU occupancy figures now include patients
with Covid-19 cases confirmed by either PCR or LFD. Historical figures have
been updated retrospectively from 9 January 2022.
Similarly, Covid-19 admissions to hospital (including for children and young
people) now include patients with Covid-19 cases confirmed either by PCR or
LFD. Historical figures have been updated retrospectively from 5 January 2022.
Please note that admissions to ICU only include PCR confirmed Covid-19 cases.
In the week to and including 16 February, daily Covid-19 hospital occupancy
fluctuated. NHS boards reported 912 patients in hospital or in short stay ICU on 16
February with recently confirmed Covid-19, compared to 934 on 9 February. This is
an overall 2% decrease. However, the last four days leading up to 16 February saw
an increase from 868 to 912 Covid-19 patients in hospital. This compares with 2,053
patients in hospital at the peak in January 2021 (Figure 8).
Combined ICU occupancy (including short and long stay) has decreased to 25
patients on 16 February, a decrease of 9 patients or 26% compared to 9 February.
The number of combined ICU occupancy remains lower than the peak of 172 ICU
patients recorded in January 2021. There were 13 patients in short stay ICU on 16
February, compared to 21 a week previously. This is a decrease of 8 patients. The
number of long stay ICU patients (more than 28 days) has continued to plateau in
the week leading up to 16 February (Figure 8)33.
33
Public Health Scotland: Coronavirus (Covid-19): Trends in Daily Data
13Figure 8: Patients in hospital (including short stay ICU), and patients in
combined ICU with recently confirmed Covid-19, data up to 16 February 202234.
2,500 250
From 9 Jan
Daily COmbined ICU Occunapcy
2022 patients
include PCR
Daily Hospital Occupancy
2,000 200
and LFD
confirmed
1,500 cases 150
1,000 100
500 50
0 0
Feb 2021
Feb 2022
Dec 2020
Nov 2021
Nov 2020
Dec 2021
May 2021
Oct 2020
Jan 2021
Jun 2021
Oct 2021
Jan 2022
Apr 2021
Jul 2021
Sep 2020
Aug 2021
Sep 2021
Mar 2021
Hospital and short stay ICU Combined (short and long stay) ICU
Admissions to hospital have continued to decrease over the last week, with 550
admissions to hospital for people with confirmed Covid-19 in the week to 12
February compared to 671 in the week to 5 February. This is a 18% decrease over
the last week, and compares to 1,163 weekly hospital admissions during the most
recent peak in the week leading up to 10 January (Figure 9)35. The latest data from
PHS shows 17 new Covid-19 patients admitted to ICU in the week to 15 February,
compared to 25 in the week to 8 February. This is a 32% decrease, and compares to
57 weekly ICU admissions during the most recent peak in early January 2022
(Figure 9)36.
34
ICU includes combined ICU/HDU figures and both patients with length of stay 28 days or less and with length
of stay more than 28 days. Please note that only patients with length of stay 28 days or less in ICU were
recorded until 20 January 2021. From 20 January 2021 ICU short and long stay includes both ICU or combined
ICU/HDU with length of stay 28 days or less and with length of stay more than 28 days.
35
Public Health Scotland: Covid-19 Daily Dashboard
36
Ibid.
14Figure 9: Weekly total of Covid-19 admissions to hospital and ICU with a
positive Covid test in Scotland37 38 39.
2,000 200
From 5 Jan 2022
Weekly Total Hospital Admissions
Weekly Total ICU Admissions
hospital admissions
include PCR and LFD
1,500 confirmed cases 150
1,000 100
500 50
0 0
May 2020
May 2021
Jan 2021
Jan 2022
Sep 2020
Jul 2020
Nov 2020
Jul 2021
Nov 2021
Mar 2020
Sep 2021
Mar 2021
Date of Admission
Hospital Admissions ICU Admissions
According to data from the PHS Education Dashboard, the three-week rolling
average number of Covid-19 related hospital admissions for those aged under 22
peaked in the three-week period leading up to 19 January 2022 at an average of 144
admissions, which was higher than previously seen in the pandemic. While
remaining at a high level, average hospital admissions related to Covid-19 in children
and young adults have decreased among those aged younger than 12 in the three
weeks leading up to 9 February compared to the previous three-week period leading
up to 2 February. Among those aged between 12 and 21, average hospital
admissions remained at similar levels compared to the previous three-week period.
The highest rolling three-week average of Covid-19 related hospital admissions
among children and young people as of 9 February, were observed amongst those
aged 1 or younger, followed by those aged 5 to 11, 2 to 4, and 12 to 17. The lowest
weekly case rates were seen among those aged 18 to 19 and 20 to 21 40. These
37
Data on hospital admissions goes up to 12 February 2022 and data for admissions to ICU up to 15 February
2022.
38
Covid-19 related admissions have been identified as the following: A patient’s first positive test for COVID-19
up to 14 days prior to admission to hospital, on the day of their admission or during their stay in hospital. If a
patient’s first positive test is after their date of discharge from hospital, they are not included in the analysis. An
admission is defined as a period of stay in a single hospital. If the patient has been transferred to another hospital
during treatment, each transfer will create a new admission record.
39
Before 9 January 2022, hospital admissions were only included if the patient had a recent positive laboratory
confirmed PCR test. This still applies to ICU admissions.
40
Public Health Scotland: PHS COVID-19 Education Report
15figures refer both to young patients in hospital because of Covid-19 and with Covid-
19.
In the three-week period from 12 January to 1 February 2022, almost 16% of
patients have a length of stay in hospital of between 24 and 48 hours each week.
There has been a steady decrease of patients having a length of stay of 48 hours or
longer each week over this three-week period. It is important to note that the length
of stay in hospital can be influenced by a variety of factors including age, reason for
admission, co-morbidities and hospital pressures41.
While it may be helpful to compare hospital occupancy between the UK
nations, any comparisons must be made with caution. Definitions are not
consistent across the nations and data are not reported daily by each nation.
Data from Scotland, Wales and Northern Ireland is updated retrospectively if
errors come to light, while data from England is not revised retrospectively, but
instead is corrected in the following day's data update. This means Covid-19
death figures are not directly comparable across the four nations. For more
information see UK Government website.
The seven-day average hospital occupancy in Scotland per 100,000 population was
16 patients in the week to and including 15 February 2022. The seven-day average
hospital occupancy per 100,000 in the same period for other UK nations was as
follows42:
• England: 18 per 100,000
• Northern Ireland: 27 per 100,000
• Wales: 21 per 100,000.
In Scotland, there was a daily average of 1 hospital admissions per 100,000
population in the week to and including 12 February 2022. Seven-day average
hospital admissions per 100,000 in the same period for other UK nations were as
follows43:
• England: 2 per 100,000
• Northern Ireland: 2 per 100,000
• Wales: 1 per 100,000.
Deaths
After a period of decreasing numbers of Covid-19 deaths throughout the last two
months of 2021, the week to 23 January 2022 saw a peak of 146 Covid deaths. This
came after three weeks of increasing numbers of deaths, largely consisting of
41
Public Health Scotland: Covid-19 statistical report - 16 February 2022
42
UK Government: Coronavirus (Covid-19) in the UK (accessed 16 February 2022)
43
Ibid.
16fatalities among those aged 45 or above, as Covid-19 deaths among younger age
groups have remained at similar low levels throughout the pandemic.
The overall number of Covid-19 deaths has decreased by 33%, or 39 deaths, to a
total of 79 deaths in the week leading up to 13 February, compared to 118 in the
week leading up to 6 February. This figure is 88% lower than the peak in 2020, when
the week ending 27 April saw a total of 663 deaths where Covid-19 was mentioned
on the death certificate44.
When it comes to Covid-19 related deaths across age groups in the week to 13
February, the number of deaths decreased among all age groups with people aged
over 45 compared to the previous week (the week to 6 February) (Figure 10). There
was one death among those under age 44 in the week to 13 February in the age
group 15 to 44, but the number of Covid-19 related deaths among the younger age
groups remain low. National Records of Scotland publish a weekly detailed analysis
on deaths involving Covid-19 in Scotland in their weekly report45.
Figure 10: Weekly total number of deaths where Covid-19 was mentioned on
the death certificate, by age group. Data to the week ending 13 February 2022.
Excess deaths are the total number of deaths registered in a week minus the
average number of deaths registered in the same week over the previous five
years (excluding 2020). Measuring excess deaths allows us to track seasonal
influenza, pandemics and other public health threats. Excess deaths include
deaths caused by Covid-19 and those resulting from other causes.
44
NRS Scotland: Deaths involving coronavirus (Covid-19) in Scotland
45
Ibid.
17In the week leading up to 13 February 2022, deaths from all causes were 3% below
average levels for this time of year. This constitutes the sixth week in a row where
deaths were below average46.
Deaths data from England, Northern Ireland, Scotland and Wales use
different methodologies, so they cannot be directly compared. Additionally,
deaths within 28 days of positive has been updated on 1 February 2022 to
include deaths following the most recent episode of infection, using the new
episode-based case definition in England. For more information see UK
Government website.
There were 2 average daily deaths per one million population in the week leading up
to 16 February 2022 in Scotland. In the same time period, average daily deaths for
the other UK nations were as follows47 48:
• England: 2 per one million
• Northern Ireland: 2 per one million
• Wales: 2 per one million.
Resilience: Vaccinations and Antibody Estimates
Vaccinations
Vaccinations started in Scotland on 8 December 2020 and there has been a very
high uptake. Covid-19 vaccines protect most people against severe outcomes of
a Covid-19 infection, but some people will still get sick because no vaccine is
100% effective. The current evidence suggests that you may test positive for
Covid-19 or be reinfected even if you are vaccinated, especially since the
emergence of the Omicron variant in the UK. The major benefit of vaccination
against Omicron is to protect from severe disease. For more information, see the
PHS weekly report.
By 16 February, around 4.4 million people had received their first dose, which is an
estimated 92.2% of the population aged 12 and older. Around 4.1 people had
received their second dose, which is an estimated 86.6% of the population aged 12
and older. Additionally, nearly 3.4 million people in Scotland had received a third
vaccine dose or booster, which is an estimated 70.4% of the population aged 12 and
older.
For more analysis on vaccination numbers, see previous publications. Further
analysis on vaccinations will be provided in our next weekly release, to align with
ONS publications of antibody estimates based on the Covid Infection Survey.
46
NRS Scotland: Deaths involving coronavirus (Covid-19) in Scotland
47
Deaths within 28 days of positive test.
48
UK Government: Coronavirus (Covid-19) in the UK (accessed 16 February 2022)
18Antibodies Estimates
Estimates on the proportion of people in the private residential population in Scotland
that would test positive for antibodies against SARS-CoV-2 are published by the
ONS Covid-19 Infection Survey.
The next scheduled release of antibody data from the Covid-19 Infection Survey will
be incorporated into our next weekly publication. For information on the most recent
estimates, see earlier publications or Covid Infection Survey publications.
Vaccine Effectiveness Against Omicron
The Omicron variant (parent Pango lineage B.1.1.529) can be separated into three
main groups: BA.1, BA.2 and BA.3. The original Omicron lineage, BA.1, is dominant
in the UK, however, there are increasing numbers of BA.2 sequences identified both
in the UK and internationally49. Details of risk assessments for both BA.1 and BA.2
carried out by UKHSA can be found on the UK government’s website 50 and in the
State of the Epidemic reports published on 4 February and 28 January 2022. The
latest BA.2 risk assessment update issued on 9 February indicates that increased
transmissibility and/or shorter serial interval for BA.2 compared to BA.1 contribute to
BA.2 growth advantage51.
The UKHSA reported that vaccine effectiveness against symptomatic disease,
hospitalisation or mortality with the Omicron variant is lower compared to the Delta
variant, and that it wanes rapidly. Vaccine effectiveness against all outcomes is
restored after the booster dose with effectiveness against symptomatic disease
ranging initially from around 60 to 75% and dropping to around 25 to 40% after 15
weeks. Vaccine effectiveness against hospitalisation after a Pfizer booster started at
around 90% dropping to around 75% after 10 to 14 weeks. Moderna booster
restored vaccine effectiveness against hospitalisation to around 90 to 95% up to 9
weeks after vaccination. The high level of protection against mortality was also
restored after the booster dose with vaccine effectiveness over 90% 2 or more
weeks following vaccination for those aged 50 and older52.
Vaccine effectiveness against symptomatic disease with BA.2 compared to BA.1,
showed similar results with BA.1 having an effectiveness of around 10% and BA.2
having an effectiveness of around 18% after 25 or more weeks following the second
dose. These estimates have large overlapping confidence intervals. The booster
dose of vaccine increased effectiveness to around 69% for BA.1 and 74% for BA.2 at
2 to 4 weeks following a booster vaccine. Effectiveness dropped to around 49% for
BA.1 and 46% for BA.2 10 weeks after vaccination53.
More data on vaccine effectiveness against the Omicron variant can be found in the
UKHSA vaccine surveillance reports.
49
UK Government: Covid-19 variants identified in the UK
50
Investigation of SARS-CoV-2 variants of concern: variant risk assessments - GOV.UK (www.gov.uk)
51
Risk assessment for SARS-CoV-2 variant: VUI-22JAN-01 (BA.2) 9 February 2022 (publishing.service.gov.uk)
52
Covid-19 vaccine weekly surveillance reports (weeks 39 to 6, 2021 to 2022) - GOV.UK (www.gov.uk) – week 6
53
Covid-19 vaccine surveillance report - week 6 (publishing.service.gov.uk)
19There is evidence that there is reduced overall risk of hospitalisation for Omicron
compared to Delta54 55, with the most recent estimate of the risk of presentation to
emergency care or hospital admission with Omicron was approximately half of that
for Delta56.
Situation by Local Authority within Scotland
In the week leading up to 12 February 2022, Shetland Islands had the highest
combined PCR and LFD weekly case rate per 100,000 by specimen date, reporting
2,147 cases per 100,000 population. Na h-Eileanan Siar had the lowest weekly
combined LFD and PCR case rate in the same time period, reporting 460 cases per
100,000. The total combined LFD and PCR weekly case rates by specimen date per
100,000 had increased in 14 local authorities in the week leading up to 12 February
2022 compared with the weekly case rate in the week to 5 February 2022, while 18
local authorities saw a decrease in the same period (Figure 11)57.
54
University of Edinburgh: Severity of Omicron variant of concern and vaccine effectiveness against symptomatic
disease
55
Imperial College Covid-19 response team: Report 50: Hospitalisation risk for Omicron cases in England
56
UK Health Security Agency: SARS-CoV-2 variants of concern and variants under investigation
57
Public Health Scotland: Covid-19 Daily Dashboard
20Figure 11: Weekly total LFD or PCR case rates per 100,000 people in Local
Authorities across Scotland on 12 February 2022 by specimen date.
Please note that the following local authority hotspot modelling uses data to 14
February 2022 from several academic groups to give an indication of whether a
local authority is likely to experience high levels of Covid-19. This has been
compiled via UKHSA into a consensus. The modelled weekly case rate below
is not directly comparable to the weekly case rate reported in the section
and figure above.
The local authority modelling has not been compiled via UKHSA into a consensus
this week and is based on one modelling group due to issues with some of the
models converging. Some of the models contributing to this analysis are informed by
both PCR and LFD positive tests whilst others are currently informed by PCR only.
Due to inconsistent results from modelling, UKHSA has not been able to provide
estimates for the Orkney or Shetland Islands this week.
Modelled rates of positive tests per 100,000 using data to 14 February indicate that,
for the week commencing 27 February 2022, all 30 local authorities for which
21estimates were provided are expected to exceed 50 cases per 100,000 with at least
75% probability. 28 out of 30 local authorities are expected to exceed 100 cases per
100,000, with at least 75% probability. The exceptions are Moray and Na h-Eileanan
Siar.
15 out of 30 local authorities are expected to exceed 300 cases per 100,000, with at
least 75% probability. These are Angus, Argyll & Bute, Edinburgh, Dundee, East
Dunbartonshire, Glasgow, Highlands, Midlothian, North Lanarkshire, Perth and
Kinross, Renfrewshire, South Lanarkshire, Stirling, West Dunbartonshire and West
Lothian.
Five local authorities are expected to exceed 500 cases per 100,000, with at least
75% probability. These are Glasgow, North Lanarkshire, Renfrewshire, Stirling and
West Dunbartonshire58.
Looking ahead
Scottish Contact Survey
Changes in patterns of mixing and adherence to restrictions will impact on future
case numbers. The Scottish Contact Survey measures times and settings that
people mix where they could potentially spread Covid-19. Average contacts from the
most recent Panel A cohort of the Scottish Contact Survey (week ending 9 February)
indicate an average of 4.4 contacts.
Mean contacts have decreased within the work setting by 37%, while contacts within
the settings (contacts outside home, school and work) have increased by 40%.
Contacts within the home have remained at a similar level over the same period.
Individuals under 50 years of age have reported a decrease in contacts in the last
two weeks whereas those aged 50 years and over have reported an increase.
Increases were largely driven by contacts within the work setting for those in the 50
to 59 age group, with individuals aged 60 and over reporting a rise in contacts within
other settings.
Modelling the Epidemic
The latest Modelling the Epidemic report includes projections over the next few
weeks for combined Delta and Omicron infections. These projections include the
effect of the interventions announced on 14 and 21 December 2021; those
announced as being lifted from 17, 24 and 31 January 2022; and booster take up.
The ‘Central’ scenario assumes that transmissibility remains at current levels.
‘Worse’ assumes a higher transmissibility for Covid-19 whereas ‘Better’ assumes a
lower transmissibility. With this taken into account, it is estimated that daily infections
58
Scottish Government: Coronavirus (Covid-19): modelling the epidemic - gov.scot (www.gov.scot)
22may be between 400 and 35,000 in mid-March59. However, the future trajectory of
infections is uncertain.
Figure 12 shows the impact of the daily infection projections on the number of
people in hospital. The modelling includes all hospital stays, whereas the actuals
only include stays up to 28 days’ duration that are linked to Covid-19. There
continues to be uncertainty over hospital occupancy and intensive care in the next
four weeks60.
Figure 12: Medium term projections of modelled hospital bed demand, from
Scottish Government modelling, based on positive test data reported up to 14
February 202261 62.
Long Covid
According to the Office for National Statistic (ONS), long Covid is defined as
symptoms persisting more than four weeks after the first suspected coronavirus
(Covid-19) episode that are not explained by something else.
Estimates on the proportion of people in the private residential population in Scotland
that experience long Covid symptoms are published by the ONS Covid-19 Infection
Survey on a monthly basis.
The next scheduled release of long Covid data from the Covid-19 Infection Survey is
expected to be summarised in this report on 4 March. For information on the most
59
Scottish Government: Coronavirus (Covid-19): modelling the epidemic - gov.scot (www.gov.scot)
60
Ibid.
61
Scottish Government: Coronavirus (Covid-19): modelling the epidemic - gov.scot (www.gov.scot)
62
Following the announcement removing the need for a confirmatory PCR test in some cases combined PCR
and LFD reported date data has been used from 6th January.
23recent estimates, see the State of the Epidemic report published on 4 February
2022. Weekly modelled estimated for Scotland are also published in the Modelling
the Epidemic report, which can be found here.
Next steps
The Scottish Government continues to work closely with Public Health Scotland,
modelling groups, Office of National Statistics (ONS), Scottish Environment
Protection Agency (SEPA) and YouGov to monitor what is happening across
Scotland.
Each week this report will provide an overview of the current Covid-19 situation in
Scotland. This will include real time data on case rates, hospitalisations and deaths
and how Scotland’s figures compare to those from the rest of the UK.
In the next publication we will include data as per the new case definition which
combines Covid-19 cases confirmed by PCR or LFD tests, by specimen date, and
we are also expecting to incorporate reinfections data by using episode based
reporting. The report will continue to report on data from the Covid-19 Infection
Survey and Covid-19 wastewater estimates to bring an insight in to the pandemic.
Modelling can tell us where the epidemic is likely to be heading. Local data and data
by age group can highlight where problems arise, which can help in addressing
some of these issues. In the coming weeks the roll out of the vaccine will continue to
be monitored along with the impact of this on case rates, hospital admissions and
deaths among different age cohorts.
Investigations are ongoing by NERVTAG, SPI-M, SAGE, UK Health Security Agency
(UKHSA), and Public Health Scotland regarding the impact of new variants and of
vaccination; this will be reflected here as work is undertaken.
24This publication will be available in accessible HTML on the gov.scot website © Crown copyright 2022 You may re-use this information (excluding logos and images) free of charge in any format or medium, under the terms of the Open Government Licence. To view this licence, visit http://www.nationalarchives.gov.uk/doc/open- government-licence/ or e-mail: psi@nationalarchives.gsi.gov.uk. Where we have identified any third party copyright information you will need to obtain permission from the copyright holders concerned. The views expressed in this report are those of the researchers and do not necessarily represent those of the Scottish Government or Scottish Ministers. This document is also available from our website at www.gov.scot. ISBN: 978-1-80435-113-0 The Scottish Government St Andrew’s House Edinburgh EH1 3DG Produced for the Scottish Government by APS Group Scotland PPDAS1033530 (02/22) Published by the Scottish Government, February 2022 ISBN 978-1-80435-113-0 Web Publication PPDAS1033530 (02/22)
You can also read