State of Transportation in Hampton Roads 2022 - T23-02
←
→
Page content transcription
If your browser does not render page correctly, please read the page content below
State of Transportation
           in Hampton Roads 2022

February 2023                        T23-02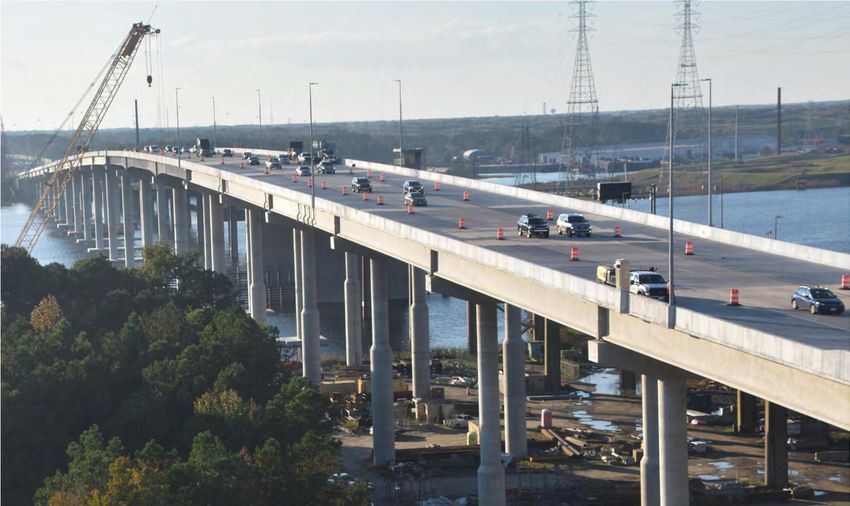
HAMPTON ROADS TRANSPORTATION PLANNING ORGANIZATION
                                                         Robert A. Crum, Jr.
                                                         Executive Director
VOTING MEMBERS:
CHESAPEAKE                                 JAMES CITY COUNTY                           SOUTHAMPTON COUNTY
Richard W. “Rick” West                     Michael J. Hipple                           William Hart Gillette
Ella P. Ward – Alternate                   John J. McGlennon - Alternate               Vacant – Alternate

FRANKLIN                                   NEWPORT NEWS                                SUFFOLK
Bobby Cutchins                             Cleon Long                                  Michael D. Duman
Vacant – Alternate                         Vacant - Alternate                          Leroy Bennett – Alternate

GLOUCESTER COUNTY                          NORFOLK                                     VIRGINIA BEACH
Phillip N. Bazzani                         Kenneth C. Alexander                        Robert M. “Bobby” Dyer
Christopher A. Hutson – Alternate          Martin A. Thomas, Jr. – Alternate           Norman Dewey “Rocky” Holcomb – Alternate

HAMPTON                                    POQUOSON                                    WILLIAMSBURG
Donnie R. Tuck – Chair                     Gordon C. Helsel, Jr.                       Douglas Pons
Steven L. Brown – Alternate                Vacant – Alternate                          Pat Dent – Alternate

ISLE OF WIGHT COUNTY                       PORTSMOUTH                                  YORK COUNTY
William M. McCarty – Vice-Chair            Shannon E. Glover                           Thomas G. Shepperd, Jr.
Rudolph Jefferson – Alternate              Lisa L. Lucas-Burke – Alternate             G. Stephen Roane, Jr. – Alternate

MEMBERS OF THE VIRGINIA SENATE                                      VA DEPARTMENT OF RAIL AND PUBLIC TRANSPORTATION
The Honorable Mamie E. Locke                                        Jennifer DeBruhl, Acting Director
The Honorable Lionell Spruill, Sr.                                  Grant Sparks – Alternate

MEMBERS OF THE VIRGINIA HOUSE OF DELEGATES                          VIRGINIA PORT AUTHORITY
The Honorable Jeion A. Ward                                         Stephen A. Edwards, CEO/Executive Director
Vacant                                                              Cathie Vick – Alternate

TRANSPORTATION DISTRICT COMM OF HAMPTON ROADS                       WILLIAMSBURG AREA TRANSIT AUTHORITY
William E. Harrell, President/Chief Executive Officer               Sanford (Sandy) Wanner, Interim Executive Director
Ray Amoruso – Alternate                                             Karen Davis – Alternate

VIRGINIA DEPARTMENT OF TRANSPORTATION
Christopher Hall, Hampton Roads District Engineer
Todd Halacy – Alternate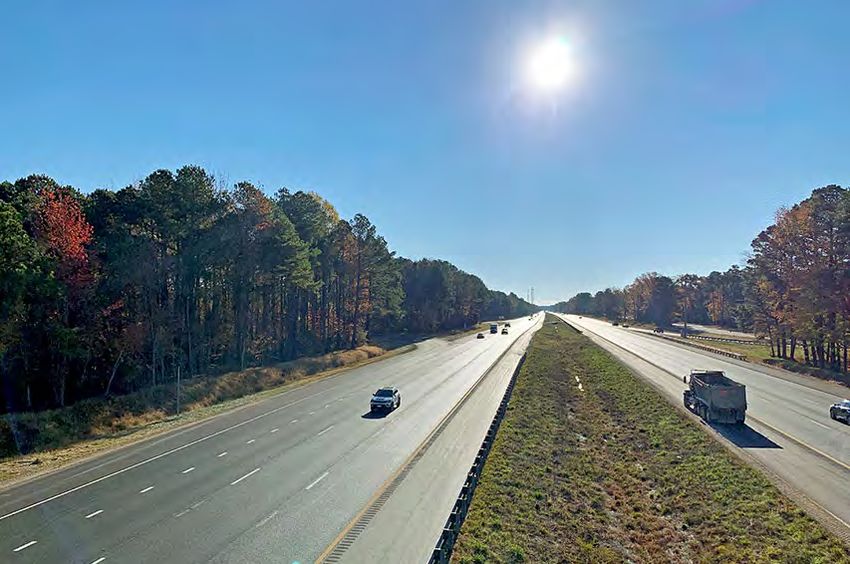
HAMPTON ROADS TRANSPORTATION PLANNING ORGANIZATION
NON-VOTING MEMBERS:
CHESAPEAKE                   HAMPTON                      NEWPORT NEWS            PORTSMOUTH                   VIRGINIA BEACH
Christopher M. Price         Mary Bunting                 Cynthia D. Rohlf        Mimi Terry                   Patrick A. Duhaney

FRANKLIN                     ISLE OF WIGHT COUNTY         NORFOLK                 SOUTHAMPTON COUNTY           WILLIAMSBURG
Amanda C. Jarratt            Randy R. Keaton              Larry “Chip” Filer      Brian Thrower                Andrew O. Trivette

GLOUCESTER COUNTY            JAMES CITY COUNTY            POQUOSON                SUFFOLK                      YORK COUNTY
Carol Steele                 Scott Stevens                J. Randall Wheeler      Albert Moor                  Neil Morgan

FEDERAL HIGHWAY ADMINISTRATION                                  FEDERAL TRANSIT ADMINISTRATION
Thomas Nelson, Jr., Division Administrator, Virginia Division   Terry Garcia-Crews, Regional Administrator, Region 3
FEDERAL AVIATION ADMINISTRATION                                 VIRGINIA DEPARTMENT OF AVIATION
Jeffrey W. Breeden, Washington Airports Office District         Greg Campbell, Director
PENINSULA AIRPORT COMMISSION                                    NORFOLK AIRPORT AUTHORITY
Michael A. Giardino, Executive Director                         Mark Perryman, Executive Director/CEO
COMMUNITY ADVISORY COMMITTEE                                    FREIGHT TRANSPORTATION ADVISORY COMMITTEE
Mark Geduldig-Yatrofsky, Chair                                  Robert Eveleigh, Chair
MILITARY LIAISONS                                               INVITED PARTICIPANTS
Harry Hung, Colonel, U.S. Air Force                             Frederick T. Stant, III, Commonwealth Transportation Board
Jennifer Stockwell, Captain, U.S. Coast Guard                   B. Wayne Coleman, Commonwealth Transportation Board
Daniel Bense, Captain U.S. Navy                                 Vacant
Gordon Meek, Captain, U.S. Navy – Alternate

HRTPO PROJECT STAFF
Pavithra Parthasarathi             Deputy Executive Director
Keith M. Nichols                   Principal Transportation Engineer
Matt Klepeisz                      Communications Administrator
Andrew Margason                    General Services Manager
Christopher W. Vaigneur            Assistant General Services Manager
THE STATE OF TRANSPORTATION IN HAMPTON ROADS 2022

                    PREPARED BY:

                    FEBRUARY 2023

                                                T23-02
REPORT DOCUMENTATION

TITLE                                                                    REPORT DATE
The State of Transportation in Hampton Roads 2022                        February 2023

AUTHOR/PROJECT MANAGER                                                   ORGANIZATION CONTACT INFORMATION
Keith M. Nichols, PE                                                     Hampton Roads Transportation Planning Organization
                                                                         723 Woodlake Drive
                                                                         Chesapeake, Virginia 23320
                                                                         (757) 420-8300
                                                                         http://www.hrtpo.org

ABSTRACT                                                                 ACKNOWLEDGMENTS

This annual report details the current status of all facets of the       Prepared in cooperation with the U.S. Department of
transportation system in Hampton Roads, including air, rail, water,      Transportation (USDOT), Federal Highway Administration
and highways. Many aspects of the highway system are                     (FHWA), and Virginia Department of Transportation (VDOT). The
highlighted, including roadway usage, bridge conditions, costs of        contents of this report reflect the views of the Hampton Roads
congestion, commuting characteristics, roadway safety, truck data,       Transportation Planning Organization (HRTPO). The HRTPO is
transit usage, bicycle and pedestrian facilities, highway funding,       responsible for the facts and the accuracy of the data presented
tolling, and operations.                                                 herein. The contents do not necessarily reflect the official views
                                                                         or policies of the FHWA, VDOT or Hampton Roads Planning
This report is produced as part of the region’s Congestion               District Commission. This report does not constitute a standard,
Management Process (CMP). The Congestion Management                      specification, or regulation. FHWA or VDOT acceptance of this
Process is an on-going process that identifies, develops,                report as evidence of fulfillment of the objectives of this planning
evaluates, and implements transportation strategies to enhance           study does not constitute endorsement/approval of the need for
mobility regionwide. This report is also produced as part of the         any recommended improvements nor does it constitute approval
HRTPO’s Performance Management effort.                                   of their location and design or a commitment to fund any such
                                                                         improvements. Additional project level environmental impact
                                                                         assessments and/or studies of alternatives may be necessary.
NON-DISCRIMINATION

The HRTPO assures that no person shall, on the ground of race,
color, national origin, handicap, sex, age, or income status as
provided by Title VI of the Civil Rights Act of 1964 and subsequent
authorities, be excluded from participation in, be denied the benefits
of, or be otherwise subject to discrimination under any program or
activity. The HRTPO Title VI Plan provides this assurance,
information about HRTPO responsibilities, and a Discrimination
Complaint Form.
TABLE OF CONTENTS

                                                                      INTRODUCTION ........................................ 1
                                                                      AIR TRAVEL .............................................. 4
                                                                      PORT DATA ............................................ 11
                                                                      RAIL TRAVEL .......................................... 15
                                                                      BRIDGES ............................................... 18
                                                                      PAVEMENT CONDITION .......................... 21
                                                                      ROADWAY USAGE .................................. 24
                                                                      CONGESTION DATA ................................ 30
                                                                      COMMUTING ......................................... 35
                                                                      ROADWAY SAFETY .................................. 40
                                                                      TRUCK TRAVEL ....................................... 46
                                                                      PUBLIC TRANSPORTATION ..................... 48
                                                                      ACTIVE TRANSPORTATION ...................... 54
                                                                      TRANSPORTATION FINANCING ............... 60
                                                                      FUEL PRICES ......................................... 64
                                                                      TOLLING ................................................ 66
                                                                      ROADWAY PROJECTS ............................. 68
                                                                      TRANSPORTATION OPERATIONS ............. 71
                                                                      AIR QUALITY ........................................... 74
                                                                      NATIONAL RANKING SUMMARY .............. 76
                                                                      ADDITIONAL INFORMATION .................... 77

NEW HIGH RISE BRIDGE                                                                                                    Image Source: VDOT.

                       THE STATE OF TRANSPORTATION IN HAMPTON ROADS - 2022                                                           i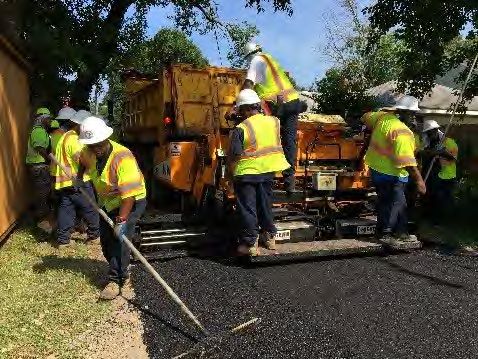
INTRODUCTION
The COVID-19 pandemic impacted travel more than any
other issue in recent memory. While the pandemic
becomes the “new normal”, it continues to impact some
aspects of the transportation system.
Many people continue to work from home on a regular basis,
and some may continue to do so permanently. Roadway travel
and congestion levels, which decreased during the early months
of the pandemic, are returning close to pre-pandemic
conditions. Air and rail travel levels continue to rebound as
well, and the Port of Virginia is serving record levels of cargo.
Public transportation usage, however, continues to lag pre-
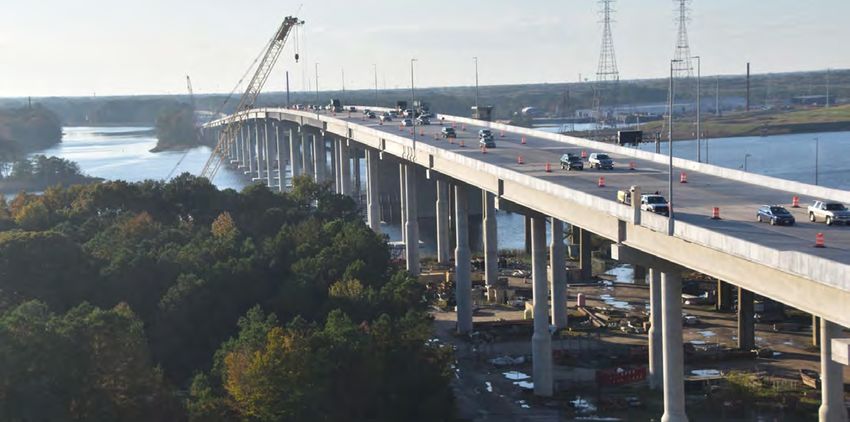
pandemic levels. HAMPTON ROADS BRIDGE-TUNNEL CONSTRUCTION Image Source: VDOT.
Work continues on a number of major roadway construction Transportation improvements in Hampton Roads have not
projects in Hampton Roads. Construction is currently underway been limited to the highway network. The Port of Virginia has
on two Regional Priority Projects – widening of the Hampton recently completed $700 million in projects to greatly
Roads Bridge-Tunnel and adjacent sections of I-64 and improve and expand Norfolk International Terminals and the
widening I-64 in Chesapeake (including the High Rise Bridge). Virginia International Gateway facility, and work is underway
These are in addition to a number of major projects that have to widen and deepen the shipping channels to the port.
recently been completed throughout the region, including an Millions of dollars of improvements have been made in recent
additional tube at the Midtown Tunnel, the Martin Luther King years at both Norfolk International and Newport News-
Freeway Extension, three phases of I-64 widening on the Williamsburg International Airports. A new Amtrak station
Peninsula, both phases of I-64/I-264 interchange was built in Norfolk, and construction is underway on a new
improvements, upgrading the Dominion Boulevard corridor multi-modal station near Bland Boulevard in Newport News.
including the new fixed-span Veterans Bridge, the I-564 And generational changes to the regional public
Intermodal Connector, the replacement of the Lesner Bridge in transportation system, including a new regional transit
Virginia Beach, and the first phase of the I-64 Express Lanes backbone, are underway, largely funded through a new
network. regional funding source dedicated to transit.
THE STATE OF TRANSPORTATION IN HAMPTON ROADS - 2022 1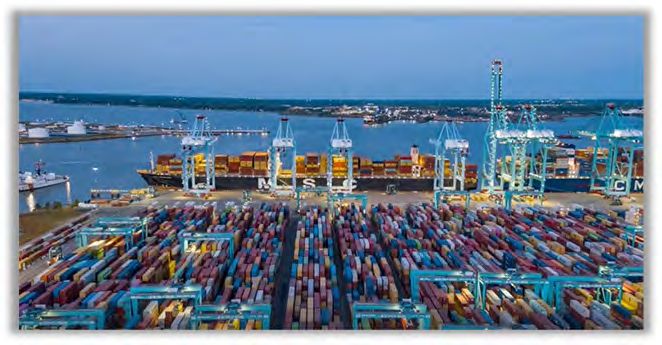
INTRODUCTION (continued)
  Even with all of these projects in Hampton Roads, there
  continue to be challenges. In spite of increased funding levels
  in recent years, many important transportation projects have
  no funding identified. The 2045 Hampton Roads Long-Range
  Transportation Plan identified $70 billion in candidate
  projects, but less than $14 billion is projected to be available
  for new projects. Funding for bridge and roadway
  maintenance will need to increase as infrastructure continues to
  age. In addition, congestion has increased as roadway levels
  approach and start exceeding pre-pandemic levels.

       NOTABLE HAMPTON ROADS NUMBERS
     Population                          1,749,665                   I-64 PENINSULA SEGMENT III WIDENING                    Image Source: VDOT

     Licensed Drivers                    1,169,561                   This State of Transportation report details the current status of
                                                                     all facets of the transportation system in Hampton Roads,
     Registered Vehicles                 1,590,712                   including air, rail, water, and highways. Many aspects of the
     Centerline-Miles                       8,600                    highway system are highlighted, including roadway usage,
                                                                     pavement condition, bridge condition, congestion, commuting
     Lane-Miles                            19,571                    characteristics, roadway safety, truck data, transit usage,
                                                                     active transportation, transportation financing, tolling,
     Airport Boardings                   1,741,967                   transportation operations, and air quality.
     Port Cargo Tonnage                 25,354,148                   In addition, this edition of the State of Transportation report
     Amtrak Passengers                    163,458                    includes an analysis of the impacts of the COVID-19
                                                                     pandemic on the Hampton Roads transportation system where
     Transit Passengers                  7,187,593                   data is available. Impacts of the pandemic on air travel,
                                                                     ports, rail travel, roadway travel, congestion levels, safety,
     Bridges                                1,268                    active transportation, and public transportation are all
     Daily Vehicle-Miles of Travel      38,375,000                   highlighted.

                                      THE STATE OF TRANSPORTATION IN HAMPTON ROADS - 2022                                                        2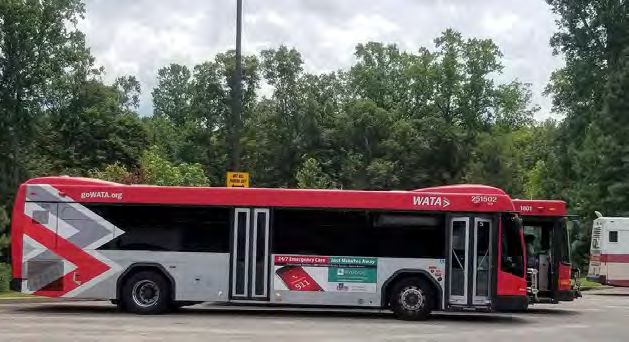
INTRODUCTION (continued)
  This report is produced as part of the                              HAMPTON ROADS TRANSPORTATION NETWORK
  HRTPO’s Congestion Management Process
  (CMP), which is an ongoing program that
  identifies, develops, evaluates, and
  implements transportation strategies to
  enhance mobility regionwide. The
  Hampton Roads Congestion Management
  Process report includes a comprehensive
  congestion analysis of the region’s
  highway system, identification of the most
  congested corridors and areas of Hampton
  Roads, and congestion management
  strategies. This report and all other CMP
  documents are available on HRTPO’s
  website at
  http://www.hrtpo.org/page/congestion-
  management.

  This report is also produced as part of
  HRTPO’s Performance Management effort.
  In 2009, the Virginia General Assembly
  passed legislation codifying regional
  transportation performance measurement
  and in response, HRTPO staff developed a
  list of regional performance measures. In
  addition, new federal regulations require
  states and metropolitan areas to use performance measures
  and set targets in areas such as pavement and bridge
  condition, freight, travel time reliability, transit, and safety.
  More information on HRTPO’s Performance Management effort
  is available on HRTPO’s website at
  http://www.hrtpo.org/page/performance-management.

                                      THE STATE OF TRANSPORTATION IN HAMPTON ROADS - 2022                    3
AIR TRAVEL
 The COVID-19 pandemic impacted the airline industry
 more than any other mode of transportation. Travel levels                                                             NOTABLE AIR TRAVEL NUMBERS
 returned closer to normal throughout 2021, and Hampton
 Roads airports have fared better than many others.                                                                       The change in the number of passengers that used
                                                                                                  82%                     Hampton Roads airports between 2020 and
                                                                                                                          2021, after falling 57% from 2019 to 2020.
 The number of passengers traveling via commercial air service
 was increasing in Hampton Roads prior to the pandemic. Over                                                              The increase in capacity (in terms of available
 2.2 million passengers boarded flights at the two commercial                                     63%                     seat-miles) at Hampton Roads airports between
 service airports in Hampton Roads – Norfolk International                                                                2020 and 2021.
 (ORF) and Newport News-Williamsburg International (PHF) – in                                                             The decrease in average airfares at Norfolk
 2019 according to Federal Aviation Administration (FAA) and
 local airport data. The number of passengers using regional                                       7%                     International Airport between 2012 and 2021.
                                                                                                                          At Newport News-Williamsburg International
 airports increased 82% from 2020 to 2021 after falling by                                                                Airport, the average airfare was unchanged.
 57% from 2019 to 2020 due to the COVID-19 pandemic.

                                                                                                 ANNUAL PASSENGER BOARDINGS AT HAMPTON ROADS
                                                                                                              AIRPORTS, 2012-2021
                                                                                                 2,600,000
                                                                                                 2,400,000                             PHF Boardings

                                                                    ANNUAL PASSENGER BOARDINGS
                                                                                                 2,200,000                             ORF Boardings

                                                                                                 2,000,000
                                                                                                 1,800,000
                                                                                                 1,600,000
                                                                                                 1,400,000
                                                                                                 1,200,000
       NORFOLK INTERNATIONAL AIRPORT          Image Source: NIA.                                 1,000,000
                                                                                                   800,000
 The changes in passenger levels experienced in Hampton
                                                                                                   600,000
 Roads during and after the pandemic are similar to those at                                       400,000
 other airports. National passenger levels increased by 78%                                        200,000
 from 2020 to 2021, slightly lower than Hampton Roads, after                                             0
                                                                                                                      2012 2013 2014 2015 2016 2017 2018 2019 2020 2021
 decreasing by 61% from 2019 to 2020.                                                      Data sources: Federal Aviation Administration, Norfolk International Airport (ORF) and Newport News-Williamsburg International Airport (PHF).
                                                                                           Boardings represent only those passengers that board airplanes at each airport.

                                       THE STATE
                                         THE STATEOF
                                                   OFTRANSPORTATION
                                                      TRANSPORTATION IN
                                                                      IN HAMPTON
                                                                         HAMPTON ROADS
                                                                                 ROADS -- 2022
                                                                                          2014                                                                                                                                             4
                                                                                                                                                                                                                                           3
AIR TRAVEL (continued)
Airfares at Hampton Roads airports have largely decreased ANNUAL PASSENGER BOARDINGS AT HAMPTON ROADS
over the last decade. In late 2012, average airfares at AND NATIONAL AIRPORTS, 2012-2021
Norfolk International Airport were $394, which was about $20 3,000 1,100,000
higher than the national average. At Newport News- 2,700 1,000,000
Williamsburg International Airport, airfares ($431) were
NATIONAL BOARDINGS (thousands)
REGIONAL BOARDINGS (thousands)
2,400 900,000
above the national average. After falling during the 2,100 800,000
pandemic, average airfares increased at both Hampton Roads 1,800
700,000
airports throughout 2021. By the end of 2021, the average 1,500
600,000
airfare at Norfolk International Airport was $366, which is 7% 500,000
1,200
lower than the average airfare in late 2012 but was $39 400,000
900 300,000
higher than the national average. At Newport News- Regional Boardings
600 200,000
Williamsburg International Airport the average airfare was National Boardings
300 100,000
$436 at the end of 2021, which is similar to the airfare in
0 0
2012 but more than $100 higher than the national average. 2012 2013 2014 2015 2016 2017 2018 2019 2020 2021
Data sources: Federal Aviation Administration, Norfolk International Airport (ORF) and Newport News-Williamsburg International Airport (PHF).
Boardings represent only those passengers that board airplanes at each airport.
AVERAGE AIRFARES FOR HAMPTON ROADS AND
NATIONAL AIRPORTS, 2012-2021
$550
$500
$450
$400
AVERAGE AIRFARE
$350
$300
$250
NEWPORT NEWS-WILLIAMSBURG AIRPORT Image Source: NNWIA. $200
$150 National Average
It should be noted that these airfares only reflect the costs $100 Newport News-Williamsburg Int'l
$50 Norfolk Int'l
associated with ticket fares and do not include additional fees
$0
that have expanded in recent years for checked baggage,
seat assignments, ticket changes, early check-in, meals, etc.
Data source: Bureau of Transportation Statistics. Average fares are based on domestic itinerary fares consisting of round-trip fares unless the customer
does not purchase a return trip, in which case the one-way fare is included. Fares are based on the total ticket value (including any additional taxes and
fees) and do not include other fees (such as baggage fees) paid at the airport or onboard the aircraft.
THE STATE OF TRANSPORTATION IN HAMPTON ROADS - 2022 5AIR TRAVEL (continued)
The number of flights departing from Hampton Roads airports
decreased early in the last decade but increased over the last BEHIND THE NUMBERS
few years prior to the pandemic. An average of 75 flights Passenger levels and airline capacity (in terms of nonstop
depart Hampton Roads each day in 2022 (although this is flights and available seat-miles) were rebounding in Hampton
greatly impacted by seasonal service on some routes). This Roads prior to the pandemic. Between 2015 and 2019, the
compares to 97 commercial flights departing from Hampton increase in passenger levels and capacity in Hampton Roads
Roads airports each day prior to the pandemic in 2019 and outpaced many similar-sized airports. Among 115 airports in
74 flights offered each day in 2021. the United States classified as “small” and “medium” by the
FAA, Norfolk International ranked 41st highest in terms of the
The increase in the number of flights from Hampton Roads
largest percentage growth in passenger volumes between
airports prior to the pandemic resulted in an increase in the
2015 and 2019 and 26th highest in terms of capacity growth in
number of available seat-miles, a common method of
available seat-miles.
measuring an airport’s person-carrying capacity. After falling
from nearly 1.4 billion seat-miles departing Hampton Roads in In spite of the large decrease in passenger volumes during the
2019 to 750 million seat-miles in 2020, the number increased COVID-19 pandemic, Norfolk International fared better than
to just over 1.2 billion seat-miles available on flights in 2021. many comparable airports. Among the 115 airports classified
as “small” and “medium” airports, Norfolk International ranked
ANNUAL AVAILABLE SEAT-MILES AT 35th highest in terms of the change in the percentage in
HAMPTON ROADS AIRPORTS, 2012-2021 passenger volumes between 2019 and 2021.
1,800,000
PHF Seat-Miles More information on the impacts of the COVID-19 pandemic on
1,600,000
AVAILABLE SEAT-MILES (in thousands)
ORF Seat-Miles air travel is included at the end of this section.
1,400,000
1,200,000
1,000,000
800,000
600,000
400,000
200,000
0
2012 2013 2014 2015 2016 2017 2018 2019 2020 2021 Image Source: NIA.
Data source: Bureau of Transportation Statistics. Available seat-miles is a common method of measuring an airport’s person-carrying capacity and is
equal to the number of seats available multiplied by the number of miles flown.
THE STATE OF TRANSPORTATION IN HAMPTON ROADS - 2022 6AIR TRAVEL (continued)
Load factors (which are passenger-miles as
NEW DEVELOPMENTS
a proportion of available seat-miles) were
also impacted by the pandemic, New Airlines – A number of new airlines have either begun serving airports in
rebounding at Norfolk International from Hampton Roads or have announced new service to the region. The largest of these
82.7% in 2019 to 64.8% in 2020 to is Breeze Airways, which began service at Norfolk International Airport in June
78.6% in 2021. The load factor also 2021. The airline focuses on providing direct service between underserved, small to
rebounded at Newport News-Williamsburg midsize airports. Breeze Airways provides nonstop service from Hampton Roads to
International, from 82.5% in 2019 to a number of markets including
59.0% in 2020 to 78.9% in 2021. Charleston (SC), Hartford, Las Vegas,
New Orleans, New York Long Island
As of 2022 there are a total of 36 airports MacArthur and Westchester, Palm
in 25 markets served nonstop from Beach, Providence, and Tampa. New
Hampton Roads. Norfolk International service has been announced to Los
Airport has nonstop flights to all of these Angeles and Savannah in 2023. Image Source: NIA.
airports and markets, while 3 markets are
served nonstop from Newport News- Avelo Airlines began service at the
Williamsburg International Airport. This Newport News-Williamsburg
number includes seasonal service and International Airport in October
service that is only provided by airlines on 2022. Initial flights from Avelo
certain days of the week. Nonstop service Airlines provide nonstop service from
to some markets was reduced or eliminated Hampton Roads to Orlando and Fort
during the COVID-19 pandemic, such as Lauderdale three days per week.
Delta Air Lines service at Newport News- Image Source: Avelo Airlines.
Spirit Airlines announced that they
Williamsburg International.
will begin providing service to
The most popular final destination for Norfolk International Airport in March
passengers using Hampton Roads airports 2023. Initial nonstop service will be
in 2021 was New York City, with a total of provided daily from Hampton Roads
138,700 passengers traveling either to or to Orlando and Fort Lauderdale,
from New York. The second most popular which will provide connections to
flights to Puerto Rico, the Caribbean,
Image Source: Spirit Airlines.
and Central America.
THE STATE OF TRANSPORTATION IN HAMPTON ROADS - 2022 7AIR TRAVEL (continued)
destination from Hampton Roads in 2021 was Atlanta with Of the top twelve markets for Hampton Roads air travelers in
138,500 passengers, and the third most popular final 2021, only San Diego and Los Angeles were not served by
destination was Chicago with 128,300 passengers. By any nonstop service from Hampton Roads airports. In recent
comparison, in 2019 the most popular destination was New years, this number of top markets has been as high as six.
York, with 212,900 passengers.
NONSTOP DESTINATIONS FROM HAMPTON ROADS AIRPORTS (AS OF OCTOBER 2022)
BOSTON
HARTFORD*
PROVIDENCE*
DETROIT
NEW YORK
PITTSBURGH* (EWR, LGA, JFK, ISP, HPN)
CHICAGO
(MDW, ORD) PHILADELPHIA
DENVER COLUMBUS*
BALTIMORE
CINCINNATI* WASHINGTON
(DCA, IAD) Top Final Destinations
LAS VEGAS*
to/from Hampton Roads
Airports (2021)
CHARLOTTE 2021
NASHVILLE Passengers
Destination
ATLANTA 1) New York City 138,700
2) Atlanta 138,500
DALLAS CHARLESTON* 3) Chicago 128,300
(DAL, DFW) 4) Orlando 118,900
JACKSONVILLE* 5) Dallas/Ft. Worth 107,100
Nonstop Destinations Served Daily from Hampton Roads Airports 6) Miami/Ft Lauderdale 106,900
(as of October 2022) HOUSTON 7) San Diego 105,600
ORLANDO
Nonstop Markets from Norfolk International only (MCO, SFB) 8) Los Angeles 99,800
NEW ORLEANS*
9) Boston 91,700
Nonstop Markets from Newport News/Williamsburg International only TAMPA BAY
(PIE, TPA) 10) Denver 85,300
Nonstop Markets from both Norfolk and Newport News/Williamsburg International Airports
SO. FLORIDA 11) Las Vegas 70,600
(FLL, MIA, PBI)
12) Houston 70,500
Data Source: Federal Aviation Administration.
Red indicates seasonal service. * indicates service is not daily.
THE STATE OF TRANSPORTATION IN HAMPTON ROADS - 2022 8AIR TRAVEL (continued)
COVID-19 IMPACTS
Very few aspects of the economy have been impacted more MONTHLY PASSENGER BOARDINGS AT HAMPTON ROADS
by the COVID-19 pandemic than the airline industry, but AIRPORTS, 2019 - 2022
300,000
passenger levels have returned to pre-pandemic levels. 2019
2020
MONTHLY PASSENGER BOARDINGS
The number of passengers using the two commercial service 250,000 2021
2022
airports in Hampton Roads – Norfolk International Airport and
200,000
Newport News-Williamsburg International Airport – began to
sharply decrease in March 2020 at the start of the pandemic 150,000
shutdowns and by April the number of passengers boarding
planes in Hampton Roads was 94% below the level seen in 100,000
April 2019. The number of passengers increased throughout
50,000
late spring and summer of 2020 but were largely flat
afterward until February 2021, when passenger levels began 0
to increase. By late 2021 passenger levels at Hampton
Roads airports had nearly reached pre-pandemic levels. For Data sources: Federal Aviation Administration, Norfolk International Airport (ORF) and Newport News-Williamsburg International Airport (PHF).
the first nine months of 2022, passenger levels were within
2% of the level experienced in the first nine months of 2019. MONTHLY CHANGE IN PASSENGER BOARDINGS
2019 to 2022
Air travel decreases in Hampton Roads have been less than 20%
CHANGE IN PASSENGER BOARDINGS, 2019 TO 2022
the decreases seen around the nation. National air travel 15%
levels were 96% lower at the peak of shutdowns in April 10%
2020 compared to April 2019. Since then, national 5%
passenger levels have lagged regional levels throughout most
0%
months. Passenger volumes for the first nine months of 2022
-5%
were still 8% below the levels seen in the same nine months of
-10%
2019, which is higher than the 2% decrease in Hampton
-15%
Roads.
Hampton Roads
-20%
National
The capacity of the airline industry, in terms of the number of -25%
flights and the number of seat-miles, also decreased during -30%
the pandemic. In April 2020, there were 680 flights that Jan Feb Mar Apr May Jun Jul Aug Sept
Data sources: Federal Aviation Administration, Norfolk International Airport (ORF) and Newport News-Williamsburg International Airport (PHF).
THE STATE OF TRANSPORTATION IN HAMPTON ROADS - 2022 9AIR TRAVEL (continued)
COVID-19 IMPACTS
departed from Hampton Roads commercial service airports, MONTHLY AVAILABLE SEAT-MILES AT HAMPTON ROADS
which is down 72% from the 2,413 flights offered in April AIRPORTS, 2019 - 2022
200,000
2019. By September 2022, the 2,057 flights departing
180,000 2019
Hampton Roads airports was down 17% from September
MONTHLY AVAILABLE SEAT-MILES
2020
2019. Nationally, the number of flights was down 69% 160,000
2021
from April 2019 to April 2020 and down 12% from 140,000 2022
September 2019 to September 2022. 120,000
100,000
With the number of flights being reduced due to lower 80,000
travel demand, the number of seat-miles at Hampton Roads 60,000
airports also decreased. The number of seat-miles began to 40,000
sharply decrease in Hampton Roads in March 2020 and by 20,000
April the number of available seat-miles at Hampton Roads 0
airports was 72% below the level seen in April 2019. The
number of available seat-miles increased throughout the Data source: Bureau of Transportation Statistics.
summer and fall of 2020 and continued through summer
2021. Through the first nine months of 2022 the number of MONTHLY CHANGE IN AVAILABLE SEAT-MILES
available seat-miles in Hampton Roads was 5% below the 2019 to 2022
pre-pandemic level seen in 2019. 20%
15%
Decreases in available seat-miles at Hampton Roads
CHANGE IN AVAILABLE SEAT-MILES
10%
airports have been similar to the decreases seen around the 5%
nation. The number of national available seat-miles was
0%
73% lower in April 2020 compared to April 2019, which
-5%
was similar to the 72% decrease in Hampton Roads. For the
-10%
first nine months of 2022 the number of national available
seat-miles was 6% below the levels seen in the same months -15%
Hampton Roads
in 2019. This is slightly lower than the decrease in Hampton -20%
National
Roads. -25%
-30%
Jan Feb Mar Apr May Jun Jul Aug Sept
Data source: Bureau of Transportation Statistics.
THE STATE OF TRANSPORTATION IN HAMPTON ROADS - 2022 10PORT DATA
Cargo levels handled by the Port of Virginia slightly
decreased at the height of the pandemic but reached record NOTABLE PORT DATA NUMBERS
levels in 2021, providing a boost to both the regional and
statewide economies. The increase in general cargo tonnage handled
45% by the Port of Virginia between 2012 and
2021.
The Port of Virginia is comprised of four facilities in Hampton
Roads: Norfolk International Terminals (NIT), Newport News The decrease in the amount of coal shipped
Marine Terminal (NNMT), Portsmouth Marine Terminal (PMT), 41% through Hampton Roads from 2012 to 2021.
and the Virginia International Gateway (VIG) facility. The
Virginia Port Authority also manages the Port of Richmond and The rank of the Port of Virginia among East
operates an inland port facility near Front Royal. In addition,
there are a number of private terminals in the region, such as
3rd Coast ports in the volume of containerized cargo
handled in 2021. Nationally, the Port of Virginia
Lambert’s Point Docks and Elizabeth River Terminals. ranked 6th highest.
GENERAL CARGO TONNAGE HANDLED BY THE PORT OF
VIRGINIA, 2012-2021
26,000
24,000
GENERAL CARGO TONNAGE (thousands)
22,000
20,000
18,000
16,000
14,000
VIRGINIA INTERNATIONAL GATEWAY Image Source: VPA
12,000
10,000
Hampton Roads continues to be the largest exporter of coal in 8,000
the country. Nearly 30 million tons of coal were shipped 6,000
through the region in 2021. The amount of coal shipped 4,000
through Hampton Roads has fluctuated over the last decade 2,000
0
between 22 million tons in 2016 and 51 million tons in 2013. 2012 2013 2014 2015 2016 2017 2018 2019 2020 2021
This fluctuation is largely due to the cost competitiveness of Data source: Virginia Port Authority. Data does not include Virginia Inland Port tonnage.
American coal compared to other countries.
THE STATE OF TRANSPORTATION IN HAMPTON ROADS - 2022 11PORT DATA (continued)
Over 25 million tons of general cargo, primarily transported in GENERAL CARGO (in TEUs) HANDLED AT TOP EAST COAST
containers, was handled by the Port of Virginia in 2021. This PORTS, 2012-2021
level of cargo was easily a record handled by the Port of
10,000,000
Virginia, and is 45% higher than the amount handled by the NY / NJ Savannah
9,000,000 HAMPTON ROADS Charleston
Port in 2012. Jacksonville Miami
8,000,000
Port Everglades Baltimore
The maritime industry also measures containerized cargo using 7,000,000
a standard called “20-foot container equivalent units”, or TEUs. 6,000,000
TEUs
The Port of Virginia handled over 3.5 million TEUs in 2021. 5,000,000
This is up 67% from 2.1 million TEUs handled in 2012. The Port 4,000,000
of Virginia ranked third highest among East Coast ports in the 3,000,000
volume (in terms of TEUs) of containerized cargo handled in 2,000,000
2021, and had the highest growth rate among these East Coast 1,000,000
ports from 2020 to 2021. 0
In 2021, 63% of the general cargo handled by the Port of Data sources: American Association of Port Authorities, various port facilities. TEUs are twenty-foot container equivalent units, a common method of
measuring freight.
Virginia arrived or departed by truck, 33% by rail, and 4%
NEW DEVELOPMENTS
Capital Improvements – Work was recently completed on a number of major projects at The Port of
Virginia, including:
NIT - Rail improvements and converting the South Yard to automated rail-mounted gantry cranes
that allow the facility to handle 700,000 more TEUs annually were completed in 2020. The new
North Gate semi-automated gate complex that connects NIT directly to the Intermodal Connector
was completed in 2017. Work is currently underway on an expansion of the Central Rail Yard, NIT CENTRAL RAIL YARD EXPANSION
with completion expected in 2024. Image Source: VPA
VIG – The Phase II Expansion project was completed in 2019, which includes an extended berth with new cranes, additional truck
gates, and new container and rail yards. These improvements allow VIG to handle over one million more TEUs annually.
Wider, Deeper, Safer – In order to better accommodate the larger ships that have arrived in recent years, the Port of Virginia has
planned the “Wider, Deeper, Safer” project which will deepen the channels from 50 feet to 55 feet and widen the channels to allow for
two-way traffic of ultra-large container vessels. Work began on deepening the western side of the Thimble Shoal Channel, which leads
into the Norfolk Harbor, in December 2019 and is expected to be complete in 2024.
THE STATE OF TRANSPORTATION IN HAMPTON ROADS - 2022 12PORT DATA (continued)
MODE SPLIT OF GENERAL CARGO HANDLED BY THE BEHIND THE NUMBERS
PORT OF VIRGINIA, 2012-2021
Image Source: VPA
100% The ships calling at the Port of
90% Truck Virginia have gotten much
80% Rail larger in recent years, largely
Barge
70% due to the widening of the
MODE SHARE
60%
Panama Canal. In July 2016
the first ship with a capacity of
50%
10,000 TEUs arrived at the
40%
port, but only ten months later, CMA-CGM THEODORE ROOSEVERLT
30%
a 13,000 TEU ultra-large container vessel – The Cosco
20%
Development – called at the Port. In August 2017 the 14,400
10%
TEU CMA-CGM Theodore Roosevelt visited VIG, followed by
0% many other 14,000+ TEU ships. In September 2020, a 15,300
2012 2013 2014 2015 2016 2017 2018 2019 2020 2021
Data source: Port of Virginia. TEU ship – the CMA-CGM Brazil – called at the Port.
by barge. The share of freight moved by rail through the Port Hampton Roads and the Port of Virginia are well-positioned to
of Virginia has increased, up from 28% in 2010. handle these larger ships. Shipping channels in the Hampton
Roads harbor are currently dredged to a depth of 50 feet,
HRTPO conducts a number of freight planning efforts such as the which, along with no overhead restrictions, currently allows for
Regional Freight Study to better understand the movement of the largest ships in the world to use the Port of Virginia. In
freight and its impacts on the region. More information is addition, the Port is in the process of widening and deepening
available at http://www.hrtpo.org/page/freight. the channels to 55 feet to allow for two-way traffic of ultra-
The cruise industry also has a presence in Hampton Roads, with large container vessels, which is deeper than any other East
cruises calling at the Decker Half Moone Cruise Center in Coast port.
Norfolk. Although cruises were temporarily paused during the The recently completed improvements to Norfolk International
pandemic, Norwegian Cruise Lines and Carnival Cruise Lines Terminals and the Virginia International Gateway complex will
are offering cruises from Norfolk as a home port in 2022. A also help the Port of Virginia handle this expected growth.
total of 25 visits with up to 180,000 passengers are expected Both NIT and VIG can each now handle over 2 million TEUs
to sail from Norfolk in 2022, with additional cruises planned for annually, which is above the 3.5 million TEUs that were handled
future years. in total by the Port of Virginia in 2021.
THE STATE OF TRANSPORTATION IN HAMPTON ROADS - 2022 13PORT DATA (continued)
COVID-19 IMPACTS
Although ports, including the Port of Virginia, initially MONTHLY GENERAL CARGO (in TEUs) HANDLED BY THE
experienced decreases in cargo volumes during the COVID- PORT OF VIRGINIA, 2019 - 2022
19 pandemic, volumes have rebounded and are now 400,000
GENERAL CARGO TONNAGE (thousands)
significantly higher than they were prior to the pandemic.
300,000
Cargo volumes (in terms of TEUs) handled by the Port of
Virginia decreased slightly at the start of the pandemic but
had surpassed the previous year’s volumes by September 200,000
2020, and have continued to increase throughout 2021 and 2019
2022. The volumes handed by the Port were 20% higher in 2020
100,000
2021 than they were in 2019, and in October 2022, cargo 2021
2022
volumes were 19% higher than they were in October 2019.
0
The increase in volumes at the Port of Virginia was larger in
2022 than those experienced at other East Coast Ports. The Data source: Virginia Port Authority. Data does not include Virginia Inland Port tonnage.
Port of Virginia experienced a 26% increase in TEUs in the
first ten months of 2022 compared to the same period in
MONTHLY CHANGE IN GENERAL CARGO (in TEUs) AT TOP
2019. By comparison, other East Coast Ports experienced a
EAST COAST PORTS, 2019 to 2022
22% increase in TEUs during the same time period. 40%
Hampton Roads
35% Other East Coast Ports
30%
25%
CHANGE IN TEUs 20%
15%
10%
5%
0%
-5%
-10%
Jan Feb Mar Apr May Jun Jul Aug Sep Oct
Data source: Virginia Port Authority, various port facilities.
THE STATE OF TRANSPORTATION IN HAMPTON ROADS - 2022 14RAIL TRAVEL
There are multiple passenger rail travel options in
Hampton Roads, with Amtrak service provided to both the NOTABLE RAIL TRAVEL NUMBERS
Peninsula and the Southside and the Tide light rail line in
Norfolk. The decrease in the number of passengers that
boarded or departed Amtrak trains in Hampton
16% Roads between Federal Fiscal Years 2012 and
A number of passenger rail options are available in Hampton
Roads. Amtrak service is available on the Peninsula, and in 2021.
late 2012 Amtrak began providing direct service to the
Southside. A year earlier the Tide, a 7.4-mile light rail line The decrease in the number of crashes at
operated by Hampton Roads Transit (HRT), began operation in 14 highway-rail crossings in Hampton Roads from
the City of Norfolk (the Tide is addressed in the Public the 2002-2011 time period to the 2012-2021
Transportation section of this report.) period.
TOTAL PASSENGERS BOARDING OR DEPARTING AMTRAK
TRAINS IN HAMPTON ROADS, FFY 2012-2021
240,000
220,000
200,000
180,000
TOTAL PASSENGERS
160,000
140,000
120,000
AMTRAK STATION IN WILLIAMSBURG Image Source: Amtrak
100,000
80,000
The number of passengers using Amtrak service in Hampton 60,000
Norfolk
Roads had largely remained flat over the last decade prior to 40,000
Williamsburg
the pandemic. There were a total of 163,500 passengers who 20,000 Newport News
boarded or departed Amtrak trains in Hampton Roads in 0
2012 2013 2014 2015 2016 2017 2018 2019 2020 2021
Federal Fiscal Year (FFY) 2021, with 71,900 passengers at the
Data source: Amtrak. Federal Fiscal Years run from October to September.
Newport News station, 28,400 passengers at the Williamsburg
THE STATE OF TRANSPORTATION IN HAMPTON ROADS - 2022 15RAIL TRAVEL (continued)
station, and 63,200 passengers at the Norfolk station. The TOTAL CRASHES AND INJURIES/FATALITIES AT HIGHWAY-
number of passengers boarding or departing Amtrak trains in RAIL CROSSINGS IN HAMPTON ROADS, 2012-2021
Hampton Roads increased 21% between FFY 2020 and 2021, 16
but remain 24% below the levels seen in 2019. Total Crashes
ANNUAL CRASHES & INJURIES/FATALITIES
14 Total Injuries/Fatalities
With the number of freight and passenger trains crossing the 12
region each day, ensuring the safety of highway-rail crossings
10
is a necessity (and the reason why HRTPO is currently
conducting a regional rail crossing study.) There were nine 8
crashes between trains and vehicles at highway-rail crossings in 6
Hampton Roads in 2021, resulting in two injuries and no
4
fatalities. Between 2012 and 2021, there were 72 crashes at
highway-rail crossings in Hampton Roads, resulting in 7 2
fatalities and 32 injuries. The number of crashes at Hampton 0
Roads highway-rail crossings has greatly decreased, down 2012 2013 2014 2015 2016 2017 2018 2019 2020 2021
from 184 crashes in the 1990s and 102 crashes in the 2000s. Data source: Federal Railroad Administration.
NEW DEVELOPMENTS
Passenger Rail Improvements – In July 2022 Amtrak expanded passenger rail service to the Southside from two to three trains per
day. This additional service was assisted by an agreement signed in 2021 by the Governor where the Commonwealth of Virginia will
purchase 223 miles of track and 386 miles of right-of-way from CSX. This agreement will help separate freight and passenger rail
traffic to improve service levels, allow the potential to expand rail to all parts of Virginia, double state-supported Amtrak trains to
provide nearly hourly service in some sections of the state, increase Virginia Railway Express commuter service by 60%, and lay the
foundation for the Southeast High Speed Rail Corridor.
Newport News Multimodal Station – Ground breaking for a new multi-modal station near Bland
Boulevard in the City of Newport News occurred on July 21, 2020. The station will replace the
current Amtrak station near Mercury Boulevard and include new inter-city bus service, additional
parking, and improved connections including HRT, shuttles to the Newport-News Williamsburg
airport, and taxi service. Construction on the $47 million facility is expected to be complete by the
fall of 2023.
THE STATE OF TRANSPORTATION IN HAMPTON ROADS - 2022 16RAIL TRAVEL (continued)
COVID-19 IMPACTS
Similar to the airline industry, passenger rail travel was one RIDERSHIP ON AMTRAK TRAINS, ROUTE 46 (NORFOLK)
of the transportation sectors most impacted by COVID-19. AND ROUTE 47 (NEWPORT NEWS) COMBINED, 2019 - 2022
90,000
However, rail ridership has rebounded in Hampton Roads to
80,000 2019
surpass the levels seen prior to the pandemic. 2020
70,000 2021
At the three Amtrak stations in Hampton Roads – Newport 60,000 2022
TOTAL RIDERSHIP
News, Norfolk, and Williamsburg – ridership plummeted
50,000
throughout the spring of 2020, down to only 1,095
40,000
passengers using Amtrak in Hampton Roads in April 2020.
This was a 94% decrease from the ridership seen in April 30,000
2019. In addition, service was reduced on both lines that 20,000
serve Hampton Roads from two daily round trips down to 10,000
one in April 2020. Service was returned to two daily round 0
trips per day on both lines in September 2020, and a third
daily trip from Norfolk was added in July 2022. Data sources: Amtrak, Virginia DRPT.
Ridership increased from those lows throughout 2020 and MONTHLY CHANGE IN AMTRAK RIDERSHIP
increased significantly throughout 2021 and 2022. By June 2019 to 2022
2022, volumes had exceeded the levels seen in the same 40%
30%
month in 2019. In the most recent month of data, regional
20%
ridership in September 2022 was 30% higher than ridership
10%
in the same month in 2019.
CHANGE IN RIDERSHIP
0%
Changes in Amtrak ridership in Hampton Roads have been -10%
-20%
better than the changes in national ridership. National
-30%
ridership as of September 2022 was still 15% below the
-40%
level seen nationwide in September 2019. This compares to
-50%
the 30% increase in Amtrak passengers experienced in -60% Hampton Roads
Hampton Roads from September 2019 to September 2022. -70% National
-80%
Jan Feb Mar Apr May Jun Jul Aug Sep
Data sources: Amtrak, Virginia DRPT.
THE STATE OF TRANSPORTATION IN HAMPTON ROADS - 2022 17BRIDGES
The large number of rivers, bays, and streams makes
bridges a prominent part of the Hampton Roads NOTABLE BRIDGE NUMBERS
transportation network. Adequately funding the
maintenance of these structures, however, will be difficult The percentage of bridges in Hampton Roads
as bridges in Hampton Roads continue to age. 3.2% that were classified as structurally deficient as of
August 2022.
Bridges are a vital component of the Hampton Roads The percentage of bridges in Hampton Roads
transportation network. Major spans such as the Hampton 9% that are at least 70 years old as of 2022.
Roads Bridge-Tunnel, Monitor-Merrimac Memorial Bridge-
Tunnel, Coleman Bridge, James River Bridge, and High Rise Hampton Roads rank among 41 large
Bridge provide a connection between distinct areas of the
region. Bridges on the Interstate system create a limited-access 32nd metropolitan areas with populations between
one and four million people in terms of the
network designed to improve mobility throughout the region, percentage of structurally deficient bridges.
while smaller structures such as culverts span the myriad of
creeks, swamps, and streams in the region.
There are 1,268 bridges* in Hampton Roads. These important BRIDGES IN HAMPTON ROADS BY YEAR BUILT
components of the roadway network, however, are aging. The
median age of bridges in Hampton Roads is currently 43 years 2010+
9% Pre-1950
old, and 114 bridges (9%) are at least 70 years old. 8% 1950-1959
2000-2009 7%
All bridges in Hampton Roads are inspected regularly by 8%
qualified inspectors. Depending on the condition and design of
each bridge, these inspections occur at intervals of two years or 1960-1969
1990-1999 19%
less. Based on these inspections, bridges may be classified as 17%
“structurally deficient”, which are structures with elements that
need to be monitored and/or repaired. Structurally deficient
bridges typically need to be rehabilitated or replaced to 1980-1989 1970-1979
address deficiencies. It must be noted, however, that 15% 17%
structurally deficient bridges are not necessarily unsafe.
* - Bridges are defined by the National Bridge Inventory as any structure that carries or spans vehicular traffic Data sources: VDOT, FHWA. Data as of August 2022.
on a public roadway and has a length of more than 20 feet. Bridges less than or equal to 20 feet in length are
not included in these statistics, nor are bridges on military bases and private property.
THE STATE OF TRANSPORTATION IN HAMPTON ROADS - 2022 18BRIDGES (continued)
Bridge inspectors will close or impose weight limits on any STRUCTURALLY DEFICIENT BRIDGES IN HAMPTON ROADS,
bridge that is judged to be unsafe. 2013-2022
100
There were 40 bridges (3.2%) that were classified as
90
structurally deficient in Hampton Roads as of August 2022.
STRUCTURALLY DEFICIENT BRIDGES
80
Not only is this down from 79 bridges (6.3%) that were
classified as structurally deficient in 2013 but the number has 70
decreased nearly every year since 2014 when 80 bridges 60
(6.6%) in the region were classified as structurally deficient. 50
40
The percentage of bridges that are classified as structurally
30
deficient in Hampton Roads is better than the percentage in
20
many other comparable metropolitan areas. Hampton Roads
10
ranks 32nd highest among 41 large metropolitan areas with
populations between one and four million people in the 0
2013 2014 2015 2016 2017 2018 2019 2020 2021 2022
percentage of structurally deficient bridges in each region.
Data sources: VDOT, FHWA. Data as of August 2022.
NEW DEVELOPMENTS
High Rise Bridge – The new parallel High Rise Bridge was opened to I-64 traffic
traveling towards Virginia Beach in July 2022. The new 100-foot high fixed span is
located just to the south of the existing facility, which will remain in use for traffic
traveling towards Suffolk. Completion of the I-64 project is expected to occur by
early 2023.
Image Source: VDOT.
Statewide Special Structures – There are many large and unique bridge and tunnel structures located
throughout Virginia, and in particular in the Hampton Roads region. VDOT has identified 25 Special
Structures throughout the Commonwealth that are tunnels, movable bridges, or large and complex
structures. A special fund was created by legislation to rehabilitate/replace, operate, and maintain
17 of these structures that are not currently covered by existing contracts or ongoing projects, of which
Image Source: VDOT. 7 are located in Hampton Roads. The fund will provide $585 million to Special Structures for Fiscal
Years 2023 – 2028.
THE STATE OF TRANSPORTATION IN HAMPTON ROADS - 2022 19BRIDGES (continued)
However, Hampton Roads ranks much lower STRUCTURALLY DEFICIENT BRIDGES –
in terms of the percentage of bridges that LARGE METROPOLITAN AREAS
are classified in “Good” condition using 20%
% STRUCTURALLY DEFICIENT BRIDGES
federal standards. At 31.0%, Hampton 18%
Roads ranks 9th lowest among the 41 16%
comparable metropolitan areas between one 14%
and four million people in terms of the 12%
percentage of bridges classified as being in 10%
good condition. 8%
6%
4%
2%
0%
Data sources: FHWA, VDOT. FHWA data as of 2021, Hampton Roads (VDOT) data as of August 2022.
BRIDGES IN GOOD CONDITION – LARGE METROPOLITAN AREAS
LESNER BRIDGE Image Source: City of Va Beach
90%
80%
HRTPO released an update to the Hampton
% BRIDGES IN GOOD CONDITION
Roads Regional Bridge Study – which looks at 70%
various aspects of the region’s bridges – in 60%
2018. The Hampton Roads Regional Bridge 50%
Study is available on HRTPO’s website at 40%
http://www.hrtpo.org. 30%
20%
10%
0%
Data sources: FHWA, VDOT. FHWA data as of 2021, Hampton Roads (VDOT) data as of August 2022.
THE STATE OF TRANSPORTATION IN HAMPTON ROADS - 2022 20PAVEMENT CONDITION
VDOT’s pavement rehabilitation efforts have greatly
improved the condition of state-maintained roadways in NOTABLE PAVEMENT CONDITION NUMBERS
Hampton Roads, but pavement in the region is generally in
worse condition than in other areas of the Commonwealth. Percent of interstate lane-miles in Hampton Roads
0.4% that were in poor condition in 2021. This is down
from 2.1% in 2017.
VDOT annually prepares the State of the Pavement report,
which details the condition and ride quality of state-maintained
roadways. VDOT produces this report using data collected Percent of non-interstate National Highway
annually on each mile of Interstate and Primary roadway 2.1% System (NHS) lane-miles in Hampton Roads that
throughout the state and a sample of Secondary roadways. had a poor pavement condition in 2021. This is
Based on this data, VDOT categorizes both the pavement down from 4.0% in 2020.
condition and ride quality of Virginia roadways.
Pavement condition describes the amount of pavement
distresses – such as cracking, patching, and rutting – on each
roadway. The Critical Condition Index (CCI) is a measure that
is calculated based on these distresses, and pavement condition PERCENT OF INTERSTATE AND NON-INTERSTATE NHS
is rated as excellent, good, fair, poor, or very poor based on ROADWAY PAVEMENT IN POOR CONDITION IN HAMPTON
ROADS, 2017-2021
the CCI. Roadways that are in poor or very poor condition are 10%
considered to be deficient, and VDOT has a goal that no more
9% Poor Interstate Lane-Miles
than 18% of Interstate and Primary roadway pavement Poor Non-Interstate NHS Lane-Miles
8%
PERCENT IN POOR CONDITION
condition be classified as deficient.
7%
The percentage of roadways in poor condition in Hampton 6%
Roads has greatly improved in recent years. As recently as 5%
2010, more than one third of state-maintained Interstate and 4%
Primary roadways in Hampton Roads had a deficient 3%
pavement condition. As of 2021 only 0.4% of Interstate 2%
mileage and 2.1% of non-interstate National Highway System 1%
(NHS) mileage in the Hampton Roads TPO had a poor 0%
pavement condition. 2017 2018 2019 2020 2021
Data source: VDOT.
THE STATE OF TRANSPORTATION IN HAMPTON ROADS - 2022 21PAVEMENT CONDITION (continued)
While the percentage of pavement in poor condition has PERCENT OF INTERSTATE PAVEMENT IN POOR CONDITION
improved in Hampton Roads, the percentage of pavement in BY VIRGINIA MPO, 2021
good condition has decreased. The percentage of interstate 5%
mileage in Hampton Roads with pavement in good condition
% POOR PAVEMENT CONDITION
decreased from 54% in 2017 down to 51% in 2021. The 4%
percentage of non-interstate NHS in good condition also
decreased, from 20% in 2017 to 14% in 2021. 3%
2%
1%
0%
Data source: VDOT.
PERCENT OF NON-INTERSTATE NATIONAL HIGHWAY
SYSTEM (NHS) PAVEMENT IN POOR CONDITION, 2021
NORFOLK REPAVING Image Source: City of Norfolk 5%
% POOR PAVEMENT CONDITION
4%
The pavement condition in Hampton Roads is in worse condition
than in other areas of the state. At 0.4%, the percentage of
3%
interstate pavement in poor condition in 2021 is higher than in
every other MPO throughout the state other than the Tri-Cities. 2%
In terms of the non-interstate NHS, the percentage of pavement
in poor condition in 2021 is higher in Hampton Roads (2.1%) 1%
than every other metropolitan area throughout Virginia.
0%
Data source: VDOT.
THE STATE OF TRANSPORTATION IN HAMPTON ROADS - 2022 22PAVEMENT CONDITION (continued)
Another source of pavement condition data is produced by the PAVEMENT CONDITION IN HAMPTON ROADS,
TRIP National Transportation Research Nonprofit, which is an 2006-2016
organization that researches, evaluates and distributes 100%
economic and technical data on surface transportation issues. 90%
TRIP regularly prepares an analysis of the pavement condition
PERCENT PAVEMENT CONDITION
80%
of major roadways in metropolitan areas and the costs that 70%
deteriorating roadways have on the public. 60%
50%
According to the most recent analysis from TRIP, 32% of the 40%
major roadways in Hampton Roads had pavement that was in 30%
poor condition in 2016. Another 30% of Hampton Roads 20%
roadways were rated as mediocre, 17% were rated as fair, 10%
and 22% were rated as good. The percent of pavement in 0%
poor condition in Hampton Roads was higher in 2016 than it 2006 2008 2011 2013 2014 2016
was at any point throughout the previous Poor Mediocre Fair Good
decade according to TRIP. Data source: TRIP. Data only includes Interstates, freeways, and other principal arterials.
Among the 41 large metropolitan areas PERCENT OF ROADWAYS WITH PAVEMENT IN POOR CONDITION,
with populations between one and four LARGE METROPOLITAN AREAS, 2016
million people, Hampton Roads ranked 16th 70%
highest in terms of the percentage of
% OF PAVEMENT IN POOR CONDITION
60%
roadways with pavement in poor condition
in 2016. San Jose had more than twice the 50%
percentage of major roadways in poor 40%
condition than Hampton Roads.
30%
20%
10%
0%
Data source: TRIP. Data only includes Interstates, freeways, and other principal arterials.
THE STATE OF TRANSPORTATION IN HAMPTON ROADS - 2022 23ROADWAY USAGE
After reaching record levels, roadway travel levels in
Hampton Roads have been greatly impacted by the COVID- NOTABLE ROADWAY USAGE NUMBERS
19 pandemic. Roadway travel levels, however, have nearly
recovered to pre-pandemic levels. The decrease in daily roadway travel in
3% Hampton Roads between 2012 and 2021
according to VDOT estimates.
The amount of roadway travel is measured in terms of vehicle-
miles of travel, which is the total number of miles every vehicle The change in the amount of daily roadway travel
in the region travels over a period of time. VDOT annually 1% in Hampton Roads between 2012 and 2021
releases estimates of jurisdictional roadway travel levels based based on regional continuous count stations.
on traffic counts collected on a regular basis. VDOT estimates
Hampton Roads rank among 41 large
that there were 38 million vehicle-miles of travel (VMT) on the 28
31stth metropolitan areas with populations between
typical day in Hampton Roads in 2021.
one and four million people in terms of vehicular
travel per capita in 2020.
DAILY VEHICLE-MILES OF TRAVEL (VMT)
IN HAMPTON ROADS, 2012-2021
45,000,000
40,000,000
35,000,000
30,000,000
DAILY VMT
25,000,000
20,000,000
WESTERN FREEWAY APPROACHING THE MIDTOWN TUNNEL Image Source: HRTPO 15,000,000
10,000,000
The amount of roadway travel was increasing in Hampton
Roads prior to the pandemic according to VDOT estimates. 5,000,000
Between 2014 and 2019, there was a 7% increase in daily 0
2012 2013 2014 2015 2016 2017 2018 2019 2020 2021
vehicular travel in Hampton Roads. However, roadway travel Data source: VDOT.
THE STATE OF TRANSPORTATION IN HAMPTON ROADS - 2022 24ROADWAY USAGE (continued)
in the region decreased due to the pandemic, with a 12% CHANGE IN VEHICLE-MILES OF TRAVEL IN HAMPTON
decrease in regional roadway travel between 2019 and ROADS, VIRGINIA, AND THE UNITED STATES, 2012 TO 2021
2020. Roadway travel increased 4% from 2020 to 2021, but
is still below the pre-pandemic levels.
Hampton Roads -3.2%
Similar to Hampton Roads, both Virginia and the United States
experienced a decrease in roadway travel due to the COVID-
19 pandemic. Between 2014 and 2019, roadway travel grew
by 5.5% in Virginia and 7.5% across the country. Roadway Virginia 1.4%
travel decreased by 11% in Virginia between 2019 and 2020
before increasing 8% from 2020 to 2021. Across the country
roadway travel decreased 14% from 2019 to 2020 before
increasing 14% from 2020 to 2021. United States 8.9%
The vehicular travel per capita in Hampton Roads was 22.2
vehicle-miles per person per day in 2021, down 8.2% from -4% -2% 0% 2% 4% 6% 8% 10%
Data sources: VDOT, FHWA Highway Statistics.
24.2 daily vehicle-miles per capita in 2019
and down 4.9% from 23.4 per day in DAILY VEHICLE-MILES OF TRAVEL PER CAPITA
2012. IN LARGE METROPOLITAN AREAS, 2020
55
Among 41 large metropolitan areas in the 50
United States with populations between one 45
and four million people, Hampton Roads 40
DAILY VMT PER CAPITA
ranked 28th highest in vehicular travel per 35
capita in 2020. Nashville experienced 30
25
roadway travel levels that were more than
20
twice the levels seen in Hampton Roads, and
15
areas such as Birmingham, Charlotte and 10
Indianapolis had at least 10 more miles of 5
travel daily per capita than Hampton 0
Roads.
Data source: FHWA Highway Statistics.
THE STATE OF TRANSPORTATION IN HAMPTON ROADS - 2022 25You can also read