STORMWATER MANAGEMENT QUANTITY AND QUALITY STANDARDS AND COMPUTATIONS
←
→
Page content transcription
If your browser does not render page correctly, please read the page content below
5. STORMWATER MANAGEMENT QUANTITY AND
QUALITY STANDARDS AND COMPUTATIONS
This chapter discusses the fundamentals of computing stormwater runoff rates and volumes from rainfall
using various mathematical methods. To do so effectively, the chapter also describes the fundamentals
of the rainfall-runoff process that these methods attempt to simulate. Guidance is also provided in the
use of the Natural Resources Conservation Service (NRCS) method, the Rational Method and the Modified
Rational Method that are specifically required by the NJDEP Stormwater Management rules at N.J.A.C.
7:8 et seq.

Fundamentals of Stormwater Runoff
In general, stormwater runoff can be described as a by-product of the interaction of rainfall with the land.
This interaction is one of several processes that the earth’s water may go through as it continually cycles
between the land and the atmosphere. This cyclical process is scientifically known as the hydrologic cycle.
Stormwater runoff is only one of many forms water may take. Figure 5-1 below depicts the primary forms
that water can take during the hydrologic cycle and the various processes that produce these forms. In
addition to runoff, these processes include precipitation, evaporation from surfaces or the atmosphere,
evapotranspiration by plants and infiltration into the soil and or groundwater. As such, water that
precipitates as rainfall can wind up, or at least spend time, on ground or plant surfaces, in the atmosphere,
within the various soil layers or in waterways and water bodies.

 Figure 5-1: The Hydrologic Cycle

 Source: Fundamentals of Urban Runoff Management.

New Jersey Stormwater Best Management Practices Manual April 2021
Chapter 5: Stormwater Management Quantity and Quality Standards and Computations Page 1
The physical processes that convert rainfall to runoff are both complex and highly variable. As such, these
processes cannot be replicated mathematically with exact certainty. However, by making simplifying
assumptions and using empirical data, there are several mathematical models and equations that can
simulate these processes and predict resultant runoff volumes and rates with acceptable accuracy. Before
any of the computation methods can be discussed, it is necessary to define two terms used extensively
throughout this chapter.

 Time of concentration – As defined in N.J.A.C. 7:8-2.4(g)4, time of concentration is the time it
 takes for runoff to travel from the hydraulically most distant point of the drainage area to the
 point of interest within a watershed.

 Hydrograph – In the context of a stormwater runoff analysis, the graph depicting the flow rate of
 runoff versus the time passed at a specific point of analysis is a hydrograph. A hydrograph can
 provide much information about stormwater runoff, including the time of concentration, the time
 at which peak flow occurs, the peak flow rate and the volume of runoff generated.

In general, all runoff computation methods are mathematical expressions attempting to replicate the
hydrologic cycle. Many hydrological models have been developed to compute the flow rate or volume
of the runoff from an individual event. However, the Stormwater Management rules at N.J.A.C. 7:8-5.7
allow only the following three modeling methodologies to be used, and each will be discussed, including
any drainage area limitations, in later sections of the chapter:

 1. The USDA Natural Resources Conservation Service (NRCS) methodology, including the NRCS
 Runoff Equation and Dimensionless Unit Hydrograph as described in Chapters 7, 9, 10, 15 and 16,
 Part 630 Hydrology, National Engineering Handbook (NEH), may be used for the computation of
 runoff volume, peak flow rate of runoff and hydrograph of runoff resulting from specific
 precipitation depths. This methodology was previously described in Technical Release 55--Urban
 Hydrology for Small Watersheds (TR-55), dated June 1986; however, it has been superseded by
 the aforementioned chapters of the NEH. Information regarding the NEH, Part 630 Hydrology, is
 available from the United States Department of Agriculture website at:

 https://directives.sc.egov.usda.gov/viewerFS.aspx?hid=21422 or

 at United States Department of Agriculture Natural Resources Conservation Service, 220 Davison
 Avenue, Somerset, New Jersey 08873.

 2. The Rational Method may be used for the computation of peak flow rate under specific rainfall
 intensity.

 3. The Modified Rational Method may be used for hydrograph computations, which can be further
 utilized for the computation of runoff volume for a specific rainfall intensity and the required
 storage volume of a detention BMP. The modified rational method is discussed further online at:

 http://www.nj.gov/agriculture/divisions/anr/pdf/2014NJSoilErosionControlStandardsCompl
 ete.pdf.

New Jersey Stormwater Best Management Practices Manual April 2021
Chapter 5: Stormwater Management Quantity and Quality Standards and Computations Page 2
Predicting Storm Events Even though precipitation events are, by nature, random in their duration and rainfall depths, historical data shows that large storm events occur less frequently than small storm events. No one can predict exactly when a certain size storm event will occur. However, through a frequency analysis of rainfall depths and intensities from past precipitation events, one can determine the likelihood of a storm occurrence using probability analysis. The rainfall depth and intensity of past precipitation events are sorted into a probability distribution that gives the likelihood of the occurrence of different sized events. For example, a storm event producing a rainfall depth of 3.5 inches or greater has about a 50% chance of happening in a given year whereas a storm event with a rainfall depth of 8.5 inches or greater that has only a 1% chance of occurring in the same given year. The probability of the occurrence of a certain size of storm event can be alternatively expressed as a recurrence interval, which is the inverse of the probability. For example, the recurrence interval of a rainfall event that has a 50% chance of occurrence in a given year is expressed as the 2-year (= 100 ÷ 50) recurrence interval, which is also known as the 2-year storm. For a storm event with a 1% chance of occurrence, it has a 100-year (= 100 ÷ 1) recurrence interval and is referred to as the 100-year storm. Referring to a precipitation event as the “X-year storm” does not mean that this storm can only happen once every X years. Nor does it mean that a larger storm event cannot also occur that year. The table below lists the probability of a particular occurrence and its corresponding chance of occurring, expressed as a percentage, in a single year. Recurrence Intervals and Probabilities of Occurrences Recurrence Interval, Probability of Occurrence Percent Chance of Occurrence in years in any Given Year in any Given Year 100 1 in 100 1 50 1 in 50 2 25 1 in 25 4 10 1 in 10 10 5 1 in 5 20 2 1 in 2 50 New Jersey Stormwater Best Management Practices Manual April 2021 Chapter 5: Stormwater Management Quantity and Quality Standards and Computations Page 3
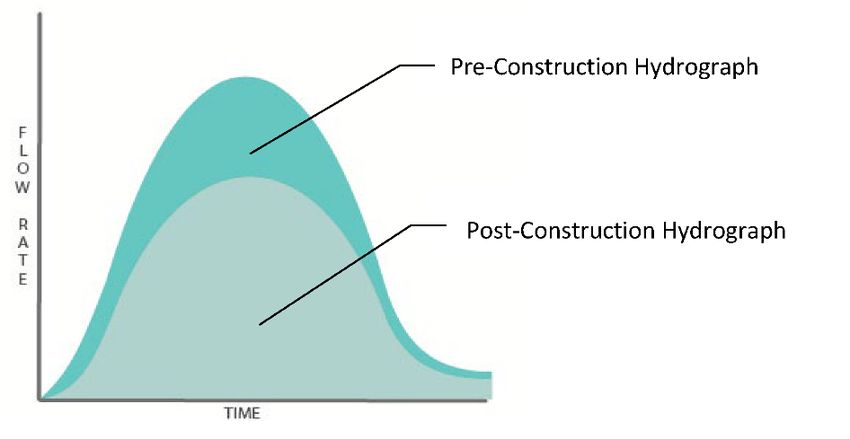
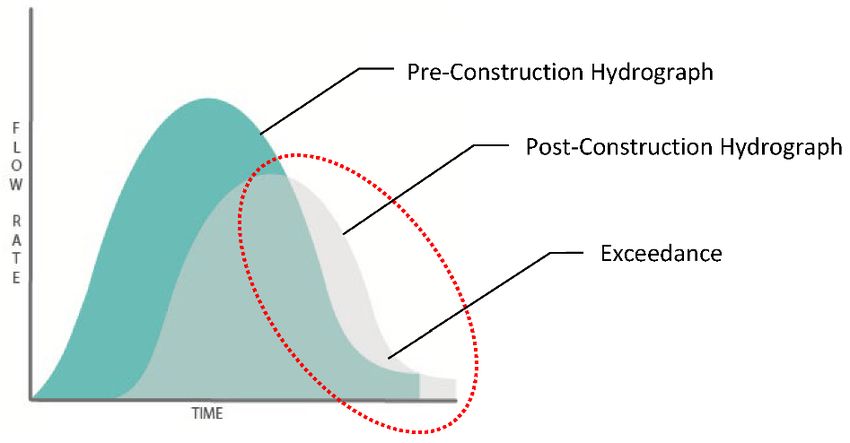
Another aspect of the frequency analysis is the duration of rainfall events. The frequency analysis may
use the rainfall depths observed in events having various durations of precipitation, such as 1 hour, 6
hours, or even 3 days, although a 24-hour duration is typically used.

There are many organizations that collect and publish hydrological data, such as National Oceanic and
Atmospheric Administration’s (NOAA) National Weather Service (NWS). NOAA’s NWS publishes and
updates hydrological data and frequency analysis of rainfall depth and intensity constantly, under normal
operating conditions. The National Engineering Handbook (NEH) produced by the NRCS uses NWS data
due to its availability and lengths of record. Therefore, in this chapter, NWS data is referenced in the
calculations involving the rainfall depths and intensities for the 2-, 10- and 100-year storm events. A more
detailed discussion of using NWS data is found beginning on Page 12.

Regulatory Requirements of the Stormwater Management Rules
The Stormwater Management rules set forth stormwater runoff quantity, stormwater runoff quality and
groundwater recharge standards for stormwater runoff generated by major developments as defined in
N.J.A.C. 7:8-1.2. These projects must demonstrate compliance with those standards, as follows.

Stormwater Runoff Quantity Control Design and Performance Standards

In order to control stormwater runoff quantity impacts, the design engineer shall use the assumptions
and factors for stormwater runoff calculations at N.J.A.C. 7:8-5.7(a). Unless the project is granted a
variance pursuant to N.J.A.C. 4.6(a)3.ix, or is exempted pursuant to 5.2(d) or 5.6(b)4, the design engineer
must demonstrate the compliance of the quantity standards in one of the three options in N.J.A.C. 7:8-
5.6(b)1 to 3:

 i. Demonstrate through hydrologic and hydraulic analysis that for stormwater leaving the site, post-
 construction runoff hydrographs for the two-, 10- and 100-year storm events do not exceed, at
 any point in time, the pre-construction runoff hydrographs for the same storm events.

 Below is an illustration demonstrating noncompliance with the requirement under N.J.A.C. 7:8-
 5.6(b)1, followed on the next page by a second image demonstrating compliance:

 Figure 5-2: Post-Construction Hydrograph Exceeds the Pre-construction Hydrograph

New Jersey Stormwater Best Management Practices Manual April 2021
Chapter 5: Stormwater Management Quantity and Quality Standards and Computations Page 4
In the preceding graphic, the peak of the post-construction hydrograph, shown in grey, is lower than the peak of the pre-construction hydrograph, shown in teal, and some points of the post- construction hydrograph lie outside the pre-construction hydrograph, shown within the dashed oval area; therefore, the post-construction hydrograph does not meet the requirements set forth at N.J.A.C. 7:8-5.6(b)1. Figure 5-3: Post-Construction Hydrograph does not Exceed the Pre-construction Hydrograph at any Point In the above graphic, the post-construction hydrograph meets the aforementioned requirement since every point of the post-construction hydrograph is under the pre-construction hydrograph. It is important to note that the area under the hydrograph represents the volume of the stormwater runoff. In order to comply with this option for meeting the stormwater runoff quantity standards, the post-construction runoff volume must be equal to or lower than the pre- construction runoff volume. Otherwise, the post-construction hydrograph will exceed the pre- construction hydrograph at some point. ii. Demonstrate through hydrologic and hydraulic analysis that there is no increase, as compared to the pre-construction condition, in the peak runoff rates of stormwater leaving the site for the two-, 10- and 100-year storm events and that the increased volume or change in timing of stormwater runoff will not increase flood damage at or downstream of the site. This analysis shall include the analysis of impacts of existing land uses and projected land uses assuming full development under existing zoning and land use ordinances in the drainage area. This demonstration requires the following calculations and demonstrations be provided, at a minimum: Calculation of pre- and post-construction conditions for the 2-, 10- and 100-year storms, where post-construction peak flow rates leaving the site must not be higher than the pre- construction peak flow rates leaving the site. A hydrologic and hydraulic analysis of the receiving waterbody, which demonstrates that the increased volume of stormwater runoff and/or change in timing from pre- to post- construction conditions for the 2-, 10- and 100-year storms does not result in increased flood damage at or downstream of the project. This should be conducted for both of the following scenarios: New Jersey Stormwater Best Management Practices Manual April 2021 Chapter 5: Stormwater Management Quantity and Quality Standards and Computations Page 5
□ Pre-construction conditions and post-construction conditions with the project calculations based on the existing land uses. □ Pre-construction conditions and post-construction conditions with the project calculations based on the assumption of full development in the drainage area allowed by existing zoning and land use ordinances. iii. Design stormwater management measures so that the post-construction peak runoff rates for the two-, 10- and 100-year storm events are 50, 75 and 80 percent, respectively, of the pre- construction peak runoff rates. The percentages apply only to the post-construction stormwater runoff that is attributable to the portion of the site on which the proposed development or project is to be constructed. Under the third option, the design engineer may use stormwater management measures, either nonstructural and/or structural, to control the post-construction peak flow rates to be 50, 75 and 80 percent of the pre-construction peak flow rates for the 2-, 10- and 100-year storms, respectively. The methodologies allowed under N.J.A.C. 7:8-5.7 are discussed in the section which begins on Page 9. Applicability of Stormwater Runoff Quantity Control Standards For municipal review under the requirements of the Municipal Separate Storm Sewer System (MS4) permits, the threshold under which a project is considered to meet the definition of major development is dependent upon each municipality’s adopted stormwater management ordinances(s). According to N.J.A.C. 7:8-4.2(a), major development reviewed under Municipal Stormwater Control Ordinances is limited to projects that ultimately disturb one or more acres of land. However, municipal ordinances can be more stringent than the requirements of the Stormwater Management rules, but cannot be less restrictive. The Residential Site Improvement Standards (RSIS), under N.J.A.C. 5:21 et seq., allow municipalities to require stormwater runoff controls for development falling below the major development threshold to address groundwater recharge and stormwater runoff quantity control, but not for stormwater runoff water quality control. In accordance with N.J.A.C. 7:8-5.6(b)4, in tidal flood hazard areas, stormwater runoff water quantity analysis in accordance with N.J.A.C. 7:8-5.6(b)1, 2 and 3 is required unless the design engineer demonstrates through hydrologic and hydraulic analysis that the increased volume, change in timing, or increased rate of the stormwater runoff, or any combination of the three will not result in additional flood damage below the point of discharge of the major development. This provision, however, does not provide a blanket exemption from having to provide stormwater quantity control requirements for the sites located in the tidal flood hazard area. It, instead, requires a demonstration that there are no increases in flood damages below the point of discharge by the increased volume of stormwater runoff before the quantity control requirement stated in N.J.A.C. 7:8-5.6(b)1, 2 and 3 can be waived. □ For example, when a site located in a tidal flood hazard area discharges stormwater runoff directly into a bay, there is no increase of the water level or flood damage below the point of discharge. Therefore, the project is not required to meet the stormwater quantity control requirement. New Jersey Stormwater Best Management Practices Manual April 2021 Chapter 5: Stormwater Management Quantity and Quality Standards and Computations Page 6
□ However, if a site located in a tidal flood hazard area will discharge the runoff so that it flows over or past a neighboring property before reaching the tidal water, the stormwater runoff from the site could increase flood damages to the neighboring property. This project will be required to meet the quantity control requirement. □ Similarly, if the stormwater runoff from a site will discharge to a storm sewer or other conveyance, meaning it will flow past or through other properties before reaching the tidal water, the stormwater discharge could increase flood damages below the point of discharge. Under such circumstances, the stormwater runoff quantity control requirement must be satisfied. The demonstration analysis is not required when the stormwater is discharged directly into any ocean, bay, inlet or the reach of any watercourse between its confluence with an ocean, bay or inlet and downstream of the first water control structure. Stormwater runoff from agricultural development meeting the definition of major development must meet the performance standards established in these rules. Development on agricultural land means: any activity that requires a State permit, any activity reviewed by the County Agricultural Boards (CAB) and/or the State Agricultural Development Committee (SADC) and any activity that requires municipal review that is not exempted by the Right to Farm Act, N.J.S.A. 4:1C-1 et seq. This does not conflict with the Right to Farm Act, which recognizes the State's continuing authority to regulate agricultural development at N.J.S.A. 4:1C-9. “Disturbance” means the placement or reconstruction of impervious surface or motor vehicle surface, or exposure and/or movement of soil or bedrock or clearing, cutting, or removing of vegetation. Milling and repaving is not considered disturbance for the purposes of this definition. Milling and/or repaving of an existing impervious surface that will not expose or move soil or bedrock beneath the existing surface do/does not count as disturbance or redevelopment and do/does not trigger the Stormwater Management rules, provided there are no changes to the existing stormwater drainage system. The reconstruction of these areas, however, does constitute disturbance. N.J.A.C. 7:8-5.6(c) requires that the stormwater runoff quantity standards shall be applied at the site’s boundary to each abutting lot, roadway, watercourse or receiving storm sewer system. Stormwater quantity control requirements are applicable to each discharge point leaving the boundary of the development site separately unless the stormwater runoff generated by different areas within the site converge into one discharge point before leaving the development site. Conditions Regarding the Use of Exfiltration in Stormwater Runoff Routing Computations Exfiltration can be used in the design of the small-scale green infrastructure BMPs, as listed in Table 5-1 of N.J.A.C. 7:8-5.3(f). Exfiltration, meaning discharge of runoff into the subsoil, may be included in stormwater runoff routing computations under certain conditions, provided all of the conditions, as outlined below, are satisfied. 1. All soil testing must be fully compliant with Chapter 12: Soil Testing Criteria of this manual. New Jersey Stormwater Best Management Practices Manual April 2021 Chapter 5: Stormwater Management Quantity and Quality Standards and Computations Page 7
2. The design of the BMP must comply with all of the design criteria within the respective subchapter
 of Chapter 9 of the BMP Manual.

 3. Pretreatment, in the form of a forebay or any of the other BMPs found in the BMP Manual, must
 be incorporated into the BMP design, unless specifically stated otherwise in the corresponding
 subchapter of the BMP Manual. This pretreatment requirement does not apply to BMPs with a
 contributory drainage area of 1 acre or less, except when pretreatment is a design requirement
 even without using exfiltration in the routing (such as a subsurface infiltration basin.)

 4. Exfiltration cannot be used in any BMP designed with an underdrain system, since the runoff
 discharged through the underdrain will be discharged to the down-gradient surface water or
 sewer system and will not be infiltrated into the subsoil.

 5. Infiltration of the entire 2-, 10- or 100-year storm is allowed only when:
 a. existing site conditions are such that no runoff leaves the site for the pre-construction
 condition scenario, thereby constraining the design to infiltrate 100% of the volume produced
 by the post-construction condition for the same design storm. In this case, the maximum
 storm that can be entirely infiltrated is the largest storm event with no runoff leaving the site
 in pre-construction conditions, or
 b. the volume of stormwater runoff to be fully infiltrated is required by law or rule implemented
 by the Pinelands Commission, Highlands Council, or any other stormwater review agency with
 jurisdiction over the project.

 6. The analysis of groundwater hydrology and the hydraulic impact due to the exfiltration, required
 pursuant to N.J.A.C. 7:8-5.2(h), must be conducted in conjunction with the design using
 exfiltration. The design soil permeability rate, also referred to herein as the design vertical
 hydraulic conductivity, of the most hydraulically restrictive soil horizon below an infiltration type
 BMP may be used as the exfiltration rate in the routing calculations only when the soil is tested
 strictly in accordance with Chapter 12. This analysis must be performed using the method
 outlined in Chapter 13: Groundwater Table Hydraulic Impact Assessments for Infiltration BMPs.

 7. The runoff volume discarded as exfiltration and the design vertical hydraulic conductivity of the
 most hydraulically restrictive soil horizon below an infiltration BMP must be used, in the initial
 model, to calculate the duration of infiltration period in the groundwater mounding analysis. The
 groundwater mounding analysis has determined that an adverse impact will occur if the resulting
 groundwater mounding reaches the bottom of the BMP or if the temporary localized increase in
 the water table encroaches upon a building or another structure, including any septic systems.
 When an adverse impact is the result, further modifications to the size of the infiltration area of
 the BMP or reductions in the exfiltration rate must be performed until the adverse impacts are
 eliminated. Further, when the groundwater mounding reaches the bottom of the BMP, the
 hydraulic gradient is reduced, thereby reducing the exfiltration rate. To reflect the impact on the
 hydraulic gradient, the reduced exfiltration rate must also be used to re-run the routing
 calculation(s) to check the peak flow rate(s) produced for the respective design storm(s) through
 the proposed outlet structure of the infiltration BMP used to meet the Stormwater Runoff
 Quantity Standards. If adverse impacts cannot be avoided, the infiltration BMP cannot be used.

For additional information on performing the groundwater mounding analysis, see Chapter 13:
Groundwater Table Hydraulic Impact Assessments for Infiltration BMPs of this manual. Examples 5-6 and
5-7, which begin on Page 44, illustrate the methodology to be used.

New Jersey Stormwater Best Management Practices Manual April 2021
Chapter 5: Stormwater Management Quantity and Quality Standards and Computations Page 8
Stormwater Runoff Computation Methods The following is an introduction to the computation methods allowed by the Stormwater Management rules, followed by a brief overview of any limitations an individual method may have and the respective drainage area limits for each of these methods. The chapter will then provide separate detailed discussions, with examples, for each of the methods allowed. Special page headers have been incorporated into this portion of the chapter to indicate the method under discussion. As stated above, for the purposes of managing potential flooding, stormwater runoff quantity and quality, plus groundwater recharge issues, it is essential to calculate the volume and peak flow of the stormwater runoff produced by a storm event. N.J.A.C 7:8-5.7 states the following methods are the only methods acceptable for use in the computation of stormwater runoff: 1. The U.S. Department of Agriculture NRCS methodology, for which the discussion begins on Page 10, and 2. The Rational Method for peak flow, beginning on Page 70, along with the Modified Rational Method for hydrograph computations, beginning on Page 75. The selection of an appropriate method depends upon the limitation(s) of the method under consideration: The NRCS method can provide total stormwater runoff volume, the peak flow rate and produce hydrographs. Under the NRCS method, different synthetic rainfall distributions and unit hydrographs can be applied to produce the stormwater runoff hydrograph in accordance with geographical differences that may affect the rainfall pattern in each storm event and the runoff pattern in a region, depending on whether the topographic slope is steep or flat. Further discussion of rainfall distributions and unit hydrographs are found beginning on Page 17. The Rational Method can be used to produce estimates of peak runoff rates, but it cannot provide total stormwater runoff volumes nor produce hydrographs. The Modified Rational Method can be used for the calculation of runoff volume. Limitations on the size of the drainage area must also be taken into consideration: The NRCS method can be used for a drainage area of any size , but the area is still subject to the N.J.A.C. 7:8-5.7(a)4 requirement that the relative stormwater runoff rates and/or volumes of pervious and impervious surfaces be separately considered to accurately compute the rates and volume of stormwater runoff from the drainage area. The Rational Method and Modified Rational Method can be used in a single drainage area measuring 20 acres or less. A table is provided on Page 81 summarizing the applicability of the methods discussed in this chapter and how the methods are to be used. New Jersey Stormwater Best Management Practices Manual April 2021 Chapter 5: Stormwater Management Quantity and Quality Standards and Computations Page 9
NRCS Methodology
________________________________________________________________________________________

The NRCS methodology is perhaps the most widely used method for computing stormwater runoff rates,
volumes and hydrographs. It uses both a hypothetical design storm and an empirical nonlinear runoff
equation to compute runoff volumes and as well as a dimensionless unit hydrograph to convert the
volumes into runoff hydrographs. The methodology is particularly useful for comparing pre- and post-
development peak rates, volumes and hydrographs. The key component of the NRCS runoff equation is
the NRCS Curve Number (CN), which is based on soil permeability, surface cover, hydrologic condition and
antecedent moisture. Watershed or drainage area time of concentration is the key component of the
dimensionless “unit hydrograph,” which is defined as a discharge hydrograph resulting from one inch of
direct runoff distributed uniformly over the watershed resulting from a rainfall of a specified duration. A
complete description of the NRCS methodology can be found in the NRCS National Engineering
Handbook, Part 630 -Hydrology (NEH), available at:

 https://www.nrcs.usda.gov/wps/portal/nrcs/detailfull/national/water/?cid=stelprdb1043063.

Information Required for the NRCS Methodology
The index below and continued on the following page lists of all the information required in order to use
the NRCS methodology of computing stormwater runoff. Examples are provided and begin on Page 30.

 Page
 Information Required to use the NRCS Methodology No.

 Hydrologic Soil Group of the drainage area soil 11

 Sub-drainage areas 11

 Land cover 11

 Rainfall depth for the stormwater runoff quantity control design storms 12

 Rainfall distribution for the stormwater runoff quantity control design storms 17

 Rainfall depth for the stormwater runoff water quality design storm 18

 Rainfall distribution for the stormwater runoff water quality design storm 19

 Time of travel and time of concentration 22

 Maximum sheet flow roughness coefficient 22

 Maximum sheet flow length 23

 Shallow concentrated flow 23

 Open channel flow 23

 Tc routes 24

New Jersey Stormwater Best Management Practices Manual April 2021
Chapter 5: Stormwater Management Quantity and Quality Standards and Computations Page 10
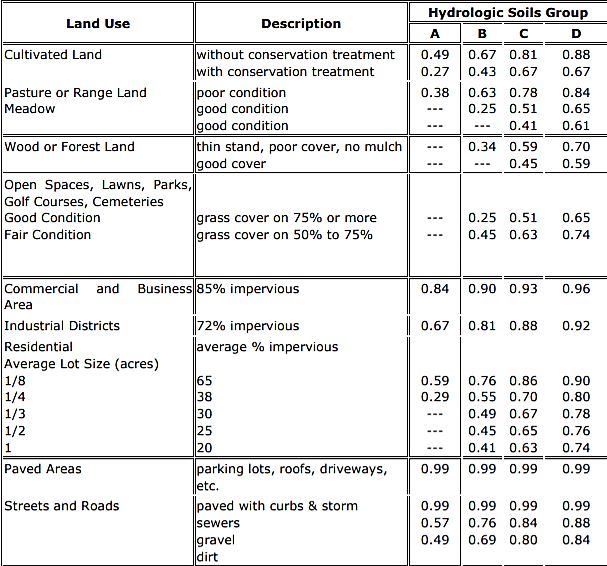
NRCS Methodology (cont’d.)
______________________________________________________________________________________

 Page
 Information Required to use the NRCS Methodology (cont’d.) No.
 Runoff Hydrographs 24

 Directly Connected Impervious Cover 27

 Unconnected Impervious Cover 28

 Reduced Curve Numbers 29

1. Hydrologic Soil Group of the drainage area soil: Under the NRCS classification, soils are classified into
 hydrologic soil groups (HSGs) to indicate the minimum rate of infiltration obtained for bare soil after
 prolonged wetting. The HSGs, which have the designations A, B, C and D, are arranged from highest
 to lowest in order of soil permeability, or infiltration rate, which is the rate at which water enters the
 soil at the soil surface. Infiltration is controlled by the surface condition. HSG also indicates the
 transmission rate—the rate which the water moves within the soil.

 The U.S. Department of Agriculture’s (USDA) Soil Surveys by county or the soil survey data from
 USDA’s Soil Survey website can be used in the preliminary or conceptual design. Currently, the
 information regarding the location of the HSGs present at a location, and the specific soil properties,
 is available online at:

 https://websoilsurvey.sc.egov.usda.gov/App/HomePage.htm.

 However, during the design process, if soil boring samples and/or field tests of permeability show that
 the soil of the site has a different HSG soil than the information obtained from the USDA soil survey,
 the calculation of stormwater runoff and groundwater recharge must be adjusted to the HSG
 designation obtained from field soil testing. Soil Permeability Testing requirements and procedures
 can be found in Chapter 12 of this manual.

2. Sub-drainage areas: Each sub-drainage area having different flow patterns and drainage points by
 which stormwater runoff leaves the sub-drainage area, must be individually identified, and the
 hydrological analysis of each sub-drainage area must be individually performed. When a site consists
 of impervious areas and pervious areas, the impervious areas and pervious areas must be separated
 into sub-different drainage areas in accordance with N.J.A.C. 7:8-5.7. Some hydrologic modeling
 software packages may allow the user to calculate the runoff separately from impervious surfaces and
 pervious surfaces that exist in one drainage area. However, the design engineer may only use this
 modeling option if the impervious area time of concentration is the same as the pervious area time
 of concentration.

3. Land cover: The types of vegetation present, the density of the vegetation, the types of development
 and the percentage of impervious cover are all characteristics that factor into the CN value. For the

New Jersey Stormwater Best Management Practices Manual April 2021
Chapter 5: Stormwater Management Quantity and Quality Standards and Computations Page 11
NRCS Methodology (cont’d.)
________________________________________________________________________________________

 pre-development condition, the presumed state is wooded land use in good hydrologic condition
 unless it is proven otherwise as set forth in the N.J.A.C. 7:8-5.6. Take note that the cover types for
 streets and roads, urban districts and residential districts by average lot size in Table 9-5, of Chapter
 9, NEH Part 630, are intended for modeling large watershed on a watershed-wide scale. They are not
 intended for use in modeling runoff from individual development sites. For runoff from individual
 sites involving a directly connected or unconnected impervious surface, it may be necessary to
 compute runoff from the impervious surface separately from any pervious surfaces.

 For a site that has more than one land cover existing on the site during the five years immediately
 prior to the time of application, the land cover with the lowest runoff potential must be used for
 the computations, as specified at N.J.A.C. 7:8-5.7(a)2. For example, if a site had an existing asphalt
 paved parking lot removed in 2012 and vegetation was established after the removal of the pavement,
 the application for stormwater management approval in 2015 cannot claim the removed asphalt
 parking lot as an impervious surface on the site since the surface with the lowest runoff potential is
 the vegetation that was established prior to the time of the application.

4. Rainfall depth for the stormwater runoff quantity control design storms: Rainfall depth is an
 essential parameter in the calculation of stormwater runoff volumes and peak flows when using the
 NRCS methodology. Two sources of data are available, as follows:
 a. Rainfall depth for a specific location from the New Jersey 24-hour Rainfall Frequency Data for a
 specific county, as provided in either Table 5-1 provided on the following page or by following this
 link:

 https://www.nrcs.usda.gov/Internet/FSE_DOCUMENTS/nrcs141p2_018235.pdf.

New Jersey Stormwater Best Management Practices Manual April 2021
Chapter 5: Stormwater Management Quantity and Quality Standards and Computations Page 12
NRCS Methodology (cont’d.)
________________________________________________________________________________________

 Table 5-1: County-Specific, New Jersey 24-Hour Rainfall Frequency Data

New Jersey Stormwater Best Management Practices Manual April 2021
Chapter 5: Stormwater Management Quantity and Quality Standards and Computations Page 13
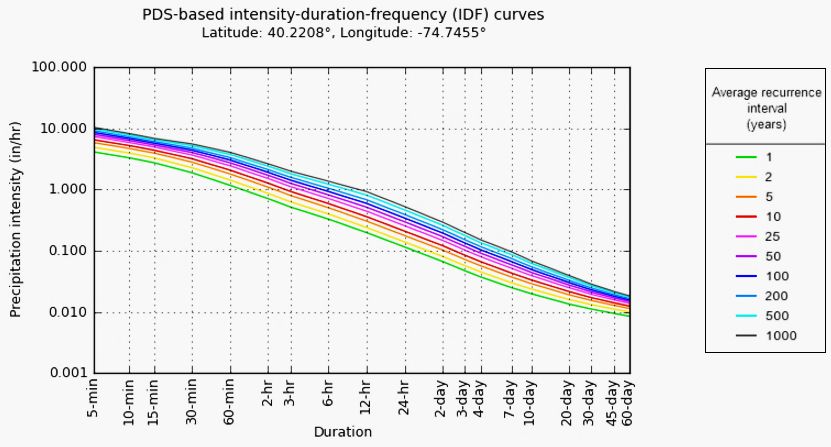
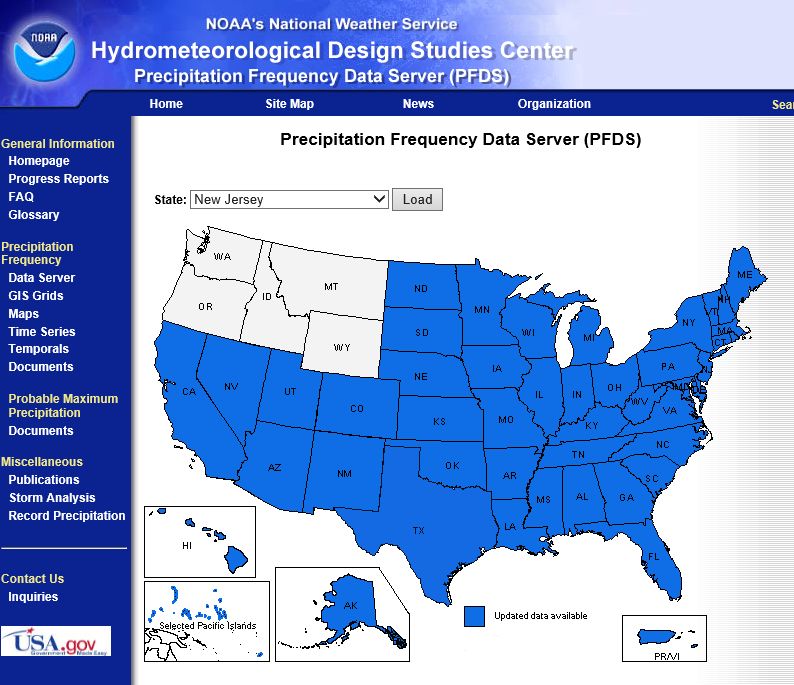
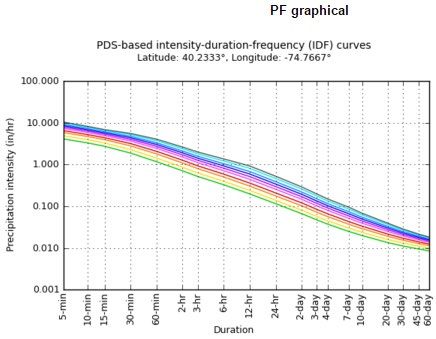
NRCS Methodology (cont’d.)
________________________________________________________________________________________

 b. Rainfall data obtained from a nearby weather station, as provided by NOAA’s NWS, which is
 available online at: https://hdsc.nws.noaa.gov/hdsc/pfds.

 Below is an example of using the link in b above to obtain rainfall depth data for a location in
 Trenton, NJ.

 Step 1: Choose New Jersey from the drop-down list shown in the image below.

 Figure 5-4: NOAA’s NWS Precipitation Frequency Data Server Website

 Step 2: In the Data description section of the next window that opens, from the Select Data Type
 dropdown menu, choose “Precipitation depth” rather than “Precipitation intensity,” the latter of
 which is used more often for the Rational Method and is discussed beginning on Page 70. Then,
 for the Time series type, select “Partial duration” from that dropdown menu, as shown in Figure
 5-5.

New Jersey Stormwater Best Management Practices Manual April 2021
Chapter 5: Stormwater Management Quantity and Quality Standards and Computations Page 14
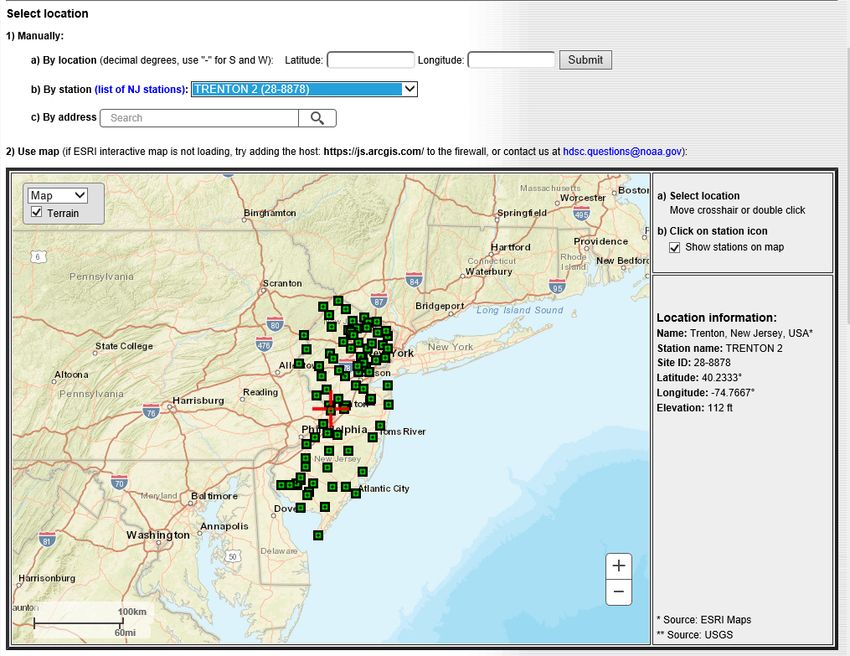
NRCS Methodology (cont’d.) ________________________________________________________________________________________ Figure 5-5: Selecting the Precipitation Depth Data Type Step 3: In the Select location section, input the location information by one of four methods: latitude/longitude, station name, address or left click on the location on the interactive map. For this example, Trenton Station 2 was selected from the dropdown menu under 1.b): Figure 5-6: Manual Location Selection on the NOAA NWS PFDS Website New Jersey Stormwater Best Management Practices Manual April 2021 Chapter 5: Stormwater Management Quantity and Quality Standards and Computations Page 15
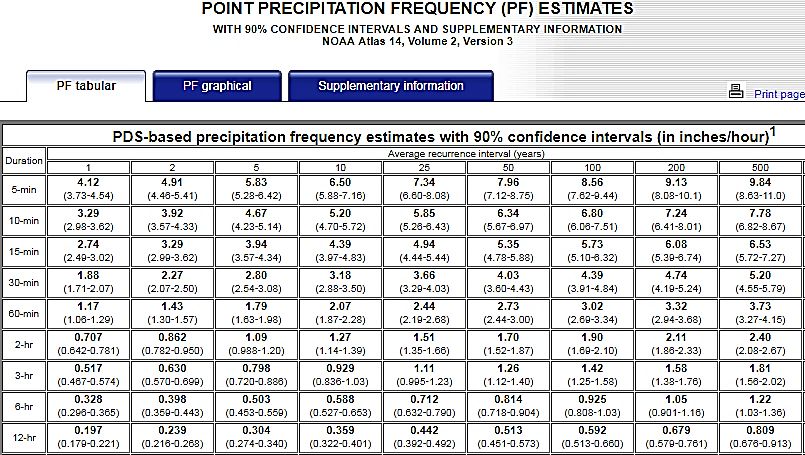
NRCS Methodology (cont’d.)
________________________________________________________________________________________

 Step 4: Scroll down the page to the Point Precipitation Frequency (PF) Estimates section. Left
 click on the PF tabular option, if it does not appear on top of the other tabs, which will be
 highlighted in dark blue, as shown in the following image:

 Figure 5-7: Point Precipitation Frequency (PF) Estimates – Tabular Option

 The data needed is found in the row labeled “24-hr.” The values in the columns labeled “2,”
 “10” and “100” correspond to the rainfall depths generated by the 2-, 10- and 100-year design
 storms, respectively, for this weather station location, as outlined in red in Figure 5-8 on the
 following page.

New Jersey Stormwater Best Management Practices Manual April 2021
Chapter 5: Stormwater Management Quantity and Quality Standards and Computations Page 16
NRCS Methodology (cont’d.)
________________________________________________________________________________________

 Figure 5-8: Locating the 2-, 10- and 100- year Design Storm Rainfall Data

5. Rainfall distribution for the stormwater runoff quantity control design storms: In addition to the
 rainfall depth, knowing how rain falls during a storm event is important in calculating the peak flow
 rate of the stormwater runoff generated. Keep in mind that, generally, a precipitation event typically
 begins with a lighter intensity of rain falling, followed by a period during which rain falls at a higher
 intensity before gently tapering off. To achieve the goal of estimating rainfall events for design and
 planning purposes, between 1961 and 1977, NRCS developed synthetic rainfall distributions from
 historical records from the different regions of the country. These rainfall distributions were based
 upon the assumption that the rain distribution is bell-shaped, meaning it has less rainfall in the
 beginning and at the end of the rain event. The NRCS rainfall distributions were grouped into four
 types according to the applicable regions or geographic situations. Types I and IA represented the
 Pacific maritime climate with wet winters and dry summers. Type III represented the Gulf of Mexico
 and Atlantic coastal areas, including New Jersey, where tropical storms produced large 24-hour
 rainfall events. Type II represented the rest of the country. These NRCS rainfall distributions had
 durations of 24-, 18-, 12- or 6-hours.

 On September 10, 2012, NCRS issued a note, NEW JERSEY BULLETIN NO. NJ210-12-1, stating that:

 As also stated in Bulletin No. NJ210-12-1, when designing BMPs to meet the stormwater runoff
 quantity control standards, NOAA_C and NOAA_D rainfall distributions must be applied to Region C
 and Region D, respectively.

 The location of Regions C and D are shown on the following page in Figure 5-9. NOAA_C and NOAA_D
 rainfall distributions, in text format, are available online at:

 https://www.nrcs.usda.gov/wps/portal/nrcs/main/nj/technical/engineering/.

 NOAA_C and NOAA_D rainfall precipitation distributions and rainfall intensity are also available in
 Excel format from the Department’s website, under the heading for Chapter 5, via the following link:

New Jersey Stormwater Best Management Practices Manual April 2021
Chapter 5: Stormwater Management Quantity and Quality Standards and Computations Page 17
NRCS Methodology (cont’d.)
_____________________________________________________________________________________

 https://www.njstormwater.org/bmp_manual2.htm

 Figure 5-9: NJ Locations of Regions C and D

6. Rainfall Depth for the Stormwater Runoff Water Quality Design Storm: For stormwater runoff
 quality control, N.J.A.C. 7:8-5.5 requires using 1.25 inches of rain falling nonuniformly in a 2-hour
 storm event, which is also known as the Water Quality Design Storm (WQDS).

New Jersey Stormwater Best Management Practices Manual April 2021
Chapter 5: Stormwater Management Quantity and Quality Standards and Computations Page 18
NRCS Methodology (cont’d.)
________________________________________________________________________________________

7. Rainfall Distribution for the NJDEP Water Quality Design Storm: During its duration, precipitation
 falls in a nonlinear pattern as depicted in N.J.A.C. 7:8-5.5(a) and in Table 5-2 on the following page.
 This rainfall pattern or distribution is based on Trenton, New Jersey, rainfall data collected between
 1913 and 1975 and contains intermediate rainfall intensities that have the same probability or
 recurrence interval as the storm’s total rainfall and duration. As such, for times of concentration up
 to two hours, the NJDEP WQDS can be used to compute runoff volumes, peak rates and hydrographs
 of equal probability. This ensures that all stormwater runoff water quality BMPs, whether they are
 based on total runoff volume or peak runoff rate, will provide the same level of stormwater pollution
 control. An Excel file providing the rainfall distribution and rainfall intensity of the WQDS, in 1 minute
 intervals, is also available on the Department’s website, under the heading for Chapter 5, via the
 following link:

 https://www.njstormwater.org/bmp_manual2.htm

New Jersey Stormwater Best Management Practices Manual April 2021
Chapter 5: Stormwater Management Quantity and Quality Standards and Computations Page 19
NRCS Methodology (cont’d.)
________________________________________________________________________________________

 Table 5-2: NJDEP 1.25-Inch/2-Hour Stormwater Runoff
 Water Quality Design Storm Rainfall Distribution

New Jersey Stormwater Best Management Practices Manual April 2021
Chapter 5: Stormwater Management Quantity and Quality Standards and Computations Page 20
NRCS Methodology (cont’d.)
_________________________________________________________________________________________

 The accumulative distribution curve for rainfall depth, shown below in Figure 5-10, is a graphical
 representation of 1.25 inches of rainfall falling in the 2-hour NJDEP WQDS.

 Figure 5-10: Stormwater Runoff Water Quality Design Storm Rainfall Cumulative
 Distribution Curve
 1.25
 1.2

 1.1

 1

 0.9
 Rainfall Depth (inches)

 0.8

 0.7

 0.6

 0.5

 0.4

 0.3

 0.2

 0.1

 0
 0 5 10 15 20 25 30 35 40 45 50 55 60 65 70 75 80 85 90 95 100 105 110 115 120
 Time (minutes)

 Figure 5-11, shown on the following page, is the intensity of the rainfall distribution derived from
 Table 5-2.

New Jersey Stormwater Best Management Practices Manual April 2021
Chapter 5: Stormwater Management Quantity and Quality Standards and Computations Page 21
NRCS Methodology (cont’d.) ________________________________________________________________________________________ Figure 5-11: WQDS Rainfall Intensity Distribution Hyetograph of the NJDEP Water Quality Design Storm Intensity (in/hr) 3.3 3.2 3.1 3 2.9 2.8 2.7 2.6 2.5 2.4 2.3 2.2 2.1 2 1.9 1.8 1.7 1.6 1.5 1.4 1.3 1.2 1.1 1 0.9 0.8 0.7 0.6 0.5 0.4 0.3 0.2 0.1 0 0 5 10 15 20 25 30 35 40 45 50 55 60 65 70 75 80 85 90 95 100105110115120 Time (minutes) 8. The time of travel and the time of concentration: One of the methods identified in the NRCS methodology for calculating time of concentration (Tc) is the velocity method, which assumes the time of concentration is “the sum of travel times for segments along the hydraulically most distant flow path,” as stated in Chapter 15, in Part 630 of the NEH. Flow in a segment may occur as sheet, shallow concentrated or open channel flow, which describe the nature of the flow. Sheet flow is lowest in energy of the three and typically occurs at depths less than or equal to 0.1 ft, before the flow transitions to shallow concentrated flow. In performing Tc calculations, designers must apply the following: Maximum sheet flow roughness coefficient: According to the NRCS, the maximum Manning’s Roughness Coefficient ( ) to be used in Equation 15-8, which is for sheet flow, is 0.80 for woods with dense underbrush; however, in New Jersey, the maximum Manning’s coefficient for sheet flow that may be used is 0.40. For impervious pavement such as a driveway, street, concrete sidewalk, cement finished walkway, stone, paver blocks, porous paving or rooftop, = 0.011. New Jersey Stormwater Best Management Practices Manual April 2021 Chapter 5: Stormwater Management Quantity and Quality Standards and Computations Page 22
NRCS Methodology (cont’d.) ________________________________________________________________________________________ Table 15-1 in NEH, Part 630, Chapter 15 lists additional values for Manning’s roughness coefficient for sheet flow. Maximum sheet flow length: □ For the pre-construction condition, the maximum distance which can be used as the length of sheet flow in the time of concentration calculation is 100 ft , unless there is something physically in contact with the flow of stormwater runoff, such as a swale, curb or inlet, to prevent sheet flow from occurring, i.e., by increasing the depth of flow in excess of 0.1 ft, regardless of whether the surface is impervious or pervious. □ For the post-construction condition, the maximum distance for which flow occurs as sheet flow is 100 ft, and the distance over which sheet flow occurs, L, must be calculated using the McCuen-Spiess limitation, as follows: 100 √ L= where is the slope, in ft/ft, and is the Manning’s roughness coefficient for sheet flow. If the sheet flow length calculated by the McCuen-Spiess limitation criteria exceeds 100 ft, the sheet flow length must be limited to 100 ft. For an undisturbed area, the sheet flow length will remain same as in the pre-construction condition. Calculating the travel time for a segment in which sheet flow occurs: According to the NEH, a simplified form of Manning’s kinematic solution, Equation 15-8, is used to compute travel time for sheet flow, as follows: 0.007( )0.8 Tt = ( 2)0.5 0.4 Calculating the travel time for a segment in which shallow concentrated flow occurs: Shallow concentrated flow occurs after sheet flow and the depths range from 0.1 to 0.5 ft. For this type of flow, the average velocity of the flow in the segment must be derived from Figure 15-4 in NEH and then input into Equation 15-1 to calculate the travel time: ℎ ℎ Tt = 3600 where Tt is the travel time (hr) and is the average flow velocity (ft/s). These steps are presented in Example 5-1, which begins on Page 30. Calculating the travel time for a segment in which open channel flow occurs: Open channel flow is assumed to occur after shallow concentrated flow and where “either surveyed cross-sectional information has been obtained, where channels are visible on aerial photographs or where blueline (indicated streams) occur on U.S. Geological Survey (USGS) quadrangle sheets,” per the Chapter 15, Part 630 of the NEH, which also includes Equation 15-10, which is to be used for open channel flow, along with information regarding its application and limitations. New Jersey Stormwater Best Management Practices Manual April 2021 Chapter 5: Stormwater Management Quantity and Quality Standards and Computations Page 23
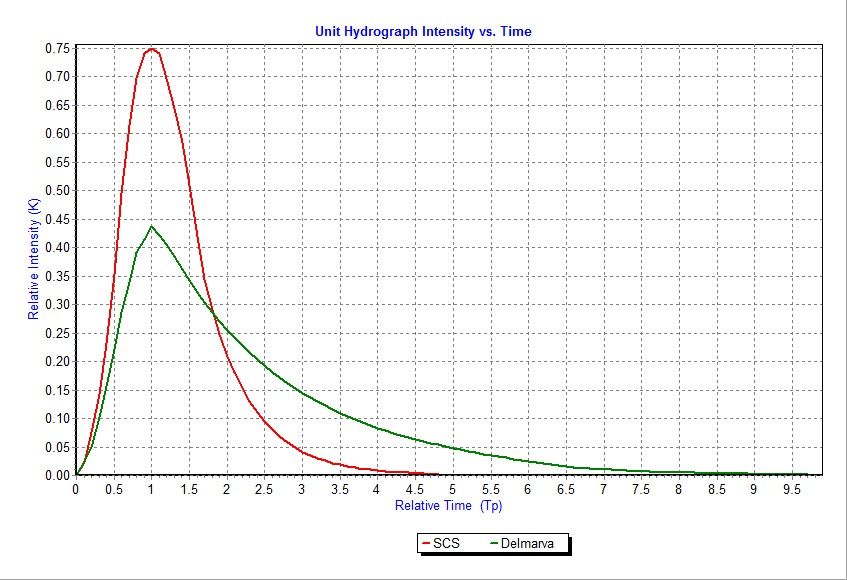
NRCS Methodology (cont’d.) ________________________________________________________________________________________ Tc routes: Consideration must be given to the hydraulic conditions that exist along a selected Tc route, particularly in pre-developed drainage areas. Tc routes should not cross through significant flow constrictions and ponding areas without considering the peak flow and time attenuation effects of such areas, meaning the flow must be routed as a pond. As noted in the NJDEP Stormwater Management rules, such areas can occur at hedgerows, undersized culverts, fill areas, sinkholes and isolated ponding areas. In general, a separate subarea tributary to such areas should be created and its runoff routed through the area before combining with downstream runoff. There is no longer a minimum or default value that may be used for the time of concentration. Tc for pre- and post-construction conditions must be calculated based on the aforementioned requirements. 9. Runoff Hydrographs: The NRCS method uses a Unit Hydrograph for runoff incorporated with the NRCS rainfall distributions (NOAA_C and NOAA_D for New Jersey) to develop a Dimensionless Unit Hydrograph. Runoff is transformed into a hydrograph by using unit hydrograph theory and routing procedures that depend on runoff travel time through segments of the watershed. In development of the runoff hydrograph, the runoff discharge is nonlinear in relation to the time of the rain event in accordance with NRCS observations from many natural unit hydrographs developed from watersheds varying widely in size and geographical locations. A dimensionless unit hydrograph was developed which has a peak rate factor of 484, which means that 48.4% of the total runoff volume is discharged before the peak time and 51.6% of the total runoff volume is discharged after the peak time. The dimensionless unit hydrograph having a 484 peak rate factor is normally called the “SCS Standard Dimensionless Unit Hydrograph (DUH).” NRCS also developed an alternative DUH for the DelMarVa region (which corresponds to the Delaware, Maryland and Virginia peninsula), where coastal, flat areas that have an average watershed slope less than 5 percent, with low topographic relief and significant surface storage in swales and depressions are found. NRCS call it the “DelMarVa DUH,” which as a peak rate factor of 284. Under the DelMarVa DUH, the amount of runoff volume discharged before the peak time is smaller, i.e., 28.45% of the total volume ; additionally, the length of time under the runoff curve is prolonged. Therefore, by using the DelMarVa DUH, the peak flow rate of runoff will be smaller and the entire runoff routing time will be longer. The graph in Figure 5-12, found on the following page, illustrates the differences between the 484 DUH and the DelMarVa DUH. New Jersey Stormwater Best Management Practices Manual April 2021 Chapter 5: Stormwater Management Quantity and Quality Standards and Computations Page 24
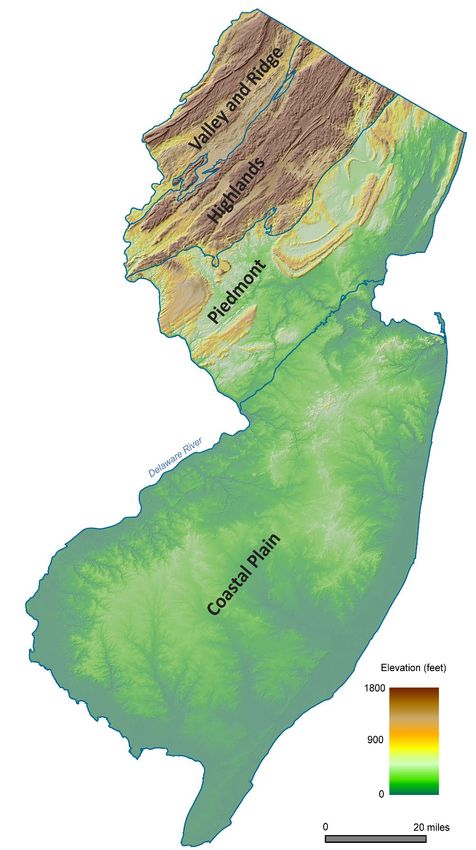
NRCS Methodology (cont’d.)
________________________________________________________________________________________

 Figure 5-12: NRCS Standard DUH (484 DUH) versus the DelMarVa DUH

 SCS

 DelMarVa

The DelMarVa DUH must be used in calculating pre-construction peak flowrates for the 2-, 10- and 100-
year storms in the Coastal Plain Region of New Jersey, unless the design engineer proves, to the
satisfaction of the review engineer, that the conditions for applicability are not present anywhere in the
watershed. The physiographic provinces of New Jersey are depicted in Figure 5-13, which may be found
on the next page, or are available online from NJDEP’s Bureau of Geologic Information Systems at:

 https://www.nj.gov/dep/gis/digidownload/metadata/html/Geol_province.html.

Also note that the same type of DUH must be used in the pre- and post-development hydrographs.
Projects which lie on or near the boundary between the Standard and Delmarva regions identified by
NRCS should be modeled with the DelMarVa Unit Hydrograph, except as noted above.

Take note that the DelMarVa DUH cannot be used in sizing Manufactured Treatment Devices, even if
the site is located in the geographical area where the NRCS recommends the application of the
DelMarVa DUH.

New Jersey Stormwater Best Management Practices Manual April 2021
Chapter 5: Stormwater Management Quantity and Quality Standards and Computations Page 25
NRCS Methodology (cont’d.)
________________________________________________________________________________________

 Figure 5-13: Physiographic Provinces of NJ

 + Carteret

 + Monmouth
 + Junction

 Trenton + Princeton
 Junction

 Image modified from the New Jersey Geological Survey
 Information Circular, “Physiographic Provinces of New
 Jersey, 2006” and used with permission

New Jersey Stormwater Best Management Practices Manual April 2021
Chapter 5: Stormwater Management Quantity and Quality Standards and Computations Page 26
NRCS Methodology (cont’d.) ________________________________________________________________________________________ 10. Directly Connected Impervious Cover: Impervious surfaces are considered directly connected if the impervious surface meets one of the conditions listed below: a. Runoff from the impervious surface flows directly into the drainage system, water bodies and riparian zones or wetlands. b. Runoff is shallow concentrated flow that runs over a pervious area and then into the drainage system, water bodies and riparian zones or wetlands. Figure 5-14: Directly Connected Impervious Surfaces Connected to Stormwater Connected to Concentrated Flow Directed to Collection System Down-gradient BMP Down-gradient Stream Shown above are examples of directly connected impervious surfaces, which include, but are not limited to, runoff from an impervious surface collected by a storm drain, which then connects to a conduit or channel to a downstream BMP, stormwater collection system or stream or flowing over a pervious surface by shallow concentrated flow or channelized flow and then into a channel to a down-gradient stream or other flowing water body. The Stormwater Management rules at N.J.A.C. 7:8-5.7 requires that the design engineer shall consider the relative stormwater runoff rates and/or volumes of pervious and impervious surfaces separately to accurately compute the rates and volume of stormwater runoff from the site in computing stormwater runoff from all design storms. Therefore, when the site has directly connected impervious surface, the runoff volume and peak flow rate from impervious surface and pervious surface shall be modelled individually. If the runoff from an impervious surface and from a pervious surface will converge into one point of analysis, such as stormwater BMP or stormwater conveyance system, the runoff volumes from impervious surface and pervious surface, each calculated separately, can be added together to obtain the total runoff volume. For peak flow modeling, since the time of the peak flow for runoff from impervious surface may not be at the same time as that from the pervious surface within a sub- drainage area, the two peak flow rates must not be simply added together. Instead, a composite hydrograph must be created by adding the separate runoff hydrographs from the impervious surface and the pervious surface, from which the overall peak flow rate can be determined. New Jersey Stormwater Best Management Practices Manual April 2021 Chapter 5: Stormwater Management Quantity and Quality Standards and Computations Page 27
NRCS Methodology (cont’d.)
________________________________________________________________________________________

11. Unconnected Impervious Cover: As described in detail in Chapter 2: Low Impact Development
 Techniques, an important nonstructural BMP is new impervious cover that is not directly connected
 to a site’s drainage system. Instead, runoff from these impervious areas must undergo sheet flow
 onto adjacent pervious areas, where a portion of the impervious area runoff is given an opportunity
 to infiltrate into the soil. Under certain conditions described on the following page, this can help
 provide both groundwater recharge and stormwater quality treatment for small rainfall events as well
 as reduce the overall runoff volume that must be treated and/or controlled in a down-gradient BMP.

 Figure 5-15: Unconnected Impervious Surfaces

 Impervious Sheet Flow Directed to Sheet Flow Directed to
 Surface Down-gradient Grass Swale Down-gradient Stream

 An impervious area can be considered to be an unconnected impervious surface only when meeting
 all of the following conditions:

 a. Upon entering the down-gradient pervious area, all runoff must remain as sheet flow.

 b. Flow from the impervious surface must enter the down-gradient pervious area as sheet flow
 or, in the case of roofs, from one or more downspouts, each equipped with a splash pad, level
 spreader or dispersion trench that reduces flow velocity and induces sheet flow in the down-
 gradient pervious area.

 c. All discharges onto the down-gradient pervious surfaces must be stable and non-erosive.

 d. The shape, slope and vegetated cover in the down-gradient pervious area must be sufficient
 to maintain sheet flow throughout its length.

 e. The maximum slope of the down-gradient pervious area is 8 percent.

 Computation of the resultant runoff from unconnected impervious areas can be performed using two
 different methods: the NRCS composite CN with unconnected impervious area method published in
 NEH, Part 630, Chapter 9, or the Two-Step Method. Both methods require the following conditions
 to be met:

 a. Only the portions of the impervious surface and the down-gradient pervious surface on which
 sheet flow occurs can be considered as an unconnected surface in the calculation. The area
 beyond the maximum sheet flow path length cannot be considered in the calculation.

 b. The maximum sheet flow path length across the unconnected impervious surface is 100 ft.

New Jersey Stormwater Best Management Practices Manual April 2021
Chapter 5: Stormwater Management Quantity and Quality Standards and Computations Page 28
NRCS Methodology (cont’d.)
________________________________________________________________________________________

 c. The minimum sheet flow length across the down-gradient pervious surface is 25 ft in order to
 maintain the required sheet flow state of the runoff.
 d. The NRCS composite CN with unconnected impervious area method published in NEH, Part
 630, Chapter 9, can be used only when the total impervious surface is less than 30 percent
 of the receiving down-gradient pervious surface because absorptive capacity of the
 pervious surface will not be sufficient to affect the overall runoff significantly.

 Example 5-2 uses the unconnected impervious area method in NEH, Part 630, Chapter 9. See Page
 34.

12. Reduced Curve Number: The runoff volume retained or infiltrated by a stormwater BMP may provide
 a reduction of the runoff flow rate of the runoff passing through the stormwater BMP. For example,
 runoff managed with a green roof or a pervious paving system may have a portion of the runoff
 retained in the filtration medium of the green roof or the pervious paving system. The runoff flow
 rate discharged from the green roof or the pervious paving system will be reduced due to the retained
 runoff volume. The reduced runoff flow rate will be equivalent to the runoff flow rate calculated by
 a smaller curve number. Therefore, a reduced curve number method may be used to calculate the
 peak flow rate of 2-, 10- and 100-year design storms from a stormwater BMP. The reduced curve
 number method is illustrated in Example 1 of Chapter 9.6: Pervious Paving Systems and the example
 in Chapter 9.4: Green Roofs of the BMP Manual.

NRCS Methodology Examples
The examples listed in the table on the following page illustrate how to use the NRCS Methodology to
calculate the time of concentration and the stormwater runoff volume generated by an unconnected
impervious surface using the CN Method and the NJDEP Two-Step Method for calculating the stormwater
runoff volume generated by an unconnected impervious surface flowing onto a pervious surface. The
method used in Example 5-4 must not be used and is provided to illustrate why composite hydrographs
are not permitted. Example 5-5 compares the pre- and post-condition hydrographs produced by a project
in which impervious cover is reduced. Take note Examples 5-6 and 7, which begin on Page 44, illustrate
designing a site with two points of discharge and then comparing the results to a similar site with a single
converged discharge. These examples include both exfiltration in the routing calculations as a means of
discharge and the use of the Hantush Spreadsheet to demonstrate the redesign process when
groundwater mounding negatively impacts a BMP. Details on using the Hantush Spreadsheet, along with
additional examples and a discussion of the acceptable range for input parameters, are found in Chapter
13: Groundwater Table Hydraulic Impact Assessments for Infiltration BMPs.

New Jersey Stormwater Best Management Practices Manual April 2021
Chapter 5: Stormwater Management Quantity and Quality Standards and Computations Page 29
You can also read