STP RESEARCH RESULTS Student Transitions Project (STP): Transitions of B.C. High School Graduates into B.C. Public Post Secondary Education
←
→
Page content transcription
If your browser does not render page correctly, please read the page content below
PREPARED BY

         STP RESEARCH                         JOANNE HESLOP
                                              STP MANAGER
                                              JUNE 25, 2021

              RESULTS

         Student Transitions Project (STP):
 Transitions of B.C. High School Graduates
into B.C. Public Post‐Secondary Education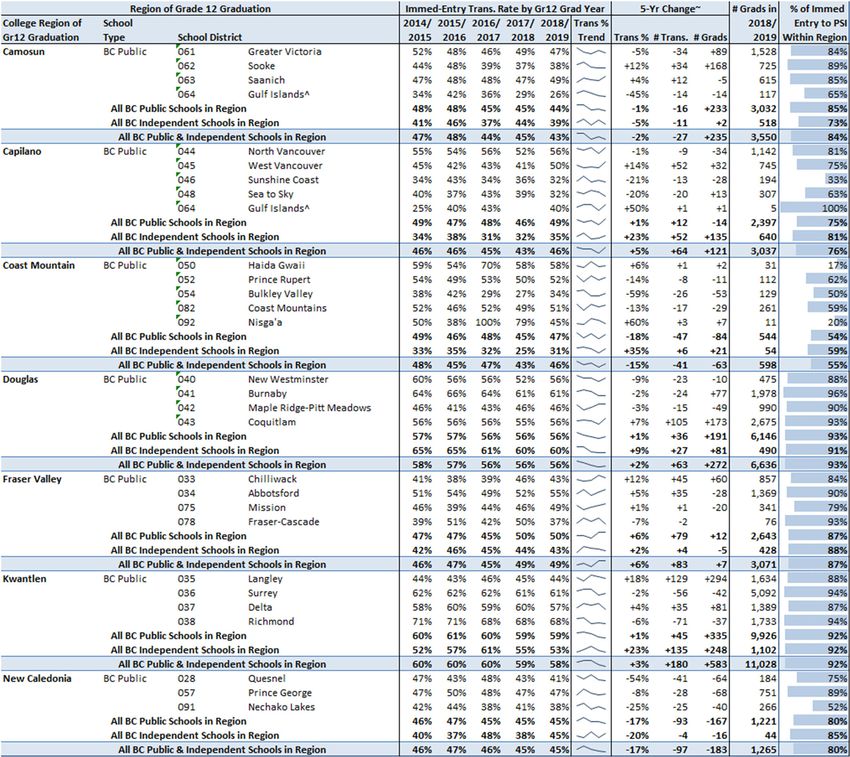
STP RESEARCH RESULTS                                   JUNE 25 2021

RESARCH RESULTS FROM THE STUDENT TRANSITIONS PROJECT     P A G E |2

STP RESEARCH RESULTS                                                                   JUNE 25 2021

Table of Contents
    Executive Summary ___________________________________________________________________ 4

    About this Research __________________________________________________________________ 4

    Quick Facts _________________________________________________________________________ 4

    Introduction_________________________________________________________________________ 9
          Overview ______________________________________________________________________ 9
          Context _______________________________________________________________________ 10

    Research Results ____________________________________________________________________ 11
          Part 1: Student Transitions into Post‐Secondary Education _____________________________ 11
          Part 2: Why are student transition rates declining? ___________________________________ 17
          Part 3: Long‐Run Cumulative Student Transition Rates_________________________________ 34
          Part 4: Student Transitions Within High School Regions ________________________________ 38
          Part 5: Student Retention ________________________________________________________ 46
          Part 6: Post‐Secondary Enrollment Trends ___________________________________________ 48

    Conclusion _________________________________________________________________________ 54

RESARCH RESULTS FROM THE STUDENT TRANSITIONS PROJECT                                      P A G E |3
STP RESEARCH RESULTS JUNE 25 2021
Executive Summary About the STP
The Student Transitions Project is
About this Research British Columbia's collaborative
research project that measures
This newsletter provides highlights of the latest research from the
student success from the K‐12 to post‐
Student Transitions Project (STP), with a focus on the first transitions secondary systems.
of B.C. grade 12 graduates into B.C. public post‐secondary education.
This effective system‐wide partnership,
The study was conducted by the Student Transitions Project (STP), a involving B.C.'s education and
collaborative research partnership involving B.C.’s education and advanced education ministries and
advanced education ministries and post‐secondary institutions. public post‐secondary institutions, is
tracking student success by reporting
This report presents a series of research questions and answers, on student transition rates to post‐
beginning here with brief responses to each question, followed by a secondary education, student mobility
more detailed explanation and visual analysis in the Research Results among post‐secondary institutions,
section of the report, beginning on page 10. and post‐secondary completion and
retention rates.
Quick Facts STP is managed by a steering
committee with representation from
Part 1: Student Transitions into Post‐Secondary Education the two education ministries, public
institutions and the B.C. Council on
What are the transition rates of B.C. high school graduates into B.C. Admissions and Transfer (BCCAT).
public post‐secondary education? The immediate‐entry transition rate
of 2018/2019 grade 12 graduates is currently 51.2% and these rates
have consistently remained at 50% or higher since 2001/2002, but
they have been declining steadily since 2008/2009. [Page 12]
Did the COVID‐19 pandemic affect the immediate‐entry transition
Research Results Legend
rates of 2019/2020 “pandemic graduates”? Overall, Fall transition
rates for the 2019/2020 graduation cohort were not negatively The following symbols used throughout
affected, but selected sub‐populations showed declining transition this newsletter indicate the significance
rates. [Page 13] of each of the research findings.
What does the student transitions matrix reveal about student Recurring Consistent Trend
transitions of different graduation cohorts? The student transitions
Significant Change
matrix shows the number of grade 12 graduates in each of the last
ten graduation cohorts and their time of first entry into B.C. public Context or Information
post‐secondary education. [Page 14]
What are the differences in student transition rates by student
demographic characteristics? Immediate‐entry and delayed‐entry
transition rates vary across different student demographic
characteristics; and trends are provided in a summary table. [Page 15‐16]
RESARCH RESULTS FROM THE STUDENT TRANSITIONS PROJECT P A G E |4
STP RESEARCH RESULTS JUNE 25 2021
Part 2: Why are student transition rates declining?
STP Data and Methodology Transition rates are declining. Is this trend widespread or
Each year, for the purpose of tracking student concentrated within selected student sub‐populations?
transitions, student mobility and student Transition rates are declining in selected student sub‐
success, the Student Transitions Project (STP) populations, including non‐resident graduates, selected
gathers post‐secondary enrollment and language groups, students with moderate AGPAs, and students
credential completion data from the twenty‐ from selected college regions. Declining transition rates are
five B.C. public post‐secondary institutions explored in more detail in the report. [Page 18]
and links this data to secondary school How has a growing share of non‐resident grade 12 graduates
enrollment information via encrypted affected B.C.’s immediate‐entry transition rates? The relatively
personal education numbers (PENs). low and continually declining immediate‐entry transition rates
The STP has continued to collect and combine of a growing share of non‐resident students over the last
this data from B.C.’s education systems every decade has contributed to the overall decline in the provincial
Fall since the project’s inception in 2003, average immediate‐entry transition rate, from its high of 53.9%
while ensuring the protection of student in 2008/2009, to its current level of 51.2%. Despite overall
anonymity and privacy. declines in the transition rate reported for all B.C. graduates
combined, the immediate‐entry transition rates of B.C. resident
With each annual data submission, the STP grade 12 graduates have remained relatively flat and above
dataset expands by one additional year, but 53.0% over the last decade. [Page 19]
with the benefit of each submission fully
replacing and refreshing the previous multi‐ Who are the non‐resident graduates from B.C. high schools
year submission with the most current and and what are their transition rate trends, by language spoken at
accurate information available. home? Approximately half of B.C. non‐resident grade 12
graduates primarily speak Chinese, Mandarin or Cantonese and
The most recent STP data collection took this group has grown significantly over the last decade, while
place in the Fall of 2020, such that the STP their transition rates have been declining. It appears that B.C.
now contains eighteeen academic years* of grade 12 graduates from China are contributing quite
data, including eighteen years of K‐12 significantly to the downward trend in non‐resident and overall
enrollment records (2001/2002 to student transition rates in B.C. [Page 20]
2018/2019) and eighteen full years of post‐
secondary data and (2002/2003 to What are the differences in academic qualifications of
2019/2020), in addition to the most recent resident and non‐resident graduates, transitioners and non‐
post‐secondary enrollment term (Fall 2020). transitioners? On average, the iGPA scores of non‐resident
graduates is higher than the average for resident graduates
* An academic year is September to August, (81.5 versus 79.8). Resident grade 12 graduates with relatively
including Fall, Spring and Summer terms, in high iGPA scores tend to enrol immediately in B.C. public post‐
that order.
secondary education, but high iGPA non‐resident students tend
to delay their transition or do not enrol in B.C. [Page 22]
RESARCH RESULTS FROM THE STUDENT TRANSITIONS PROJECT P A G E |5
STP RESEARCH RESULTS JUNE 25 2021
What are the differences in academic qualifications of
resident and non‐resident immediate‐entrants, by institution
destination? Despite non‐resident graduates achieving higher Special Thanks
overall average iGPA scores at graduation than resident The STP would like to thank the Ministry of
graduates (81.5 versus 79.8), non‐resident entrants to each of Education, the Ministry of Advanced
the B.C. institution types have lower iGPA scores than resident Education and Skills Training and the B.C.
entrants. [Page 23] public post‐secondary institutions for
What are the differences in academic qualifications of collaborating in this research effort. Without
resident and non‐resident immediate‐entrants, by program their co‐operation and data contributions, this
destination? The average iGPA scores of resident students research could not have been accomplished.
entering selected programs are at least one grade point higher The following B.C. public post‐secondary
than the average iGPAs of non‐residents entering the same institutions are included in this study and
program. [Page 24] grouped by institution designation in
Are resident and non‐resident students more likely to enrol 2019/20:
in some programs than others? Resident students, rather than Community Colleges – Camosun College,
non‐residents, are over‐represented in Arts and Sciences Coast Mountain College, College of New
programs and under‐represented in all other programs, Caledonia, College of the Rockies, Douglas
especially Developmental programs, in which non‐resident College, Langara College, North Island College,
students are three times more likely to enrol. Non‐residents are Northern Lights College, Okanagan College,
over‐represented in Business and Engineering programs [Page Selkirk College, Vancouver Community
25] College.
What are the differences in immediate‐entry transition rates Institutes – British Columbia Institute of
of resident and non‐resident graduates, by college region? Technology, Justice Institute of British
Several B.C. college regions have a larger share of non‐resident Columbia, Nicola Valley Institute of
graduates than the 9% provincial average, including Camosun Technology
(16%), Capilano (15%), Douglas (14%), Vancouver Island (13%)
and Vancouver/Langara (11%); and these proportionately larger * Colleges and Institutes (CIN) are frequently
shares of non‐residents contribute to the lowering of the overall grouped together in this report.
immediate‐entry transition rate in these regions. [Page 26‐29]
Teaching‐Intensive Universities (TIUs) –
How do academic qualifications of students affect student Capilano University, Emily Carr University of
transition rates? Student academic qualifications affect the time Art + Design, Kwantlen Polytechnic University,
of entry (immediate or delayed) for students who enrol in B.C. Royal Roads University, Thompson Rivers
public post‐secondary education. Immediate‐entry students University, Vancouver Island University,
have higher iGPAs than the average iGPAs of all grade 12 University of the Fraser Valley.
graduates combined, whereas delayed‐entry and non‐
Research‐Intensive Universities (RIUs) –
transitioning students have lower than average iGPA scores.
Simon Fraser University, University of British
[Page 30]
Columbia (including University of British
Columbia, Okanagan), University of Northern
British Columbia, University of Victoria.
RESARCH RESULTS FROM THE STUDENT TRANSITIONS PROJECT P A G E |6
STP RESEARCH RESULTS JUNE 25 2021
What are the differences in iGPA distributions of immediate‐entry
students, by institution type entered? Students entering RIU’s have
STP Steering Committee higher iGPA distributions than students entering other institution
Members types. The differences in the grade distribution curves reflect
Robert Adamoski, Chair, STP Steering differences in entrance requirements in different institution types.
Committee and Director, Admissions [Page 31]
and Research, BCCAT.
What are the differences in academic qualifications of
Jan O’Brien, Associate Director, immediate‐entry students, by Fall program entered? Differences in
Integrated Planning and Effectiveness academic qualifications, by program, primarily reflect differences in
Thompson Rivers University.
entrance requirements and available spaces in high‐demand
Leila Hazemi, Director, Research and programs. [Page 32]
Analytics, Ministry of Advanced
Education and Skills Training. How do academic qualifications of Aboriginal and Non‐Aboriginal
students affect their respective transition rates? A comparison of the
Nicole Gardner, Director, Outreach,
iGPA distributions shows that immediate‐entry students have higher
Analytics and Reporting, Ministry of
Education. iGPA distribution curves than delayed or non‐transitioners, for both
Aboriginal and non‐Aboriginal students. Among immediate‐entry
Tony Eder, Executive Director, Academic students, non‐Aborignal students have higher iGPA distributions than
Resource Planning, University of
Aboriginal students. [Page 33]
Victoria.
Part 3: Long‐Run Cumulative Student Transition Rates
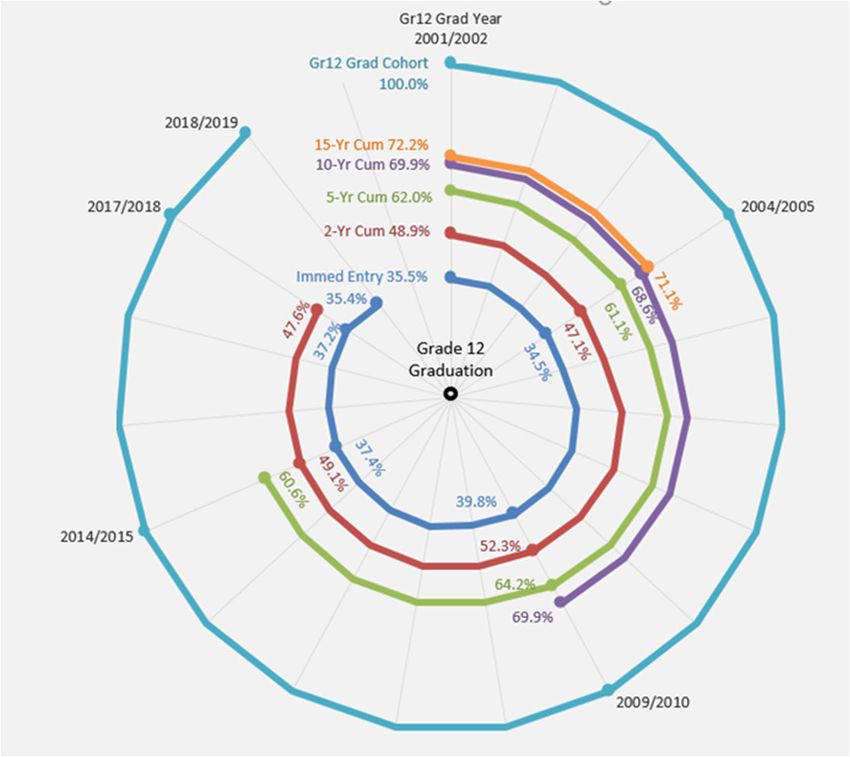
What are the cumulative student transition rates, eighteen years after grade 12 graduation? When delayed‐entry students
are accounted for, the cumulative transition rate of 2002/2003 B.C. grade 12 graduates enrolling in B.C. public post‐secondary
education by 2019/2020 is 80.1% after eighteen years (the longest time horizon currently available for the STP’s first
graduation cohort). [Page 35]
Are cumulative transition rates consistent over successive graduation cohorts? Cumulative transition rates have been
remarkably consistent over successive grade 12 graduation cohorts, but a gradual downward trend in cumulative transition
rates is evident, starting in 2008/2009. [Page 36]
What is the difference in cumulative transition rates between high school moderate achievers and high achievers? High
achievers transition to B.C. public post‐secondary education sooner than moderate achievers; and over the long run, high
achievers attain higher transition rates than moderate achievers. Five years after graduation, the cumulative transition rate of
moderate achievers (61% to 64%) eventually reaches the same level attained by high achievers immediately after graduation.
[Page 37]
RESARCH RESULTS FROM THE STUDENT TRANSITIONS PROJECT P A G E |7
STP RESEARCH RESULTS JUNE 25 2021 Part 4: Student Transitions within High School Regions Do B.C. high school graduates tend to enroll in the same B.C. region where they graduated from high school? The vast majority (87.3%) of all immediate‐entry students who enrolled in B.C. public post‐secondary education in 2019/2020 remained in the same region where they graduated from high school in the preceding year, down by roughly one percentage point from the previous year. [Page 39] What are the trends in regional mobility of B.C. high school graduates, from graduation region to Fall enrollment region? When comparing the 2019/2020 graduates to the year before, it is evident that the proportion of immediate‐ entry students who remained in their home region for post‐secondary education declined by roughly one percentage point in each region. [Page 40] How do immediate‐entry transition rates vary by region, school type and school district in B.C.? A table of immediate‐entry transition rates is provided by region of graduation, school type (public or independent) and school district. Also included is the proportion of 2018/2019 immediate entry students from each school district who enrolled in an institution within the same region as their high school. [Page 41‐43] Do post‐secondary institutions primarily attract grade 12 immediate‐entry students from within the same region? This question looks at the region of origin of post‐secondary immediate‐entrants, rather than the destination region of high school graduates. Most of the B.C. public post‐secondary institutions attracted the majority (86%) of their Fall 2020 immediate‐entry B.C. students from within the same B.C. region where students graduated from high school, but this varies by institution. [Page 44‐45] Part 5: Student Retention What is the first‐year retention rate of Fall immediate‐entry students in the B.C. public post‐secondary system? The first‐year retention rate of Fall immediate‐entry students (79.2%) is the proportion grade 12 graduates who first enrolled in a B.C public post‐secondary institution in the Fall term and subsequently continued their education anywhere in the B.C. system in the next Fall term. [Page 47] Part 6: Post‐Secondary Enrollment Trends What are the trends in post‐secondary enrollment in the B.C. public post‐secondary system? Total headcount post‐secondary enrollment in the B.C. public post‐secondary system in 2019/2020 is currently 424,297, down 6.1% over the previous year when enrollments were 451,157. This enrollment drop, likely attributed to the effects of COVID‐19, was more significant for some institutions and student sub‐populations than other groups. For example, during the initial period of the pandemic, students who would normally enrol exclusively for continuing education or summer programming did not enrol this year, thus affecting total enrollments for the academic year. [Page 49] RESARCH RESULTS FROM THE STUDENT TRANSITIONS PROJECT P A G E |8
STP RESEARCH RESULTS JUNE 25 2021
What are the trends in post‐secondary domestic and international enrollment in the B.C. public post‐secondary system?
Over the last decade, while total headcount enrollment dropped by 3.7% from 440,571, international enrollments have more
than doubled, while domestic enrollment has declined by 15.8%. The ongoing growth in international students has allowed
international students to increase from 7.0% of total headcount enrollment to 18.9% over the last ten years. [Page 50]
What are the trends in domestic and international students, by new versus continuing status? The 3.1% growth in
international students in 2019/2020 is primarily due to the continued and steady growth in continuing international students
because new international students have been declining in the last few years, with a drop of 7.1% in 2019/2020. Over the last
decade, domestic enrollments have been slowly declining, with a significant drop of 7.9% in the 2019/2020 academic year.
This enrollment decline was primarily caused by the 15.0% drop in new domestic students. [Page 51]
What are the trends in international students, by country of origin? Up until 2015/2016, most of the international
enrollment growth in B.C. was driven by a significant proportion (30% to 40%) of international students coming from China.
Over this same time period, India represented fewer than 10% of all post‐secondary international enrollments, but explosive
growth of international students from India began in 2014/2015, rapidly overtaking China in 2017/2018 to become the top
source country of international students in B.C. [Page 52]
What are the trends in post‐secondary headcount enrollments, by B.C. region and institution type? With the exception of
RIUs that showed a 1.1% enrollment increase, the total headcount enrollment in each of the institution types in B.C. declined
in the last year, including ‐6.0% in TIUs, ‐10.0% in Institutes and ‐16.1% in Colleges. International headcount enrollments
increased in all institution types and all regions, with the exception of Vancouver Island institutions (‐4.0%) and B.C. Colleges
(‐1.7%) [Page 53]
Introduction
Overview
This newsletter provides highlights of the
latest research from the Student
Transitions Project (STP), with a focus on
the first transitions of B.C. grade 12
graduates into B.C. public post‐secondary
education. This newsletter is also available
to the public on the STP website.1
1
Public STP website is located here: http://www2.gov.bc.ca/gov/content/education‐training/post‐secondary‐education/data‐research/student‐transitions‐project
RESARCH RESULTS FROM THE STUDENT TRANSITIONS PROJECT P A G E |9
STP RESEARCH RESULTS JUNE 25 2021
Context
Around the time of the STP’s previous data collection (STP2019) in November and December of 2019, the world was alerted to
the earliest cases of COVID‐19 detected in Wuhan, China. Canada subsequently identified its first case of this respiratory
illness in January, as this highly infectious disease, caused by the novel coronavirus, was quickly spreading around the world.
By March 11, 2020, the World Health Organization (WHO) declared a pandemic, and within the span of a few days, B.C. public
post‐secondary institutions moved to online instruction and B.C. K‐12 education began delivering remote instruction to their
students after spring break; and schools were open for vulnerable students and children of essential service workers.
B.C.’s education institutions quickly adapted to the “new normal” to ensure the safety of students, teachers, faculty and staff,
while every member of society in B.C. was encouraged to maintain their physical distance, stay home as much as possible,
self‐isolate if they feel ill, wash their hands frequently, and participate in work/education from home. In addition, the border
between Canada and the USA was restricted to essential travel only, while airlines temporarily suspended international flights
and drastically reduced domestic flights.
More than a year has now passed since the WHO declared the pandemic. Public health restrictions in B.C. and other Canadian
provinces are slowly being relaxed, as increasing shares of the population are becoming vaccinated to protect themselves and
others from the virus. In mid‐June of 2021, vaccinations are well underway around the world, but roughly 80% of the global
population remains completely unvaccinated and vulnerable2. In addition, several countries continue to be overwhelmed
with daily new COVID infections, especially new variants of the disease, and portions of the population are experiencing
vaccine hesitancy, thus slowing the world’s progress towards achieving herd immunity. Globally, we may be a long way from
the end of this pandemic, although more locally, the future is much brighter with 66.9% of all British Columbians and 64.9% of
all Canadians having received at least one dose of vaccine.
STP’s annual data collection cycle does not align well with the timing of the pandemic, thus last year’s STP2019 newsletter was
based on pre‐pandemic enrollment data, preventing any assessment of the impact of COVID‐19 on post‐secondary
enrollments, student transitions and student mobility. This report, based on STP2020 information collected in the Fall of 2020,
provides an early evaluation of the impact of the pandemic on student transition rates and post‐secondary enrollments in
B.C., but enrollment data beyond December 20203 will not be available for reporting until STP2021 is assembled in Spring
2022.
This report identifies a post‐secondary enrollment decline in the 2019/2020 academic year, but this did not affect every
institution in every term of the academic year equally. Enrollments in continuing education and summer programming were
affected during the early phase of the pandemic, from March/April through the summer of 2020. For some students, the
summer term is the only time when they traditionally enrol in post‐secondary education, thus the effect on total post‐
secondary enrollments was more significant during this phase of the pandemic.
2
Canada and world percentage of total population vaccinated (at least one dose), CTV News, https://www.ctvnews.ca/health/coronavirus/coronavirus‐vaccination‐
tracker‐how‐many‐people‐in‐canada‐have‐received‐shots‐1.5247509 (accessed June 15, 2021).
3
Although the Fall 2020 term includes post‐secondary registrations through to December of 2020, the STP collects the Fall 2020 enrollment data
from many institutions on October 31st, when most enrollment data is stable; however, some course registrations occur after this date and are
excluded from the Fall 2020 enrollments this year, and will be included in next year’s STP submission.
RESARCH RESULTS FROM THE STUDENT TRANSITIONS PROJECT P A G E | 10STP RESEARCH RESULTS JUNE 25 2021 Research Results Part 1: Student Transitions into Post‐Secondary Education RESARCH RESULTS FROM THE STUDENT TRANSITIONS PROJECT P A G E | 11
STP RESEARCH RESULTS JUNE 25 2021
What are the transition rates of B.C. high school graduates into
B.C. public post‐secondary education?
The Student Transitions Project measures the FIGURE 1: TRENDS IN IMMEDIATE ENTRY AND DELAYED ENTRY TRANSITION
proportion of grade 12 graduates who enrolled in B.C. RATES OF B.C. GRADE 12 GRADUATES, 2001/2002 TO 2018/2019
public post‐secondary education after grade 12
graduation. Immediate‐entry transition rates measure
54%
53.9%
the share of a grade 12 graduation cohort who
enrolled in post‐secondary education within one year
53%
of grade 12 graduation, whereas delayed‐entry rates
measure the proportion who enrolled after more than 52% 51.0% Immediate
a year. Entry
51%
Immediate‐Entry: The immediate entry transition rate 51.2%
50%
of 2018/2019 grade 12 graduates is currently 51.2%.
See Figure 1. Looking back at STP’s first graduation 50.0%
49%
cohort of 2001/2002 through to the most recent
cohort of 2018/2019, we see that immediate entry 48%
2001/2002
2002/2003
2003/2004
2004/2005
2005/2006
2006/2007
2007/2008
2008/2009
2009/2010
2010/2011
2011/2012
2012/2013
2013/2014
2014/2015
2015/2016
2016/2017
2017/2018
2018/2019
transition rates are declining, although these rates .
.
have remained consistently above 50%, ranging from a .
low of 50.0% for the 2003/2004 grade 12 graduation 19.2%
20% Grade 12 Graduation Year
cohort to a high of 53.9% for the 2008/2009 19.0%
graduation cohort.
18%
Delayed Entry: The proportion of 2015/2016 grade 12
16%
graduates who delayed their transition into B.C. public
post‐secondary education for one, two or three years 1 to 3‐Year
14%
is 15.4%. This is significantly lower than the equivalent Delay 15.4%
rate of 19.2% for the 2001/2002 graduation cohort 12%
from more than a decade earlier.
10%
Declining Transition Rate Trends: Over the last
decade, the immediate and delayed entry transition
2001/2002
2002/2003
2003/2004
2004/2005
2005/2006
2006/2007
2007/2008
2008/2009
2009/2010
2010/2011
2011/2012
2012/2013
2013/2014
2014/2015
2015/2016
2016/2017
2017/2018
2018/2019
rates have dropped for each subsequent graduation
cohort, with the exception of a small recovery for the
2014/2015 graduation cohort. The immediate and
delayed entry transition rates are now 2.7 and 3.8 Grade 12 Graduation Year
percentage points lower than the relatively high rates
achieved earlier in the decade.
RESARCH RESULTS FROM THE STUDENT TRANSITIONS PROJECT P A G E | 12STP RESEARCH RESULTS JUNE 25 2021
Did the COVID‐19 pandemic affect the immediate‐entry
transition rates of 2019/2020 “pandemic graduates”?
The World Health Organization declared the COVID‐19 pandemic on March 11, 2020, so B.C. K‐12 schools responded by
switching to online delivery of education for the balance of the school year. As a result, students from the grade 12 graduation
cohort of 2019/2020 primarily completed their high school education in June of 2020 through online delivery, rather than
traditional classroom‐based instruction. Although schools were open for vulnerable students and children of essential service
workers, the majority of grade 12 graduates of the 2019/2020 academic year completed the remaining three months of the
school year through online education. Did these events affect student transition rates for the 2019/2020 graduation cohort?
Annual immediate‐entry transition rates are calculated over the full academic year to include students who first entered post‐
secondary education after grade 12 graduation in the Fall, Spring or Summer term; however, these annual rates cannot be
calculated for the 2019/2020 pandemic graduates until next year, due to the timing of the STP data collection cycle. Although
Spring and Summer post‐secondary enrollment data for the 2020/2021 post‐secondary academic year is not yet available,
immediate‐entry rates for the Fall term can be used to estimate annual transition rates for the 2019/2020 pandemic
graduates.4 See Figure 2.
The annual immediate FIGURE 2: TRENDS IN FALL AND ANNUAL IMMEDIATE ENTRY TRANSITION RATES (2001/2002 TO 2018/2019)
entry transition rates are TO PREDICT ANNUAL TRANSITION RATES OF 2019/2020 PANDEMIC GRADUATES
estimated from the Fall
rates and historical trends
Immediate‐Entry Transition Rate Trends
53.9%
51.2%
51.0%
51.4%
to be 51.4% for the
60%
2019/2020 graduates, thus Annual
the STP predicts a similar 50%
Immediate‐Entry Transition Rate
transition rate to the
45.8%
45.6%
46.1%
previous (pre‐pandemic) 40% Fall Only
43.2%
graduation cohort of
2018/2019 (51.2%). This 30%
suggests that the annual
transition rate of pandemic 20%
grads of 2019/2020 will
not likely be negatively 10%
affected by the pandemic
overall, but selected 0%
2001/2002
2002/2003
2003/2004
2004/2005
2005/2006
2006/2007
2007/2008
2008/2009
2009/2010
2010/2011
2011/2012
2012/2013
2013/2014
2014/2015
2015/2016
2016/2017
2017/2018
2018/2019
Projn 2019/2020
student sub‐populations
appear to be affected and
will be examined later in
this report. Gr12 Graduation Year
4
The Fall immediate‐entry transition rate for 2019/2020 graduates has been adjusted upward from 44.9% to 45.8% to account for
late Fall 2020 enrolments that are absent from the STP2020 submission.
RESARCH RESULTS FROM THE STUDENT TRANSITIONS PROJECT P A G E | 13STP RESEARCH RESULTS JUNE 25 2021
What does the student transitions matrix reveal about student
transitions of different graduation cohorts?
The STP provides a student transitions matrix for different sub‐populations of students and these are available on the public
STP website1 and the STP SharePoint site for authorized users. The matrix at the provincial level (see Figure 3) shows the
number of grade 12 graduates in each of the last ten graduation cohorts and their time of first entry into the B.C. public post‐
secondary education system. A number of indicators and patterns are evident in the matrix:
The figures in the main diagonal of the matrix show the relatively consistent and gradually declining immediate entry
transition rate over the last decade.
The additional diagonal cells to the right of the main diagonal show the delayed entry transition rates in subsequent
years. The delayed entry rates are increasingly smaller as the number of years since graduation increases; and these
rates are generally declining with each successive graduation cohort.
The number and proportion of each graduation cohort that has not yet entered post‐secondary education in B.C. is
provided in the “No Transition Yet” column of the matrix.
The cumulative transition rate provides the sum of all students from each cohort who have enrolled in post‐
secondary education up until present time.
As the number of years since graduation increases for any given graduation cohort, the proportion of students who
enroll in post‐secondary education increases, while the proportion who have not yet transitioned to post‐secondary
education decreases.
FIGURE 3: STUDENT TRANSITION MATRIX – NUMBER OF STUDENT TRANSITIONS FROM GRADE 12 GRADUATION TO B.C. PUBLIC POST‐SECONDARY
EDUCATION IN EACH ACADEMIC YEAR
Post‐Secondary School Year
No Grand Cumulative
Grade 12 2010/ 2011/ 2012/ 2013/ 2014/ 2015/ 2016/ 2017/ 2018/ 2019/ Transition Total Transition
Grad Year 2011 2012 2013 2014 2015 2016 2017 2018 2019 2020 Yet Gr12 Grads Rate
2009/2010 Count of HS Grads 24,425 4,875 2,013 1,158 824 689 494 341 309 202 10,628 45,958 (10 Years)
% of HS Grad Class 53.1% 10.6% 4.4% 2.5% 1.8% 1.5% 1.1% 0.7% 0.7% 0.4% 23.1% 100.0% 76.9%
2010/2011 Count of HS Grads 24,302 4,650 1,800 1,073 847 580 443 367 259 11,240 45,561 (9 Years)
% of HS Grad Class 53.3% 10.2% 4.0% 2.4% 1.9% 1.3% 1.0% 0.8% 0.6% 24.7% 100.0% 75.3%
2011/2012 Count of HS Grads 24,499 4,529 1,882 1,158 899 617 467 339 11,922 46,312 (8 Years)
% of HS Grad Class 52.9% 9.8% 4.1% 2.5% 1.9% 1.3% 1.0% 0.7% 25.7% 100.0% 74.3%
2012/2013 Count of HS Grads 24,152 4,425 1,865 1,085 834 613 452 12,405 45,831 (7 Years)
% of HS Grad Class 52.7% 9.7% 4.1% 2.4% 1.8% 1.3% 1.0% 27.1% 100.0% 72.9%
2013/2014 Count of HS Grads 23,432 4,530 1,797 1,047 772 545 12,582 44,705 (6 Years)
% of HS Grad Class 52.4% 10.1% 4.0% 2.3% 1.7% 1.2% 28.1% 100.0% 71.9%
2014/2015 Count of HS Grads 23,135 4,275 1,730 1,049 682 13,031 43,902 (5 Years)
% of HS Grad Class 52.7% 9.7% 3.9% 2.4% 1.6% 29.7% 100.0% 70.3%
2015/2016 Count of HS Grads 22,840 4,112 1,725 880 13,930 43,487 (4 Years)
% of HS Grad Class 52.5% 9.5% 4.0% 2.0% 32.0% 100.0% 68.0%
2016/2017 Count of HS Grads 22,701 3,984 1,561 15,396 43,642 (3 Years)
% of HS Grad Class 52.0% 9.1% 3.6% 35.3% 100.0% 64.7%
2017/2018 Count of HS Grads 23,065 3,877 17,596 44,538 (2 Years)
% of HS Grad Class 51.8% 8.7% 39.5% 100.0% 60.5%
2018/2019 Count of HS Grads 22,686 21,633 44,319 (1 Year)
% of HS Grad Class 51.2% 48.8% 100.0% 51.2%
RESARCH RESULTS FROM THE STUDENT TRANSITIONS PROJECT P A G E | 14STP RESEARCH RESULTS JUNE 25 2021
What are the differences in student transition rates by student
demographic characteristics?
Each year, the STP provides information on student transition rates for a number of different student groups. Immediate‐
entry rates, cumulative transition rates after five and ten years, transition rates into Bachelor’s degree programs, and the
number of grade 12 graduates within each sub‐population are provided. See Figure 4.
FIGURE 4: STUDENT TRANSITION RATES, BY STUDENT DEMOGRAPHIC CHARACTERISTICS FOR SELECTED B.C. HIGH SCHOOL GRADUATION COHORTS
Cum. Trans Rates Over 2018/19 Immed 2018/19 Gr12
Immediate‐Entry Transition Rate 5‐Yr Cumulative Transition Rate Time (2009/10 Grads) Trans Rate to Grads Distrib.
Demographic Characteristic 2014/ 2015/ 2016/ 2017/ 2018/ 2010/ 2011/ 2012/ 2013/ 2014/ Immed 5‐Yr 10‐Yr Bach % of
While in Secondary School 2015 2016 2017 2018 2019 2011 2012 2013 2014 2015* Entry Cum Cum Deg^ Other Count Total
Gender:
* Female 55.3% 54.4% 54.2% 53.7% 53.5% 72.8% 71.9% 72.2% 71.8% 71.5% 54.8% 73.2% 77.6% 29.4% 24.1% 22,204 50.1%
Male 50.1% 50.6% 49.8% 49.8% 48.8% 70.6% 70.7% 69.0% 69.5% 69.1% 51.5% 71.5% 75.9% 22.7% 26.1% 22,115 49.9%
Age at Graduation:
* 17 and younger 54.8% 55.0% 54.4% 54.3% 53.9% 74.6% 73.7% 73.2% 73.3% 72.8% 55.4% 74.7% 79.0% 28.2% 25.7% 22,834 51.5%
18 51.7% 51.2% 50.7% 50.7% 49.7% 70.8% 70.0% 69.5% 69.3% 69.0% 52.3% 71.8% 76.5% 25.1% 24.6% 19,632 44.3%
19 and older 38.6% 38.0% 37.2% 35.3% 33.3% 53.9% 55.2% 54.5% 53.0% 56.1% 39.1% 56.8% 60.8% 9.9% 23.4% 1,845 4.2%
Overall Aboriginal Status+:
Aboriginal Student 38.7% 39.1% 40.0% 40.9% 40.7% 64.0% 64.1% 62.8% 63.2% 62.0% 40.7% 67.5% 73.7% 14.4% 26.3% 3,531 8.0%
* Non‐Aboriginal Student 53.9% 53.7% 53.1% 52.7% 52.1% 72.4% 71.7% 71.2% 71.3% 71.0% 54.1% 72.8% 77.1% 27.1% 25.0% 40,788 92.0%
Language Programs (in Grad Year):
ESL in Grad Year 53.6% 48.3% 50.6% 49.4% 45.6% 71.5% 69.3% 69.0% 66.4% 67.3% 57.7% 73.2% 76.5% 11.6% 34.0% 800 1.8%
* French Immersion 64.4% 61.8% 64.2% 62.3% 64.8% 79.6% 81.5% 77.4% 78.4% 80.0% 62.9% 80.8% 84.7% 42.4% 22.4% 2,670 6.0%
Special Needs:
* Gifted 68.3% 69.9% 63.0% 65.5% 64.9% 80.9% 82.4% 80.7% 79.9% 80.0% 71.5% 83.5% 86.4% 51.9% 13.0% 570 1.3%
Other Special Needs 37.3% 39.9% 38.9% 39.4% 39.0% 62.5% 60.0% 59.0% 60.0% 59.4% 39.3% 61.0% 66.8% 10.0% 29.0% 40,010 90.3%
No Special Needs 53.7% 53.3% 53.0% 52.7% 52.1% 72.0% 71.6% 71.1% 71.2% 71.0% 53.4% 72.8% 77.2% 27.2% 24.9% 3,739 8.4%
All Graduates, by Primary Language Spoken at Home:
English 48.7% 48.4% 48.7% 48.6% 48.5% 70.1% 69.7% 68.8% 68.6% 68.7% 49.0% 71.0% 76.0% 24.6% 23.0% 30,301 68.4%
Non‐English: 63.8% 63.2% 60.6% 58.7% 57.0% 77.5% 76.6% 75.7% 76.2% 74.8% 68.5% 78.0% 80.0% 29.4% 33.6% 14,018 31.6%
French 55.7% 49.1% 54.6% 51.2% 45.6% 68.3% 67.4% 70.8% 74.4% 72.7% 49.7% 70.8% 75.5% 27.0% 18.6% 259 0.6%
Chinese, Mandarin, Cantonese 60.6% 58.5% 53.8% 51.4% 48.4% 76.9% 75.6% 73.0% 72.7% 68.5% 73.0% 79.5% 81.0% 32.3% 16.1% 5,229 11.8%
Korean 48.4% 48.3% 48.3% 49.3% 49.7% 54.1% 53.3% 52.2% 54.3% 58.3% 45.1% 53.3% 56.3% 33.3% 16.4% 2,255 5.1%
* Punjabi 81.3% 84.0% 81.7% 83.1% 82.0% 91.9% 91.6% 90.7% 91.9% 91.5% 83.1% 92.1% 93.5% 32.8% 49.2% 900 2.0%
Tagalog (Philipino) 62.3% 61.3% 59.2% 57.4% 54.2% 82.3% 81.4% 83.9% 82.7% 81.1% 65.6% 84.0% 86.3% 15.3% 38.9% 956 2.2%
Other Lang. (not listed above) 62.0% 61.5% 61.4% 58.9% 57.2% 79.9% 77.5% 76.9% 76.9% 75.8% 66.2% 78.5% 80.8% 26.3% 30.9% 4,419 10.0%
B.C. Resident Status at Time of Gr12 Graduation ~ :
* Resident of B.C. 53.7% 53.9% 53.8% 53.9% 53.3% 72.8% 72.4% 72.1% 72.1% 72.0% 53.7% 73.5% 78.0% 27.3% 26.0% 40,193 90.7%
Non‐Resident of B.C. 34.8% 33.3% 31.0% 30.0% 30.5% 40.4% 41.4% 40.3% 40.3% 42.4% 37.4% 42.8% 43.7% 14.5% 16.0% 4,118 9.3%
Non‐Resident of B.C. at Time of Gr12 Graduation, by Primary Language Spoken at Home:
English 32.7% 31.6% 29.5% 25.9% 30.3% 38.2% 41.9% 37.7% 36.3% 39.2% 32.4% 37.9% 38.7% 15.2% 15.1% 848 1.9%
Non‐English: 35.9% 34.2% 31.7% 31.3% 30.6% 41.6% 41.1% 42.2% 42.7% 44.1% 39.5% 44.8% 45.7% 14.3% 16.3% 3,270 7.4%
* Chinese, Mandarin, Cantonese 40.4% 37.5% 34.4% 32.8% 30.6% 55.3% 52.5% 52.5% 50.4% 50.4% 55.5% 63.8% 64.6% 17.4% 13.2% 2,027 4.6%
Korean 27.7% 30.8% 24.1% 28.4% 27.6% 31.1% 27.2% 25.7% 23.5% 30.7% 26.7% 30.2% 31.5% 11.2% 16.4% 286 0.6%
Japanese 13.0% 18.5% 17.7% 17.6% 18.9% 25.0% 27.1% 30.0% 25.3% 20.7% 24.4% 25.6% 25.6% 6.0% 12.9% 201 0.5%
Other Lang. (not listed above) 34.0% 29.6% 30.3% 32.4% 34.3% 36.8% 39.8% 37.1% 40.8% 40.7% 40.0% 43.5% 43.5% 9.6% 24.7% 764 1.7%
Total Non‐Residents of B.C. 53.7% 53.9% 53.8% 53.9% 53.3% 72.8% 72.4% 72.1% 72.1% 72.0% 53.7% 73.5% 78.0% 27.3% 16.0% 40,193 9.3%
Secondary School Type:
* BC Public School 53.5% 53.1% 52.6% 52.6% 52.3% 72.4% 71.8% 71.5% 71.5% 71.4% 53.6% 73.1% 77.5% 26.0% 26.3% 38,632 87.2%
BC Independent School 46.3% 47.9% 47.3% 45.7% 43.7% 65.0% 65.1% 62.6% 63.1% 61.6% 49.3% 66.8% 71.8% 26.5% 17.2% 5,687 12.8%
Grand Total for All BC12 Graduates 52.7% 52.5% 52.0% 51.8% 51.2% 71.8% 71.2% 70.7% 70.5% 70.3% 53.1% 72.4% 76.8% 26.1% 25.1% 44,319 100.0%
Total Number of BC12 Graduates 43,902 43,487 43,642 44,538 44,319 45,561 46,312 45,831 44,705 43,902 45,958 45,958 45,958 44,319 44,319 44,319 44,319
Figure 4 continues on the next page.
RESARCH RESULTS FROM THE STUDENT TRANSITIONS PROJECT P A G E | 15STP RESEARCH RESULTS JUNE 25 2021
FIGURE 4, CONT.: STUDENT TRANSITION RATES, BY STUDENT DEMOGRAPHIC CHARACTERISTICS FOR SELECTED B.C. HIGH SCHOOL GRADUATION
COHORTS
Cum. Trans Rates Over 2018/19 Immed 2018/19 Gr12
Immediate‐Entry Transition Rate 5‐Yr Cumulative Transition Rate Time (2009/10 Grads) Trans Rate to Grads Distrib.
Demographic Characteristic 2014/ 2015/ 2016/ 2017/ 2018/ 2010/ 2011/ 2012/ 2013/ 2014/ Immed 5‐Yr 10‐Yr Bach % of
While in Secondary School 2015 2016 2017 2018 2019 2011 2012 2013 2014 2015* Entry Cum Cum Deg^ Other Count Total
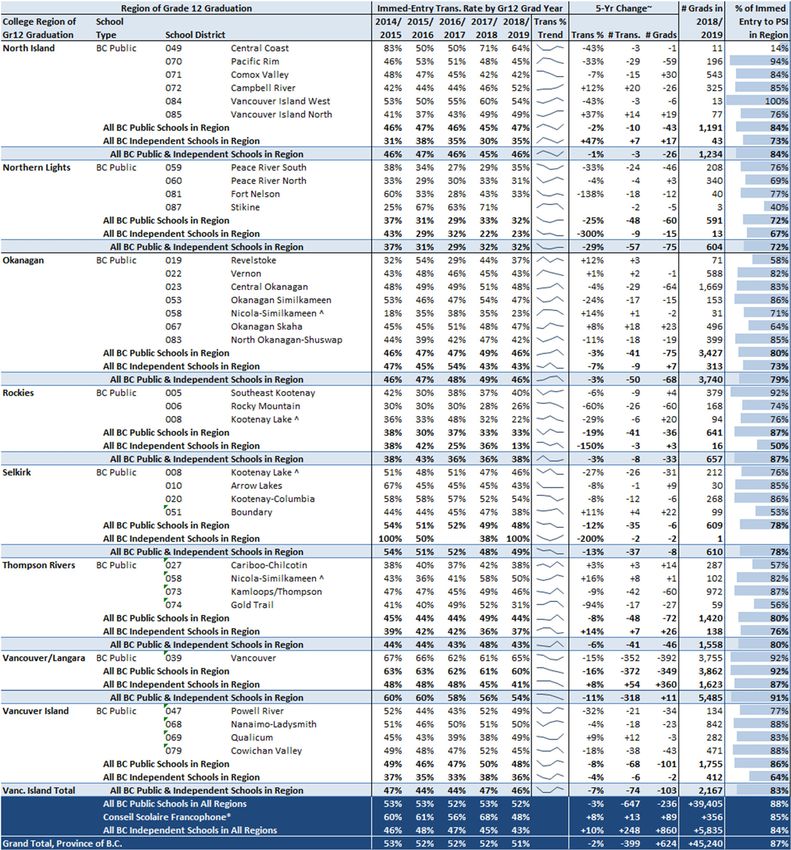
College Region of Secondary School
Camosun 47.5% 47.8% 44.3% 45.2% 43.9% 68.7% 69.8% 69.0% 69.9% 68.2% 45.9% 69.5% 74.1% 22.3% 21.6% 3,393 7.7%
Capilano 46.5% 46.0% 45.5% 43.6% 46.6% 67.5% 67.9% 64.7% 66.4% 64.1% 52.1% 70.9% 76.2% 30.7% 15.9% 2,983 6.7%
Coast Mountain 47.9% 44.9% 46.7% 43.1% 45.7% 73.3% 73.2% 74.0% 71.7% 72.1% 51.2% 74.7% 79.2% 18.2% 27.5% 588 1.3%
Douglas 57.7% 57.4% 56.5% 56.0% 56.5% 76.5% 74.3% 74.0% 74.2% 73.4% 59.3% 76.0% 79.4% 29.4% 27.1% 6,558 14.8%
Fraser Valley 46.3% 47.1% 45.3% 48.7% 49.0% 63.5% 62.5% 64.0% 63.1% 64.7% 43.6% 65.1% 70.4% 25.2% 23.8% 3,022 6.8%
* Kwantlen 59.9% 60.6% 60.4% 59.0% 58.5% 76.2% 75.8% 75.0% 74.3% 75.4% 60.6% 76.4% 80.2% 28.0% 30.5% 10,795 24.4%
New Caledonia 45.6% 46.9% 45.8% 44.8% 44.5% 68.4% 70.1% 68.3% 66.7% 68.1% 49.5% 71.4% 76.3% 21.0% 23.5% 1,241 2.8%
North Island 45.9% 46.8% 45.7% 44.8% 46.2% 73.4% 68.8% 70.8% 73.7% 69.0% 49.6% 73.4% 79.3% 15.1% 31.1% 1,215 2.7%
Northern Lights 37.3% 30.8% 29.4% 32.5% 32.1% 60.0% 57.4% 56.4% 52.7% 56.8% 36.0% 60.8% 66.0% 9.9% 22.2% 598 1.3%
Okanagan 46.2% 46.6% 48.1% 48.6% 45.9% 67.9% 67.1% 68.1% 67.6% 68.4% 43.5% 68.0% 73.7% 22.2% 23.7% 3,687 8.3%
Rockies 37.7% 31.0% 37.1% 33.7% 33.5% 60.2% 60.0% 60.1% 59.2% 59.1% 35.5% 61.7% 69.2% 5.9% 27.6% 642 1.4%
Selkirk 53.5% 51.4% 52.0% 48.5% 48.7% 77.1% 73.2% 75.4% 72.5% 75.8% 48.4% 72.5% 79.0% 11.0% 37.7% 598 1.3%
Thompson Rivers 44.4% 44.0% 43.5% 48.0% 43.2% 65.6% 66.8% 62.2% 65.4% 65.2% 46.7% 68.0% 73.9% 27.8% 15.4% 1,531 3.5%
Vancouver/Langara 60.0% 59.7% 58.6% 56.7% 54.2% 76.4% 76.7% 74.4% 75.7% 73.0% 64.1% 77.6% 80.9% 31.4% 22.8% 5,332 12.0%
Vancouver Island 47.3% 44.1% 44.2% 47.3% 46.0% 65.9% 65.5% 66.5% 65.5% 65.8% 45.0% 68.6% 72.8% 25.3% 20.7% 2,136 4.8%
Secondary School Academic GPA:
No Academic GPA 41.0% 40.9% 40.7% 41.2% 35.5% 62.0% 62.4% 62.8% 62.8% 63.5% 37.9% 63.1% 68.9% 6.7% 28.8% 17,598 39.7%
50.0% ‐ 64.9% 55.3% 55.9% 56.2% 57.6% 47.5% 77.6% 80.4% 76.7% 76.4% 78.5% 58.5% 79.0% 82.7% 5.3% 42.2% 1,033 2.3%
65.0% ‐ 74.9% 64.2% 62.7% 62.9% 60.9% 55.6% 83.3% 83.4% 82.8% 82.6% 81.9% 66.1% 84.7% 87.3% 12.5% 43.1% 3,864 8.7%
Moderate Achievers (GPA < 75%) 62.6% 61.4% 61.6% 60.2% 53.9% 82.1% 82.8% 81.7% 81.4% 81.3% 64.5% 83.4% 86.2% 11.0% 42.9% 4,897 11.0%
* 75.0% ‐ 79.9% 68.1% 67.4% 66.3% 64.8% 61.5% 84.5% 83.4% 82.1% 82.3% 82.7% 69.8% 85.3% 88.1% 26.5% 35.0% 3,571 8.1%
80.0% ‐ 84.9% 68.3% 65.9% 66.5% 64.7% 64.2% 83.0% 81.5% 81.4% 81.5% 80.3% 72.1% 84.0% 86.4% 38.1% 26.1% 4,583 10.3%
85.0% ‐ 89.9% 66.6% 65.5% 65.0% 64.7% 64.1% 79.4% 79.0% 77.0% 77.5% 77.3% 69.1% 80.2% 83.4% 48.3% 15.8% 5,906 13.3%
90.0% ‐ 94.9% 62.9% 63.6% 61.0% 60.3% 63.0% 74.7% 73.8% 71.9% 74.1% 70.8% 67.3% 76.0% 79.6% 54.5% 8.5% 5,524 12.5%
95.0% ‐ 100.0% 59.7% 62.3% 60.6% 56.9% 62.4% 72.3% 71.3% 69.3% 70.4% 68.1% 67.2% 74.4% 79.3% 57.3% 5.1% 2,240 5.1%
High Achievers (GPA 75 ‐ 100%) 65.9% 65.2% 64.2% 62.8% 63.2% 80.0% 78.9% 77.6% 78.1% 76.9% 69.6% 81.2% 84.4% 45.1% 18.1% 21,824 49.2%
Secondary School Inclusive GPA:
50.0% ‐ 64.9% 26.3% 25.2% 27.0% 27.9% 25.7% 51.5% 51.8% 50.7% 49.0% 49.4% 29.6% 54.4% 61.4% 1.6% 24.1% 3,524 8.0%
65.0% ‐ 74.9% 40.7% 40.2% 39.3% 40.0% 38.6% 65.9% 66.1% 65.5% 64.4% 63.8% 43.7% 68.0% 73.2% 6.0% 32.6% 10,641 24.0%
Moderate iGPA (iGPA < 75%) 37.4% 36.8% 36.6% 37.2% 35.4% 62.1% 62.3% 61.5% 60.7% 60.7% 39.8% 64.3% 70.0% 4.9% 30.5% 14,165 32.0%
75.0% ‐ 79.9% 53.7% 54.1% 52.7% 52.8% 50.5% 77.4% 76.0% 76.5% 75.8% 73.9% 57.7% 78.3% 82.0% 16.6% 33.9% 6,796 15.3%
* 80.0% ‐ 84.9% 62.6% 60.9% 60.3% 57.8% 57.3% 80.2% 78.6% 78.3% 78.9% 78.1% 64.7% 81.2% 84.4% 28.1% 29.2% 7,340 16.6%
85.0% ‐ 89.9% 64.6% 64.4% 63.0% 62.2% 62.0% 79.8% 78.8% 78.0% 78.1% 77.5% 68.1% 80.4% 83.4% 42.2% 19.8% 7,579 17.1%
90.0% ‐ 94.9% 65.4% 64.7% 64.5% 63.5% 63.5% 76.4% 75.8% 74.2% 74.5% 74.6% 68.3% 77.0% 80.6% 51.8% 11.7% 6,515 14.7%
95.0% ‐ 100.0% 63.7% 64.6% 62.5% 58.9% 62.2% 73.4% 72.7% 70.8% 74.9% 70.8% 68.5% 75.6% 80.5% 57.0% 5.2% 1,912 4.3%
High iGPA (iGPA 75 ‐ 100%) 61.5% 61.0% 60.0% 59.0% 58.6% 78.4% 77.2% 76.7% 76.9% 75.9% 64.2% 79.3% 82.7% 36.0% 22.6% 30,675 69.2%
Grand Total for All BC12 Graduates 52.7% 52.5% 52.0% 51.8% 51.2% 71.8% 71.2% 70.7% 70.5% 70.3% 53.1% 72.4% 76.8% 26.1% 25.1% 44,319 100.0%
Total Number of BC12 Graduates 43,902 43,487 43,642 44,538 44,319 45,561 46,312 45,831 44,705 43,902 45,958 45,958 45,958 44,319 44,319 44,319 44,319
Figure 4 Footnotes:
+ Overall Aboriginal Status is obtained from K‐12 and Post‐Secondary records. If either source indicates Aboriginal status, the student is classified as
an Aboriginal student by STP.
* Relative to other demographic groups in each set, the group with the highest 5‐year transition for the 2014/15 high school graduation cohort is
identified with *.
^ Immed Trans Rate to Bach Deg is the % of high school graduates of 2018/19 who enrolled immediately in a Bachelor's Degree program in a B.C.
public post‐secondary institution. ^ Immed Trans Rate to Bach Deg is the % of high school graduates of 2018/19 who enrolled immediately in a
Bachelor's Degree program in a B.C. public post‐secondary institution.
~Non‐residents of B.C. may be residents from out of province (i.e. Alberta, Ontario, etc.) or residents from out of country (China, Hong Kong, Korea,
etc.). The non‐residents of B.C. are used as a proxy for identifying "international" grade 12 graduates, regardless of language spoken at home, thus
residents from other Canadian provinces are included in this proxy.
RESARCH RESULTS FROM THE STUDENT TRANSITIONS PROJECT P A G E | 16STP RESEARCH RESULTS JUNE 25 2021 Part 2: Why are student transition rates declining? RESARCH RESULTS FROM THE STUDENT TRANSITIONS PROJECT P A G E | 17
STP RESEARCH RESULTS JUNE 25 2021
Transition rates are declining. Is this trend widespread or
concentrated within selected student sub‐populations?
Student transition rates have been declining gradually over the last several years, so the STP would like to identify whether
selected student sub‐populations are contributing to these trends, in an effort to gain a better understanding of the possible
reasons for these declining transition rates. The summary table of student transition rates by demographic characteristics,
provided earlier in this report in Figure 4, is useful for identifying some of the student sub‐populations that experienced
significant declines in immediate‐entry transition rates. The following sizeable groups of high school graduates showed larger
declines in immediate‐entry transition rates (stated as a percentage point drop), compared to the overall decline of 1.5
percentage points over the last five years for all high school graduates combined:
Students whose primary language spoken at home is Chinese, Mandarin or Cantonese (‐12.2 percentage points).
Non‐resident graduates whose primary language spoken at home is Chinese, Mandarin or Cantonese (‐9.8).
Students with moderate AGPA scores (below 75%) at graduation (‐8.7).
Students whose primary language spoken at home is not English (‐6.8).
Students with iGPA scores between 80% and 85% at graduation (‐5.3).
Graduates from high schools in selected college regions: Vancouver/Langara (‐5.8), Northern Lights (‐5.2),
Selkirk (‐4.8), Rockies (‐4.2) and Coast Mountain (‐2.2 over five years and ‐5.5 over ten years).
Non‐resident graduates (‐4.3).
Aboriginal students saw an improvement in immediate‐entry transition rates (+2.0), but they show declining
cumulative five‐year transition rates (‐2.0).
Transition rates and trends for the groups of students identified above will be explored in more detail in this section of the
report.
RESARCH RESULTS FROM THE STUDENT TRANSITIONS PROJECT P A G E | 18STP RESEARCH RESULTS JUNE 25 2021
How has a growing share of non‐resident grade 12 graduates
affected B.C.’s immediate‐entry transition rates?
As the market for international students has expanded in B.C., the number and proportion of international students
graduating from B.C. secondary schools has increased and this is evident in Figure 5A. In 2001/2002, non‐resident students5
represented 2% of all B.C. grade 12 graduates, but this number has quadrupled from roughly 1,000 students to more than
4,000 students, reaching 9% of total grade 12 graduates in 2018/2019. The growth in international or non‐resident graduates
slowed somewhat in the most recent year, likely due to the COVID‐19 pandemic.
As shown in Figure 5B, the student transition rates of B.C. high school graduates into B.C. public post‐secondary institutions
appear to be affected by the growing share of non‐resident graduates whose immediate‐entry transition rates into B.C. post‐
secondary institutions are significantly lower (30.5%) than transition rates of B.C. residents (53.3%). The relatively low and
continually declining immediate‐entry transition rates of a growing share of non‐resident students over the last decade has
contributed to the overall decline in the provincial average immediate‐entry transition rate, from its high of 53.9% in
2008/2009, to its current level of 51.2%. Despite overall declines in the transition rate reported for all B.C. graduates
combined, the immediate‐entry transition rates of B.C. resident grade 12 graduates have remained relatively flat and above
53.0% over the last decade.
Why are B.C. non‐resident graduates increasingly less inclined to enrol in B.C. public post‐secondary education than B.C.
residents? This section of the report will explore some possible reasons, including academic qualifications, institution and
program destinations, and regional variations (see pages 18 to 33).
FIGURE 5: TRENDS IN B.C. RESIDENT AND NON‐RESIDENT GRADE 12 GRADUATES:
(A) NUMBER AND PROPORTION OF STUDENTS AND (B) IMMEDIATE‐ENTRY TRANSITION RATES
5 Non‐residents students include any students enrolled in the B.C. K‐12 system who are not residents of British Columbia. This is used as a proxy for
identifying international students as this group primarily includes students from outside of Canada, but it also includes students from other
Canadian provinces.
RESARCH RESULTS FROM THE STUDENT TRANSITIONS PROJECT P A G E | 19STP RESEARCH RESULTS JUNE 25 2021
Who are the non‐resident graduates from B.C. high schools and
what are their transition rate trends, by language spoken at home?
The STP does not obtain an international student status for grade 12 graduates in the STP data provided by the Ministry of
Education; however, the STP is able to use the non‐resident status along with each student’s primary language spoken at
home as a proxy for country of origin for non‐resident graduates.
The table in Figure 6 provides a breakdown of primary language spoken by 2018/2019 grade 12 non‐resident graduates and
the corresponding charts provide the transition rate trends (left axis) and the number of grade 12 graduates (right axis).
Students whose primary language is Chinese, Mandarin or Cantonese represent roughly half of the non‐resident students.
Those who primarily speak English likely include residents of other Canadian provinces and other English‐speaking countries.
Given the relatively steep decline in transition rates and significant growth in students with a primary language of Mandarin/
Cantonese/Chinese, it appears that students from China are contributing quite significantly to the downward trend in student
transition rates in B.C., but why is this occurring? Other language groups represent a smaller share of non‐resident students
and their transition rate trends are not trending downward to the same extent as those from China. A news article published
on June 9, 2020 in The Globe and Mail 6 referred to a survey of undergraduate business students at the University of Toronto
who were born or grew up in China. Many of these students had no intention of remaining in Canada after graduation
because they were optimistic about the economic future and opportunities for career advancement in China and they looked
forward to returning to their family and social connections back home.
FIGURE 6: PRIMARY LANGUAGE OF NON‐RESIDENT GRADE 12 GRADUATES AND TRANSITION RATE TRENDS FOR SELECTED LANGUAGE GROUPS
6
https://www.theglobeandmail.com/world/article‐why‐do‐international‐students‐in‐canada‐end‐up‐back‐home/, accessed June 25, 2021.
RESARCH RESULTS FROM THE STUDENT TRANSITIONS PROJECT P A G E | 20STP RESEARCH RESULTS JUNE 25 2021
Measures of Secondary School
Academic Performance
The STP uses two different academic performance measures in
complementary ways to evaluate student academic performance
achieved in high school and the impact this performance has on
student transition rates and post‐secondary academic
performance: Academic GPA (AGPA) and the Inclusive GPA
(iGPA).
Academic GPA (AGPA) – This measure is typically used as an
indicator of university eligibility. The AGPA is the average of four
course grades, English 12 and the student’s best three other
academic grade 12 subjects. More than half of the students who
completed grade 12 do not complete the necessary set of
courses or achieve insufficient grades in order to calculate an
AGPA. Thus the utility of the AGPA is limited to a subset of
academically qualified students in the STP.
Inclusive GPA (iGPA) – This is a more broadly defined measure
than the AGPA and it allows the STP to measure the academic
performance of both grade 12 graduates and non‐graduates.
The iGPA is calculated from the average of twelve course grades
selected from each of twelve subject areas for grade 10, 11 and
12 courses required for graduation. The best grade from each of
the twelve subject areas is included in the iGPA calculation. In
those cases where a student has not yet completed the
requirements for all twelve subject areas, the iGPA is calculated
on as many courses as are available for that student, from a
minimum of one to a maximum of twelve courses per student.
The twelve subject areas are based on the current grade 12
graduation requirements:
1) Planning 10 7) Skills and Fine Arts 10, 11, 12
2) Language Arts 10 8) Social Studies 10
3) Language Arts 11 9) Social Studies 11 or 12
4) Language Arts 12 10) Science 10
5) Math 10 11) Science 11 or 12
6) Math 11 or 12 12) Physical Education 10
Note: The STP2020 dataset uses an 8‐course iGPA this year for
all cohorts, due to changes in the B.C. curriculum. The following
courses are excluded from the iGPA in this year’s analysis:
Planning 10, Language Arts 10, Language Arts 11 and PE 10.
RESARCH RESULTS FROM THE STUDENT TRANSITIONS PROJECT P A G E | 21STP RESEARCH RESULTS JUNE 25 2021
What are the differences in academic qualifications of resident
and non‐resident graduates, transitioners and non‐transitioners?
On average, the iGPA scores of non‐resident graduates is higher than the average for resident graduates (81.5 versus 79.8),
but it is interesting to note the differences between the two groups, in terms of the relative ranking of iGPA scores among
transitioners and delayed‐entrants/non‐transitioners. See Figure 7.
Resident students: Grade 12 graduates with relatively high iGPA scores tend to enrol immediately in B.C. public post‐
secondary education, while those with lower iGPA scores tend to delay or do not transition to post‐secondary
education in B.C.
Non‐resident students: These students show the opposite pattern to B.C. residents. Those with lower iGPA scores tend
to enrol immediately in B.C. public post‐secondary education, while those with higher iGPA scores tend to delay or do
not transition into post‐secondary institutions in B.C.
Since the STP focuses on students enrolling in B.C. public post‐secondary education, it is possible that the non‐resident
students are enrolling in non‐B.C. institutions, especially those with higher academic qualifications who have sufficient
financial resources to enrol virtually anywhere in the world. A more detailed look at the iGPAs by program destination
provides some explanation for the differences in iGPA scores and destinations of resident and non‐resident students.
See inset box on the page 21, Measures of Secondary School Academic Performance for iGPA definition.
FIGURE 7: IGPA TRENDS OF B.C. RESIDENT AND NON‐RESIDENT GRADE 12 GRADUATES
RESARCH RESULTS FROM THE STUDENT TRANSITIONS PROJECT P A G E | 22STP RESEARCH RESULTS JUNE 25 2021 What are the differences in academic qualifications of resident and non‐resident immediate‐entrants, by institution destination? Despite non‐resident graduates achieving higher overall average iGPA scores at graduation than resident graduates (81.5 versus 79.8), non‐resident entrants to research‐intensive universities (RIUs) had lower iGPAs than B.C. residents (85.2 versus 88.2). Similarly, non‐resident graduates entering teaching‐intensive universities (TIUs) and colleges/institutes (CIN) had lower iGPAs than resident graduates entering those institution types. See Figure 8. Program destinations might be a factor in these differences (see page 24). FIGURE 8: IGPA TRENDS OF B.C. RESIDENT AND NON‐RESIDENT GRADUATES, BY IMMEDIATE‐ENTRY INSTITUTION TYPE RESARCH RESULTS FROM THE STUDENT TRANSITIONS PROJECT P A G E | 23
STP RESEARCH RESULTS JUNE 25 2021 What are the differences in academic qualifications of resident and non‐resident immediate‐entrants, by program destination? As shown in Figure 9, the average iGPA scores of resident students entering selected programs are at least one grade point higher than the average iGPA scores of non‐residents entering the same programs: Engineering (87.2 versus 84.9), Arts and Sciences (83.3 versus 82.2) and Business (81.9 versus 79.4). While the minimum qualifications for different programs tend to vary within and between B.C. public post‐secondary institutions, due to differences in program expectations and available spaces, the minimum program admission qualifications for B.C. high school graduates for resident (domestic) or non‐resident (typically international) students are usually similar. A closer look at the proportion of resident and non‐resident students within selected program areas provides some perspective on the linkage between student academic qualifications, program destinations and overall immediate‐entry transition rates of resident and non‐resident students (see next page). FIGURE 9: IGPA TRENDS OF B.C. RESIDENT AND NON‐RESIDENT GRADE 12 GRADUATES, BY PROGRAM ENTERED RESARCH RESULTS FROM THE STUDENT TRANSITIONS PROJECT P A G E | 24
You can also read