Svalbard's Mesoscale Environmental Factor Impact on the Wind Field - MDPI
←
→
Page content transcription
If your browser does not render page correctly, please read the page content below
atmosphere

Article
Svalbard’s Mesoscale Environmental Factor Impact on the
Wind Field
Małgorzata Kitowska *                  and Tomasz Petelski

                                          Institute of Oceanology, Polish Academy of Science, 81-712 Sopot, Poland; petelski@iopan.gda.pl
                                          * Correspondence: gosiak@iopan.gda.pl

                                          Abstract: The mesoscale circulation along the west shore of Spitsbergen is largely controlled by the
                                          difference in temperature between the glaciers and surface sea temperatures. We describe how the
                                          mesoscale effect influences the atmospheric circulation patterns. The conducted research was based
                                          on reanalysis data, model data, and atmospheric measurements; wind data from different sources
                                          and scales were compared and analysed. We discuss the situations wherein the mesoscale effect
                                          can be identified by analysing the wind direction or its velocity. This study shows the role of the
                                          mesoscale effect on the wind in the Svalbard region. Different situations according to the atmospheric
                                          patterns taken from a catalogue of 21 circulation types for each day created for Svalbard are analysed
                                          and compared with cases of land-sea breeze type circulation for the 20-year period between 1994
                                          and 2013. It is proved that even if it is not possible to distinguish this mesoscale effect based on the
                                          difference between local and large-scale wind directions, this factor can be observed by studying the
                                          wind speeds. It is claimed that as long as there are glaciers on Spitsbergen, there will be a mesoscale
                                          land-sea breeze type circulation controlled by the difference in air temperature over land and water.

                                          Keywords: arctic; svalbard; atmospheric circulation; climate; wind


Citation: Kitowska, M.; Petelski, T.
Svalbard’s Mesoscale Environmental        1. Introduction
Factor Impact on the Wind Field.
                                                The Arctic is the Earth’s region where changes in the climate are most rapid and
Atmosphere 2021, 12, 1165. https://
                                          visible, changes which have and will continue to have severe impact on environment
doi.org/10.3390/atmos12091165
                                          and society and in last years and have caused an increase of interest on the ocean role
                                          in climate shaping. Atmospheric circulation, next to the oceans, has a huge impact on
Academic Editor: John Walsh
                                          the climate. An excellent laboratory for observing the changes taking place on account
                                          of, inter alia, its availability is Svalbard and its surroundings. The Svalbard archipelago
Received: 2 August 2021
Accepted: 8 September 2021
                                          (whose largest island is Spitsbergen), along with several islands that are not part of the
Published: 10 September 2021
                                          archipelago (including Bear Island-Bjørnøya), is located within the limits of 71◦ –81◦ N
                                          and 10◦ –35◦ E, 800 km north of Norway and 1100 km from the North Pole. The climate of
Publisher’s Note: MDPI stays neutral
                                          Svalbard is mainly determined by its proximity to the North Atlantic current, which makes
with regard to jurisdictional claims in
                                          the surrounding waters of the Greenland Sea ice-free in the west of the island. Its climate
published maps and institutional affil-   is sub-polar along the west coast and polar on the east coast. The literature on Svalbard’s
iations.                                  meteorology is constantly evolving [1], even if many aspects are yet to be fully understood.
                                                There are several studies confirming a strong relationship between the atmosphere,
                                          ocean, and ice cover near the Svalbard Archipelago [2], which shows a profound influence
                                          of atmospheric conditions on the West Spitsbergen Shelf hydrography via the cross-shelf
Copyright: © 2021 by the authors.
                                          Ekman transport. The increasingly important role of the atmospheric thermodynamic
Licensee MDPI, Basel, Switzerland.
                                          force in shaping recent changes in the Svalbard multiyear ice is also evident [3]. There are
This article is an open access article
                                          strong inverse relationships between near-surface wind speed and sea ice concentration,
distributed under the terms and           confirmed by comparing results from several different analyses and the results from climate
conditions of the Creative Commons        models [4]. Atmospheric forcing of the circulation is important for determining salinity in
Attribution (CC BY) license (https://     the North Atlantic and there is a close relationship between conditions on the shelf and
creativecommons.org/licenses/by/          slope of the Northwest Atlantic, on the one hand, and the winds directing the inflow of
4.0/).                                    Arctic freshwater, on the other [5]. Increasing winds, along with sea ice reduction, sea level

Atmosphere 2021, 12, 1165. https://doi.org/10.3390/atmos12091165                                         https://www.mdpi.com/journal/atmosphere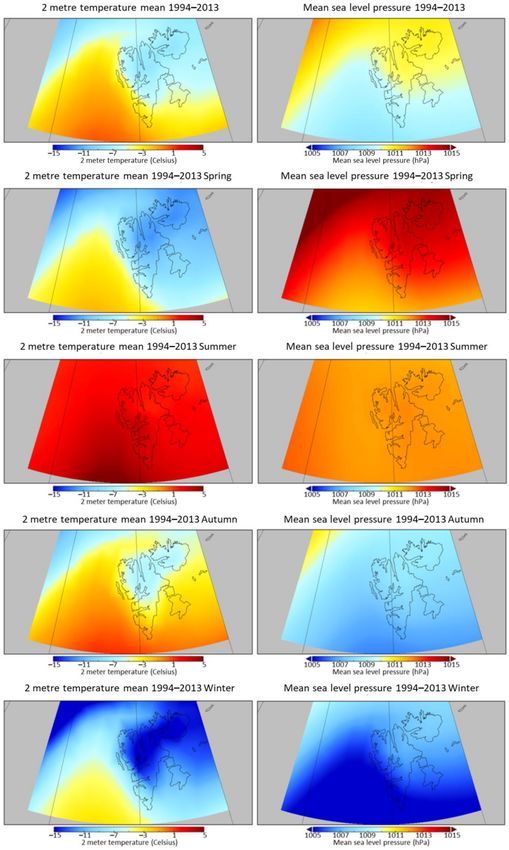
Atmosphere 2021, 12, 1165                                                                                            2 of 19

                            rise, and melting permafrost, are another major factor contributing to the growing problem
                            of Arctic coastal erosion [6]. A statistical analysis and comprehensive description of the
                            Arctic winds climatology over the ocean is provided by [7], who also point that this is
                            an inseparable part in the heat exchange process between the sea and the atmosphere.
                                  The influence of local conditions on wind circulation cannot be overlooked. Based
                            on observations in one of the fjords of the west coast of Spitsbergen, Isfjord, it was found
                            that there is a strong correlation between the along-shelf wind direction and the direction
                            of wind stress operating locally on the fjord, as local wind action drives the two-layer
                            cross-fjord circulation patterns through the surface Ekman transport [8]. Another local
                            phenomenon is katabatic winds [9], whose effect on the shelf-fjord exchange mechanism
                            (inflow of warm saline water in the deeper layers and outflow of glacial freshwater in the
                            upper layer) has been described based on studies in the fjords of the east coast of Greenland
                            by [10]. Results from a high-resolution numerical model of ocean circulation confirm
                            that such water circulation also occurs in Kongsfjord (fjord in west coast of Spitsbergen).
                            According to [11], fresh water discharge from glaciers is not a necessary factor forcing
                            exchange under the water surface, a more important influence are winds blowing along
                            the fjord axis. The occurrence of a breeze front over the West Spitsbergen current is also
                            confirmed by measurements of aerosol optical depth AOD [12]. In our previous work [13],
                            it was well proven that land-sea breeze type circulation is a mesoscale phenomenon and
                            thus should be considered over the entire Svalbard. The force causing the air circulation
                            due to the difference in temperature occurs all seasons and all times of the day, since the
                            waters of the Arctic Ocean in this region are usually free of sea ice, so their surface is
                            warmer than the neighbouring glaciers on the island, such that the temperature difference
                            is always there regardless of the time of day and year. However, this phenomenon is most
                            often observed in the winter months (the highest probability of a land-sea breeze type
                            circulation occurring simultaneously in Hornsund and Kongsfjorden is in February and
                            March), while it is least probable during summer. This is due to the fact that surface water
                            temperatures in the unfrozen waters of the West Spitsbergen Current flowing west of the
                            island are never higher than approx. 3 ◦ C [14] and in summer the temperature difference
                            between the glaciers in the east and the open water is the lowest. At the same time, it is
                            not always easy or even possible to demonstrate the existence of this type of circulation.
                            Analysis of wind direction at measuring stations and large-scale wind allows us to identify
                            conditions that are dominated by the mesoscale factor. In addition, in this work we want
                            to show that also in situations where the wind direction does not differ, the influence of
                            the mesoscale factor can be identified on the basis of the difference between local and
                            large-scale wind speed.
                                  The research paper presented here can be regarded as an extension and partly a sup-
                            plement to the previous work [13], in which the land-sea breeze type circulation in the
                            West Spitsbergen fjords is described. Additionally, it is shown that this type of circulation is
                            mesoscale and simultaneously affects fjords located at opposite ends of the island. The aim
                            of this work is to analyze synoptic situations that favor the occurrence of such a circulation
                            and enable its detection, which is based so far on the study of the wind direction measured
                            at stations in the fjords and the wind resulting from the large-scale pressure field. One new
                            feature is that we analyze wind speed and air temperature. Furthermore, the realized goal
                            of this work was to investigate and find how the mesoscale factor influences the formation
                            of synoptic situations.

                            2. Materials and Methods
                                 The measured data are from two research stations located in the Kongsfjorden and
                            Hornsund fjord (highlighted in Figure 1). Although both fjords are located on the west
                            coast of Spitsbergen (the largest island in the Svalbard archipelago) with latitudes that are
                            only 2 degrees apart, they have different climatic conditions [15]. However, the key point
                            here for us is that both fjords to the east of the measurement stations have glaciers and
                            often snow or ice cover, while to the west of the fjords and the entire island is the Arctic
Atmosphere 2021, 12, 1165                                                                                                3 of 19

                            Ocean with the Greenland Sea, through which the West Spitsbergen Current carries the
                            warmer Atlantic water.

                            Figure 1. Map of research area: Spitsbergen, the main island of the Svalbard archipelago with insets
                            showing the two discussed fjords. Local wind roses for Ny-Ålesund station for the years 1992–
                            2013, for Hornsund station for the years 1993–2013 and large-scale wind rose (from NCEP/NCAR
                            reanalysis) for the years 1992–2013 are presented [13]. Dots on the right map are selected points in
                            the open sea of about 60 km from the stations, with coordinates: 79.125◦ N, 9.125◦ E and 76.875◦ N,
                            13.250◦ E.

                                  In this paper, we compare four types of data, each with a different scale: (i) wind
                            resulting from the large-scale pressure field in data from the NCEP/NCAR reanalysis
                            (referred to in this work as large-scale wind) [16,17]; (ii) air temperature and wind data
                            from the Era-Interim reanalysis (here called the mid-scale); (iii) synoptic situations from
                            Niedźwiedź Svalbard circulation calendar [18]; and (iv) wind in the fjord research station
                            (referred to as local). Mid-scale data and synoptic data may differ only slightly in scale, but
                            the key difference is these data’s separate sources. We consciously use models of different
                            scales since conclusions can be drawn based on the observed and analysed differences.
                            The analyses presented in this work cover a period of 20 years, from 1 January 1994 to
                            31 December 2013.
                                  The calendar of atmospheric circulation types for Spitsbergen is based on synoptic
                            maps of Europe. The description lists 21 types of circulation CT and divides them, de-
                            pending on the type of pressure pattern, into cyclonic (c) and anticyclonic (a) (10 CT each).
                            The direction of air mass advection, i.e., geostrophic wind, is indicated by the letters (N,
                            NE, E, etc.). Situations are labelled apart: Ca, central anticyclone situation (high centre);
                            Ka, anticyclonic wedge or ridge of high pressure; Cc, central cyclonic situation (centre of
                            low); Bc, trough of low pressure (different directions of air flow and frontal system in the
                            axis of the trough). The twenty-first type of circulation is marked with an x and indicates
                            unclassified situations or pressure col. This is explained in detail in [19].
                                  In this work we analysed data from WMO network stations located in the fjords
                            of Western Spitsbergen, i.e., Hornsund and Kongsfjorden (Ny-Ålesund), collected with
                            WMO-standard compliant devices, while automatic stations have also been used in recent
                            years. The data used are the measurements of wind for a period of 20 years at 10 m
                            height and 6 h time resolution include 29,219 datapoints from the Polish Polar Station
                            in Hornsund and 28,612 datapoints from the AWIPEV station, the joint French-German
                            Arctic Research Base – the German Alfred Wegener Institute for Polar and Marine Research
Atmosphere 2021, 12, 1165                                                                                            4 of 19

                            (AWI), and the French Polar Institute Paul Emile Victor (IPEV) in Kongsfjorden [20]. The
                            six-hourly local wind data are the result of temporal 10 min averaged measurements that
                            also accord with WMO standards. In this work we used the land-sea breeze type circulation
                            events identified in [13], using a comparison of local wind data and 10 m winds from the
                            NCEP/NCAR 2.5◦ × 2.5◦ , six-hourly, reanalysis [21]. The choice of the low-resolution
                            NCEP/NCAR reanalysis was not random. The low-density grid minimizes the effect of
                            contaminating the large-scale wind field with assimilated local wind data influenced by
                            the very phenomena under study, allowing us to use it as a large-scale circulation. A high-
                            resolution model could resolve the studied mesoscale orographic and thermal phenomena
                            instead of representing the large-scale circulation.
                                   Air temperature values for the 20-year study are from the Era-Interim 0.125◦ × 0.125◦ ,
                            6-hourly, reanalysis [22]. 2 m temperature is calculated by interpolating between the lowest
                            model level and the Earth’s surface, taking account of the atmospheric conditions [23], who
                            compares air temperature measurements from ground-based weather stations, drifting
                            buoys and the North Pole drifting stations, shows the insignificant overestimation of 2 m
                            temperature in the ERA-Interim reanalysis compilation with observations from coastal
                            stations (the bias does not exceed 0.5 ◦ C), i.e., data from the ground-based meteorological
                            stations are assimilated quite effective. However, the discrepancy between the reanalysis
                            and drifting buoys observations is greater and ranged from −6.95 ◦ C to 0.78 ◦ C and depend
                            on the type of buoy used and the season-in the cold season the difference is much greater.
                            It is also claimed that observational data from the buoys are less reliable than the results of
                            the modeling.
                                   Results were achieved by comparisons of wind data collected in measurement stations
                            which are directed under the strong influence of topography, with large-scale data from
                            reanalysis with spatial resolution high enough (2.5◦ × 2.5◦ ) to exclude the influence of the
                            island and its orography. The effect of topography on wind is clearly visible in the wind
                            roses for stations in fjords (Figure 1), which show that the wind blows mostly along the
                            fjord axis regardless the large-scale wind field. Situations identified as land-sea breeze
                            type circulation events are those where the wind measured at station is from the east
                            while a large-scale pressure field indicates the wind from the west. The head of Hornsund
                            fjord azimuth is at approximately 90 deg. and east winds are defined within a range of
                            0–180 deg. However, Kongsfjorden has a head axis pointing northwest-southeast (head
                            of fjord azimuth at approximately 120 deg. direction) and to find land-sea type breeze
                            circulation events, the range of wind directions measured at the station in Ny-Ålesund was
                            also changed by 30 deg., i.e., 30–210 deg.

                            3. Results
                                 The analysed situations are those where it is possible to detect the dominance of
                            a mesoscale factor over a large-scale factor [13], shows that the local winds are largely
                            independent of large-scale circulation direction. This phenomenon is called land-sea breeze
                            circulation—the circulation between the ice-free sea areas of the warm Spitsbergen current
                            in the west and the much colder glaciers in the east.

                            3.1. Synoptic Circulation Patterns
                                 Most situations that we identify in our work as the land-sea breeze type circula-
                            tion events in the fjords of the Western Spitsbergen were observed at a time when the
                            atmospheric circulation pattern as described according to the calendar of Svalbard circula-
                            tion [18] was one of the eastern type. Nearly 38% of the cases occurred during East (20%)
                            and South-East (18%) cyclonic types of circulation. During the North-East cyclonic and
                            East anticyclonic types of circulation, cases were about 10% each (Figure 2). As can be
                            seen in Figure 3, in as many as 60% of synoptic situations with SEc advection direction,
                            a land-sea breeze type circulation was detected. The same happened in cases of Ec (52%),
                            Ea (47%) and SEa (45%) type of circulations. This shows that the mesoscale factor has
                            a decisive influence on almost half of the synoptic situations causing advection from east
Atmosphere 2021, 12, 1165                                                                                                 5 of 19

                            directions. Meanwhile, one can clearly see that while the synoptic situation was a western
                            circulation (i.e., West, South-West, North-West anticyclonic and cyclonic), the number of
                            observed land-sea breeze type circulation events (detected by comparing wind directions at
                            different scales) was approaching zero. This is mainly due to the fact that the phenomenon
                            is not observed in western circulations since in such a case the direction of the large-scale
                            wind and that of the wind measured at the station (driven by the local conditions) are
                            concurrent, while the basis for marking the case as a land-sea breeze type circulation is
                            the opposing direction of these winds. Moreover, during the period under study (and in
                            general), the Spitsbergen region is less frequently affected by the western and southern
                            type of circulation (e.g., [18,24]) (Figure 2a). In such synoptic situations, the land-sea breeze
                            type circulation is more difficult to notice. As the circulation is more often eastern, most
                            cases are detected. When there are no clear pressure gradients, i.e., when there is a ridge,
                            trough, high or low centre (Ca, Ka, Cc, Bc—on Figure 2), the analysed phenomenon is also
                            visible, much better than in situations that mask it, i.e., western type circulation.
                                 The study area was dominated by east direction of the circulation types throughout
                            the year, regardless of whether a mesoscale land-sea breeze type circulation was recoded
                            or not. No major seasonal differences were found [19], and a quantitative assessment of
                            differences in atmospheric circulation patterns during warming and cooling periods on
                            Spitsbergen (mainly for autumn and winter) is presented.
                                 Eastern types of circulation not only favour land-sea breeze type circulation; it is very
                            possible that it is caused by this mesoscale phenomenon. Figure 3 shows how much the
                            mesoscale land-sea breeze type circulation can affect. If almost 60% of the SEc circulation is
                            associated with the presence of mesoscale circulation, which means that it has impacted it.

                            Figure 2. Distribution of types of synoptic situations (circulation types): (a) during the entire
                            studied period in Svalbard, 1994–2013; (b) when the mesoscale land-sea breeze type circulation was
                            recorded in Hornsund and Ny-Ålesund at the same time; (c) when the mesoscale land-sea breeze
                            type circulation was not visible. 100% is all measurements when this factor is observed. 100% is all
                            measurements when this factor is observed.
Atmosphere 2021, 12, 1165 6 of 19
Figure 3. The conditional probability of the mesoscale land-sea breeze type circulation in each type
of circulation (from Figure 2a), 1994–2013.
3.2. Wind Speed Distribution
Figure 4 shows that the wind measured in the station located in Hornsund (while there
is a land-sea breeze type circulation detected by comparing wind directions at different
scales) usually blows at 6–8 ms−1 . This is 17.4% of the observed cases with the land-sea
breeze type circulation events. At the same time, in the Ny-Ålesund station in Kongsfjorden,
this wind speed corresponds to only 10.7% of cases, and most of the events with land-sea
breeze type circulation in Kongsfjorden are observed with the weakest wind, i.e., less than
2 ms−1 , representing over 30% of all situations (30.5%). During strong winds (>20 ms−1 )
of large scale (Figure 5) and in those measured at stations in fjords, single land-sea breeze
type circulation events were recorded. This is not observed during wind speed higher than
25 ms−1 .
Figure 4. The distribution of wind speed at Hornsund and Ny-Ålesund stations when the mesoscale
land-sea breeze type circulation was recorded, 1994–2013. Black—Hornsund, white—Ny-Ålesund.Atmosphere 2021, 12, 1165 7 of 19
Figure 5. The distribution of large-scale wind speed from the NCEP/NCAR reanalysis at Hornsund
and Ny-Ålesund stations when the mesoscale land-sea breeze type circulation was recorded, 1994–
2013. Black—Hornsund, white—Ny-Ålesund.
Kongsfjorden and Hornsund are two independent fjords whose entrances are located
on the west coast of Spitsbergen, but arranged in a slightly different direction and the wind
blowing along the fjords has a different direction. As described in [13], the circulation of the
land-sea breeze type in the western Spitsbergen fjords is determined by the temperature
difference between the cold glaciers surrounding the fjords and the warmer waters flowing
west of the island. The air temperature gradient on a large scale is generally on the east-west
line, while the Kongsfjorden is positioned differently and the wind speed is lower.
The Hornsund fjord was analysed in more detail. The axis of the fjord is situated along
the longitudinal lines, and exactly on the west side there are warm open waters while on
the east side the land is covered with cold glaciers. The Hornsund fjord is dominated by
the eastern winds [15,24]. During the 20 years under discussion, they account for 94% of
observations, while the prevalence of such circulation in the Hornsund research station
is confirmed by previous studies and their published results. Furthermore, 51.5% of the
eastern winds measured at the station were found to be caused by the mesoscale effect
of land-sea breeze type circulation. Meanwhile, 43% of all wind data collected from the
NCEP/NCAR reanalysis for the same period are cases of eastern winds (57% are cases of
western winds). While a large-scale wind was western, 85.35% of the situation was eastern
wind in the station (i.e., we could notice that the wind direction measured in the station
was opposite to the large-scale one and was oriented from the cold glacier surface towards
the warmer ocean water). Thus, it appears that for 48.6% of all data from reanalysis, the
mesoscale factor had a dominant influence on the wind direction at the station, i.e., the
land-sea breeze type circulation was noticed.
Figure 6 shows that not all cases where easterly winds were measured at the Hornsund
station are related to the mesoscale factor, i.e., land-sea breeze type circulation. Weak winds
of less than 2 ms−1 in only half of the cases are due to the mesoscale factor, and the
remaining measurements indicate an easterly local wind direction consistent with the
easterly direction of the large-scale wind. However, stronger winds are more often than
not the result of this factor. In the case of winds with speeds of 12–20 ms−1 , as many as
94% of the cases (98% in the speed range of 14–16 ms−1 ) resulted from this factor, since at
the time the large-scale wind was in the opposite direction (i.e., westerly).Atmosphere 2021, 12, 1165 8 of 19
Figure 6. Number of east winds measured at Hornsund station for the years 1994–2013 subdivided
by speed. (a) All measurements showing the east wind. (b) Measurements showing the wind from
east when the land-sea breeze type circulation is observed on the basis of the difference in wind
directions. (c) Percentage of winds from east when a mesoscale land-sea breeze observed, in total
measured winds from east for each wind speed range.
3.3. Near Zero Large-Scale Wind
So far, it has been shown that the land-sea breeze type circulation is easiest to observe
when the direction of the local wind resulting mostly from the difference in temperature
between a cold glacier and the warmer surface of the ocean is eastern while the large-scale
wind is western. The dominance of mesoscale influence can also be noticed in the case of
western wind directions. 13% of all data from the analysed period represent conditions
wherein both the large-scale wind and the wind measured in the Hornsund station blow
from western sector. In such situations, as much as 75.5% of the cases point to a factor
that influences the wind speed since the speed measured in the station is smaller than the
wind resulting from the large-scale pressure field following reanalysis. In some cases of
large-scale winds from western sector, the mesoscale influence does not affect decisively
the change in the direction of the blowing wind but significantly reduces its speed. The
averaged difference between the one measured in Hornsund and the large-scale wind
speed in our calculations is 4.6 ms−1 . The distribution of the difference in speed from the
reanalysis and speed measured at the Hornsund station when the winds in both scales
were western is presented on Figure 7. At the same time, it should be noted that earlier
in this study over 85% of large-scale western winds were shown to be influenced by local
factors and had a different direction at the station.
For the analysed period, only 1.5% of the data describing the large scale wind are
those representing near-zero velocity, i.e., in the velocity range of 0 to 1 ms−1 . Therefore,
the range of 0 to 2 ms−1 , which includes 5.4% of the reanalysis data, was adopted for
further calculation. Figure 8 shows that easterly winds dominate in Hornsund at the time,
accounting for 69.4% of cases. It is therefore possible to see the influence of the mesoscale
factor on the synoptic situation. The maximum wind speed observed during the analysed
period was 19 ms−1 , even though the large-scale wind field implied winds close to zero.
Moreover, the average speed of easterly winds in such situation is 5 ms−1 . The remaining
24.4% of situations where there is a westerly wind observation with a large-scale wind near
zero cannot be ignored. However, such situations are clearly uncommon and their average
speed is 3.4 ms−1 , which is also significantly lower than that of the easterly winds. 6.2% of
cases are calm (Figure 8).Atmosphere 2021, 12, 1165 9 of 19
Figure 7. The histogram shows the distribution of the difference in wind speed from the reanalysis
and speed measured at the Hornsund station for the period 1994–2013 when the winds in both scales
were western.
Figure 8. Wind rose showing wind from Hornsund station for the 1994–2013 when the large-scale
wind velocity is 0–2 ms−1 .
3.4. Air Temperature and Its Influence
Using data from the Era-Interim reanalysis, a 2 m air temperature difference was
calculated for a point in the nearest surroundings of the Hornsund research station, a point
about 60 km away towards the open ocean along a line tracing the axis of the fjord, a point
nearby at the base in Ny-Ålesund, and a corresponding point at sea (indicated in Figure 1).
The temperature differences were contrasted with the corresponding differences in wind
velocity measured at the stations and the resulting wind from the large-scale pressure field
(Figure 9) at the time when the mesoscale land-sea breeze type circulation was observed.
In the situations analysed, wind speed does not depend linearly on this temperature
difference. In the great majority of cases, and in agreement with the supposition that this is
a factor resulting from the temperature difference influencing the atmospheric circulation,
the temperature above water was higher than that above the island. In Kongsfjorden, thereAtmosphere 2021, 12, 1165 10 of 19
were 1545 cases with the opposite situation, i.e., the air temperature over water was lower
than over land, which is 13.8% of all captured (by observing change in the wind direction)
land-sea breeze type circulation events. In Hornsund, 626 such cases were recorded which
respectively represent only 4.4%, a rather small fraction of the total of land-sea breeze type
circulation events detected.
Figure 9. Graphs representing dependence of the air temperature difference at the station and
over the open sea and the difference of large-scale and local wind velocity in Hornsund (left panel)
and Kongsfjorden (right panel) when the mesoscale land-sea breeze type circulation was observed
between 1994 and 2013.
Table 1 compiles some temperature values that describe the situation when it is warmer
over land than over water, and the land-sea breeze type circulation is noticeable. The data
were also analysed in terms of the seasons in which this “opposite” situation occurred and
the air was warmer over land than over the sea especially in summer (JJA), accounting
for 1.78% of all cases of land-sea breeze type circulation in Hornsund, and as much as
10.1% in Kongsfjorden. The proportion is lowest in winter (DJF) where it is 0.57% for
Hornsund and only 0.43% for Kongsfjorden. The other two seasons are as follows: spring
(MAM)—0.58% Hornsund and 0.80% Kongsfjorden; autumn (SON)—1.47% Hornsund and
2.45% Kongsfjorden. Such an uneven distribution over the seasons, which additionally
differs in both fjords, is related to the influence of the ocean on climate in Hornsund and
Kongsfjorden, causing the amplitude of annual air temperature to be smaller in Hornsund
than in Kongsfjorden. We also know that the air temperature in summer is higher in
Kongsfjorden than in Hornsund but reversed in winter [15].
The few cases where large-scale and local wind directions indicate the dominant
influence of a mesoscale factor and that it is unrelated to the temperature differences (i.e.,
over open water it is not warmer than over land) are rather difficult to explain by the
mesoscale land-sea breeze type circulation. They can be caused by even smaller scale
processes such as katabatic winds. In the case of Svalbard, where there are no very large
plateaus that can be heated more effectively by solar radiation in summer, these phenomena
are of lesser importance and of a smaller scale, but they do occur. It occurs more often in
Kongsfjorden than in Hornsund since there are no such large glaciers east of the station
in Hornsund. In addition, small-scale processes may occur more frequently in summer
than in winter due to the uneven heating of land fragments locally, e.g., capes, peninsulas,
mountainsides, etc. Small-scale processes should include not only katabatic winds, but
also valley winds, adiabatic winds and other orography-related phenomena [25] that are
smaller in scale and extent than mesoscale land-sea breeze type circulation.Atmosphere 2021, 12, 1165 11 of 19
Table 1. Maximum, minimum and average temperature values over land and open water (and their differences) when a land-sea breeze type circulation is noticed and air temperature is
lower over the ocean.
Maximum Temperature Minimum Temperature Maximum Temperature over Minimum Temperatur over
at Station at Station Open Water Open Water
Mean Mean Mean
Maximum Temperature
Temperature Temperature Temperature Respectively Respectively Respectively Respectively
Difference at Station over Open
Difference Over Over Water
Open Difference Open Difference At the Difference At the Difference
Water Water Station Station
Hornsund −0.41 −2.48 0.65 6.65 4.41 −2.24 −18.84 −19.31 −0.47 0.25 5.59 6.01 −0.42 −19.31 −18.84 −0.47
Kongsfjord −0.86 −4.03 3.02 8.76 8.39 −0.37 −14.65 −15.16 −0.50 2.17 8.46 8.62 −0.15 −15.16 −14.65 −0.50Atmosphere 2021, 12, 1165 12 of 19
The distribution of the atmospheric circulation patterns in situations where there
is a land-sea breeze type circulation but with an opposite temperature according to the
Era-Interim reanalysis (Figure 10), i.e., warmer over land than over the open water, is
very similar to the distribution in all events of land-sea breeze type circulation (Figure 2).
Most cases occurred during eastern and south-eastern circulation types. The largest clear
deviation is the relatively larger number of measurements when the Niedzwiedz’s calendar
reports that ridge or trough (Ka, Bc) has prevailed, during which there is no decisive
pressure gradient and therefore small-scale processes are of utmost significance. These
accounted for about 20% of the data discussed (22.2% in Hornsund, 19.7% in Kongsfjorden).
Practically, this means that such cases account for less than 1% of all the events of land-sea
breeze type circulation we observe at Hornsund.
Figure 10. Distribution of types of synoptic situations (circulation types) when the mesoscale effect
was recorded in Hornsund and Ny-Ålesund on the basis of the difference in wind directions in West
Spitsbergen fjords, but with temperature over open water being lower than over land.
The wind speed distribution plots from the NCEP/NCAR reanalysis data in both
studied fjords (left panels on Figure 11) show that the large-scale situation (when there is
land-sea breeze type circulation observable and lower temperature over the sea than land
are similar to that covering all cases of land-sea breeze type circulation cases regardless of
air temperature (Figure 9). The wind speed measured at the Hornsund station (right top
panel in Figure 11) in the analysed situations is most often in the range 0–10 ms−1 , which
is 86.6%. In Kongsfjorden, as much as 48.5% are wind speed measurements of 2 ms−1 or
less. It is important to note that this is only part of a small percentage of the data when
the temperature difference over water and land did not correspond to the wind direction.
At Hornsund, the wind blowing as a result of the mesoscale factor had higher speeds
(Figure 4), mostly around 7 ms−1 . In these situations, where the temperature is reversed
and smaller scale processes play a major role, the wind speeds are lower. Wind speeds of
no more than 6 ms−1 account for 53%.Atmosphere 2021, 12, 1165 13 of 19
Figure 11. The distribution of large-scale wind speed from the NCEP/NCAR reanalysis and local
wind speed from stations in Hornsund and Ny-Ålesund when the mesoscale factor visibly dominated
the large-scale one, but with temperature over open water being lower than over land between 1994
and 2013.
4. Discussion and Conclusions
Climatologically, Spitsbergen is located in the easterly wind zone, and it is thus not
surprising that the dominant wind direction at the meteorological stations on the island
is easterly (Figure 12). However, if we look at the wind rose drawing made from the
NCEP/NCAR reanalysis data, the dominance of the eastern sector over others is not so
clear. Taking a look at the mean pressure field derived from the Era-Interim reanalysis data
in Figure 13 (with a much denser grid than NCEP/NCAR), it also shows no dominance
of the eastern sector wind, a dominance that has been corroborated (as proven by 94%
of the measurements during the investigated period). This is due to the fact that wind
directions are influenced by smaller scale phenomena in addition to the pressure gradients
of the large-scale field. Comparison of data from Svalbard stations (Bjørnøya, Hopen and
Ny-Ålesund) with NCEP/NCAR and ERA-Interim reanalysis by [26] also shows wind
direction indices that are characterized by different tendencies, and are caused by local
factors. For Svalbard these trends are spatially varying.
We argue that the determining factor responsible for increasing the frequency of
easterly winds at Hornsund and other eastern Spitsbergen stations is the mesoscale land-
sea breeze type circulation [13]. This is caused by the temperature difference between the
cold east of the island and the warm waters west of the island. Since the West Spitsbergen
Current, carrying warm Atlantic water from the south, flows through the region we
study [14], the waters west of Spitsbergen do not freeze. It happens that sea ice that occurs
coming in from the north or south from the Storfjordrenna results in lower air temperature.
However, these are situations where the influence on the mesoscale circulation is negligible,
except for episodic exceptions. Figure 13 (left panel) shows the averaged air temperature
field based on data from the Era-Interim reanalysis for the study period. The mean air
temperature is significantly lower over land than over water. This applies to both the mean
of the entire period and the individual seasons during that time. Of course, the average
field is not indicative of all instantaneous air temperature distributions. In Figure 9, we
show the differences in air temperature over sea and land for all measurements whereby
the land-sea breeze type circulation events were noticed. At Hornsund, only 4.4% of these
differences are negative. The greatest number of negative differences were recorded during
the summer months. In summer, large areas of land are free of snow and ice, which makesAtmosphere 2021, 12, 1165 14 of 19
it warmer, and at the same time it happens that the West Spitsbergen Current carries ice
fields that have drifted around the Sørkapp [27], causing the air temperature gradient to be
in the opposite direction-higher temperature over land, lower over sea. For this reason,
the probability of a mesoscale breeze occurring in summer is the lowest [13]. In this case,
changes in wind direction relative to the large-scale winds may be induced by smaller-scale
impacts caused by uneven ground heating. This can also be seen in the mean sea level
pressure distributions at different times of the year (Figure 13). The difference in mean sea
level pressure in summer is smaller than in other seasons.
The breeze pattern cannot be distinguished from the actual wind field pattern since
this mesoscale effect affects the pressure field and the field always. Only a matter of proper
choice of the model grid gives the possibility to observe different scales of wind fields. It
can be a wind field resulting only from the global pressure distribution or a field that takes
into account the local orography. In this case, we look at the mesoscale effect accounting
for the east-west air temperature difference, which is evident in the Era-Interim reanalysis
data with a 0.125◦ × 0.125◦ spatial resolution, regardless of season.
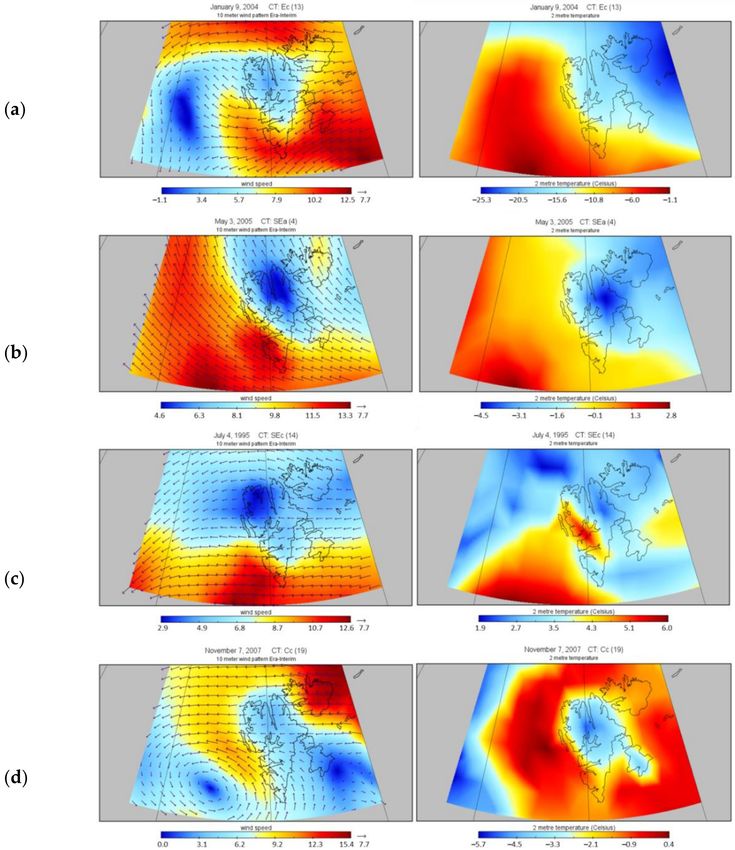
A compilation of the distributions of 10 m wind speed and direction and air tempera-
ture at a height of 2 m from the Era-Interim reanalysis data at the time of observing the
land-sea breeze type mesoscale circulation is shown in Figure 14. These graphs represent
the situation at different times of the year and during different observed circulation types
according to the Niedźwiedź’s Calendar. The distributions show that the data from a dense
grid model such as Era-Interim 0.125◦ × 0.125◦ reproduce the u component of the wind
as measured, i.e., the local wind measured at the stations blew from the east, opposite
to the large-scale wind. The air temperature distributions are also consistent with the
conclusion that the occurrence of a breeze type circulation is usually determined by the air
temperature difference. However, Figure 14c shows a situation on one day in the summer
of 1995, when the air temperature over the island was higher than over the open water, but
still a mesoscale land-sea breeze type circulation was observed, and the type of circulation
that occurred at that time was Sec, which is one of the most frequently found when a breeze
circulation was observed despite the higher temperature in the east (Figure 10). Southwest
of Spitsbergen there is a large area of high-temperature air (>5 ◦ C), and low temperatures
persist over the eastern part of the island (and further east as well), which ultimately results
in the mesoscale effect being maintained despite a partially summer-heated land surface.
Figure 12. Local wind rose for (a) Hornsund station for the years 1992–2013, and (b) large-scale wind rose (from
NCEP/NCAR reanalysis) interpolated for the position of the Hornsund station for the years 1993–2013 [13].Atmosphere 2021, 12, 1165 15 of 19
Figure 13. Distribution of mean 2 m temperature (top left panel) and mean sea level pressure (top
right panel) in Svalbard region from 1994 to 2013 and below the distributions in the following
seasons—spring, summer, autumn, and winter. Data derived from Era-Interim reanalysis.Atmosphere 2021, 12, 1165 16 of 19
Figure 14. Distribution of 10 m wind speed and direction (left panels) and 2 m air temperature (right
panels) obtained from Era-Interim with grid 0.125◦ × 0.125◦ . The following rows correspond to
land-sea breeze type circulation events in consecutive seasons: (a) 9 January 2004, CT: Ec; (b) 3 May
2005, CT: SEa; (c) 4 July 1995, CT: SEc; (d) 7 November 2007, CT: Cc.
An analysis of wind data in conjunction with Niedzwiedz’s Calendar (Figure 2),
which defines the direction and type of air mass circulation on the basis of synoptic maps,
leads to the conclusion that the mesoscale breeze type circulation most often occurs in
synoptic situations, causing eastern cyclonic circulation (Ec) as well as southeasterly and
northeasterly cyclonic circulation (SEc, NEc). The occurrence of breeze type circulation
is also the cause of numerous cases of easterly anticyclonic circulations according to
Niedzwiedz’s Calendar. In Figure 3, it can be seen that we recorded a change in local
wind direction relative to the large-scale wind direction in as much as 60% of the SEc
circulation and in close to 40% of the Ea, SEa, NEc, Ec, and Sc circulations. In westerly
circulations it is not possible to determine the occurrence of a mesoscale land-sea breeze
type circulation since a local westerly wind means either that kind of circulation did not
exist or that the gradient of the large-scale pressure field was so large that the land-sea
breeze type circulation could not eventuate. Nevertheless, in this case the temperature
gradient also affects the wind field and reduces its speed. The influence of atmosphericAtmosphere 2021, 12, 1165 17 of 19
circulation on the spatial pattern of air temperature is not homogenous and significant
differences were observed between onshore and inland parts of Svalbard [28], as well as
changes throughout the year.
The mesoscale impact is most easily detectable when the synoptic situation is such
that it gives eastern inflows in the Svalbard area. At the same time, the whole region
comprises the area where the large-scale eastern circulation is dominant, thereby rendering
the mesoscale eastern influence noticeable using the wind direction parameter even if only
for a few days of the year. However, we have shown that the mesoscale effect on the wind
field is noticeable in various ways in different situations. If this is not evident by the change
in wind direction measured at the meteorological station relative to the large-scale wind,
it is evident in the wind speed, which is reduced for westerly winds by the influence of
the mesoscale effect. The influence of the mesoscale land-sea breeze circulation is also
evident for weak winds, which often turn out to be much stronger at the station than at the
large scale. Figure 7 shows the distribution of differences between the west wind speed
values from the large-scale model and the speed measured in Hornsund. The distribution
is asymmetric, indicating lower westerly wind speeds at Hornsund that would have been
implied by the large-scale pressure gradients.
East winds are induced or amplified by the mesoscale effect of the air temperature
gradient. The most commonly recorded wind speeds is about 7 ms−1 even though the
mesoscale effect can also be found in very strong winds of 22 ms−1 . Such high speeds
are possibly caused by the mesoscale land-sea breeze type circulation effects, but the
phenomenon may also be further enhanced by orography (wind channelling, fen effects,
katabatic winds, etc.), which cannot be ignored. The large influence of katabatic winds
on climate formation in polar region was indicated by [29], showing also that winds of
this type, such as the mesoscale land-sea breeze type circulation events analysed in this
work, are much more frequent in winter (up to 55% per month) than in summer (no more
than 11%).
In [13], we were able to demonstrate that the phenomenon is mesoscale and occurs
simultaneously within a long distance along the west coast of Spitsbergen. However, we
still do not know how many of these are cases of small-scale processes. In some cases, we
have observed that the air temperature over the water west of the station is lower than that
near the station and a westerly wind is deduced from the large-scale pressure field, yet an
easterly wind is measured locally. We believe that small-scale processes such as katabatic,
downslope, valley winds, or others, which result from local heating of the land surface by
solar radiation, are responsible for this. This occurs mainly in summer.
The prevalence of easterly winds in the studied area causes the current to turn north-
ward (Ekman flow, e.g., [2]), so that the mesoscale circulation is one of the reasons for this
flow. This implies that the mesoscale effect, which has a significant influence on wind
direction and speed, is an important factor with effect on water flow in the West Spitsbergen
Current region. This will be the subject of a future study.
During the study period, a few degrees of warming (about 4◦ C according to [14]) did
not significantly change the frequency of the land-sea breeze type circulation. Changes to
the Arctic climate do not affect this local mesoscale effect since there are still glaciers on land
and warmer water to the west of Spitsbergen, which still ensure a temperature difference
that generates airflow. It is possible that with further climate warming, when glaciers will
disappear or their area will be only a percentage of the present one, the phenomenon will
not occur.
Author Contributions: Conceptualization, M.K. and T.P.; data curation, M.K.; formal analysis, M.K.;
funding acquisition, T.P.; investigation, M.K.; methodology, M.K. and T.P.; project administration,
T.P.; resources, M.K.; software, M.K.; supervision, M.K.; validation, M.K. and T.P.; visualization, M.K.;
writing—original draft, M.K.; writing—review and editing, M.K. and T.P. All authors have read and
agreed to the published version of the manuscript.
Funding: This research received no external funding.Atmosphere 2021, 12, 1165 18 of 19
Institutional Review Board Statement: Not applicable.
Informed Consent Statement: Not applicable.
Data Availability Statement: No new data were created or analyzed in this study. Data sharing is
not applicable to this article.
Acknowledgments: We thank Tomasz Wawrzyniak and Hornsund Polish Polar Station staff for the
meteorological data used in this paper. We also thank Marion Maturilli from Alfred Wegener Institute,
Helmholtz Centre for Polar and Marine Research, Potsdam, Germany, for the Kongsfjord data.
Conflicts of Interest: The authors declare no conflict of interest.
References
1. Esau, I.; Argentini, S.; Przybylak, R.; Repina, I.; Sjöblom, A. Svalbard Meteorology. Adv. Meteorol. 2012, 2012, 1–3. [CrossRef]
2. Goszczko, I.; Ingvaldsen, R.B.; Onarheim, I.H. Wind-Driven Cross-Shelf Exchange—West Spitsbergen Current as a Source of Heat
and Salt for the Adjacent Shelf in Arctic Winters. J. Geophys. Res. Oceans. 2018, 123, 2668–2696. [CrossRef]
3. Polyakov, I.V.; Walsh, J.; Kwok, R. Recent Changes of Arctic Multiyear Sea Ice Coverage and the Likely Causes. Bull. Am. Meteorol.
Soc. 2012, 93, 145–151. [CrossRef]
4. Alkama, R.; Koffi, E.N.; Vavrus, S.J.; Diehl, T.; Francis, J.A.; Stroeve, J.; Forzieri, G.; Vihma, T.; Cescatti, A. Wind amplifies the
polar sea ice retreat. Environ. Res. Lett. 2020, 15, 124022. [CrossRef]
5. Holliday, N.P.; Bersch, M.; Berx, B.; Chafik, L.; Cunningham, S.; Florindo-López, C.; Hátún, H.; Johns, W.; Josey, S.A.; Larsen,
K.M.H.; et al. Ocean circulation causes the largest freshening event for 120 years in eastern subpolar North Atlantic. Nat. Commun.
2020, 11, 1–15. [CrossRef]
6. Mioduszewski, J.; Vavrus, S.; Wang, M. Diminishing Arctic Sea Ice Promotes Stronger Surface Winds. J. Clim. 2018, 31, 8101–8119.
[CrossRef]
7. Hughes, M.; Cassano, J.J. The climatological distribution of extreme Arctic winds and implications for ocean and sea ice processes.
J. Geophys. Res. Atmos. 2015, 120, 7358–7377. [CrossRef]
8. Fraser, N.J.; Skogseth, R.; Nilsen, F.; Inall, M.E. Circulation and exchange in a broad Arctic fjord using glider-based observations.
Polar Res. 2018, 37, p1. [CrossRef]
9. Repina, I.A.M. Obukhov Institute of Atmospheric Physics RAS; M.V. Lomonosov Moscow State University The sea surface and
the katabatic flow interaction in the fjords of Spitsbergen. Sovrem. Probl. Distantsionnogo Zondirovaniya Zemli Kosm. 2018, 15,
217–228. [CrossRef]
10. Spall, M.A.; Jackson, R.H.; Straneo, F. Katabatic Wind-Driven Exchange in Fjords. J. Geophys. Res. Oceans 2017, 122, 8246–8262.
[CrossRef]
11. Sundfjord, A.; Albretsen, J.; Kasajima, Y.; Skogseth, R.; Kohler, J.; Nuth, C.; Skarðhamar, J.; Cottier, F.; Nilsen, F.; Asplin, L.; et al.
Effects of glacier runoff and wind on surface layer dynamics and Atlantic Water exchange in Kongsfjorden, Svalbard; a model
study. Estuarine Coast. Shelf Sci. 2017, 187, 260–272. [CrossRef]
12. Cisek, M.; Petelski, T.; Zielinski, T.; Makuch, P.; Pakszys, P.; Rozwadowska, A.; Markuszewski, P. Aerosol Optical Depth variations
due to local breeze circulation in Kongsfjorden, Spitsbergen. Oceanologia 2017, 59, 422–430. [CrossRef]
13. Kitowska, M.; Makuch, P.; Petelski, T.; Piskozub, J. The influence of mesoscale l and–sea breeze circulation on local wind
climatology in the Svalbard fjords of Kongsfjorden and Hornsund. Int. J. Clim. 2021, 41, 832–841. [CrossRef]
14. Walczowski, W.; Piechura, J. Influence of the West Spitsbergen Current on the local climate. Int. J. Clim. 2011, 31, 1088–1093.
[CrossRef]
15. Cisek, M.; Makuch, P.; Petelski, T. Comparison of meteorological conditions in Svalbard fjords: Hornsund and Kongsfjorden.
Oceanologia 2017, 59, 413–421. [CrossRef]
16. NCEP. Reanalysis Data Provided by the NOAA/OAR/ESRL PSD, Boulder, CO, USA. Available online: https://www.esrl.noaa.
gov/psd/ (accessed on 20 May 2018).
17. NOAA. High Resolution SST Data Provided by the NOAA/OAR/ESRL PSD, Boulder, CO, USA. Available online: https:
//www.esrl.noaa.gov/psd/ (accessed on 20 May 2018).
18. Niedźwiedź, T. Calendar of Circulation Types for the Territory of Spitsbergen. 2013. Available online: http://klimat.wnoz.us.edu.
pl/#!/podstrony/kalendarztn (accessed on 10 January 2021).
19. Łupikasza, E.B.; Niedźwiedź, T. The Influence of Mesoscale Atmospheric Circulation on Spitsbergen Air Temperature in Periods
of Arctic Warming and Cooling. J. Geophys. Res. Atmos. 2019, 124, 5233–5250. [CrossRef]
20. Maturilli, M.; Herber, A.; König-Langlo, G. Climatology and time series of surface meteorology in Ny-Ålesund, Svalbard. Earth
Syst. Sci. 2013, 5, 155–163. [CrossRef]
21. Kalnay, E.; Kanamitsu, M.; Kistler, R.; Collins, W.; Deaven, D.; Gandin, L.; Iredell, M.; Saha, S.; White, G.; Woollen, J.; et al. The
NCEP/NCAR 40-Year Reanalysis Project. Bull. Am. Meteorol. Soc. 1996, 77, 437–471. [CrossRef]
22. Dee, D.P.; Uppala, S.M.; Simmons, A.J.; Berrisford, P.; Poli, P.; Kobayashi, S.; Andrae, U.; Balmaseda, M.A.; Balsamo, G.; Bauer, P.;
et al. The ERA-Interim reanalysis: Configuration and performance of the data assimilation system. Q. J. Roy. Meteor. Soc. 2011,
137, 553–597. [CrossRef]Atmosphere 2021, 12, 1165 19 of 19
23. Demchev, D.M.; Kulakov, M.Y.; Makshtas, A.P.; Makhotina, I.A.; Fil’Chuk, K.V.; Frolov, I.E. Verification of ERA-Interim and ERA5
Reanalyses Data on Surface Air Temperature in the Arctic. Russ. Meteorol. Hydrol. 2020, 45, 771–777. [CrossRef]
24. Marsz, A.; Styszyńska, A. Climate and Climate Change at Hornsund, Svalbard; Marsz, A.A., Styszyńska, A., Eds.; The Publishing
House of Gdynia Maritime University: Gdynia, Poland, 2013; 402p, ISBN 978-83-7421-191-8.
25. Esau, I.; Repina, I. Wind Climate in Kongsfjorden, Svalbard, and Attribution of Leading Wind Driving Mechanisms through
Turbulence-Resolving Simulations. Adv. Meteorol. 2012, 2012, 1–16. [CrossRef]
26. Pilguj, N.; Kolendowicz, L.; Kryza, M.; Migała, K.; Czernecki, B. Temporal changes in wind conditions at Svalbard for the years
1986–2015. Geogr. Ann. Ser. A Phys. Geogr. 2018, 101, 136–156. [CrossRef]
27. Promińska, A.; Cisek, M.; Walczowski, W. Kongsfjorden and Hornsund hydrography–comparative study based on a multiyear
survey in fjords of west Spitsbergen. Oceanologia 2017, 59, 397–412. [CrossRef]
28. Przybylak, R.; Araźny, A.; Ulandowska-Monarcha, P. The influence of atmospheric circulation on the spatial diversity of air
temperature in the area of Forlandsundet (NW Spitsbergen) during 2010–2013. Int. J. Clim. 2018, 38, 230–251. [CrossRef]
29. Nylen, T.H.; Fountain, A.G.; Doran, P.T. Climatology of katabatic winds in the McMurdo dry valleys, southern Victoria Land,
Antarctica. J. Geophys. Res. Space Phys. 2004, 109. [CrossRef]You can also read


