Synergy of diffraction and spectroscopic techniques to unveil the crystal structure of antimonic acid
←
→
Page content transcription
If your browser does not render page correctly, please read the page content below
www.nature.com/scientificreports
OPEN Synergy of diffraction
and spectroscopic techniques
to unveil the crystal structure
of antimonic acid
S. F. Mayer1*, J. E. Rodrigues1,2, I. Sobrados1, J. Gainza1, M. T. Fernández‑Díaz3, C. Marini4,
M. C. Asensio1 & J. A. Alonso1
The elusive crystal structure of the so-called ‘antimonic acid’ has been investigated by means of
robust and state-of-the-art techniques. The synergic results of solid-state magic-angle spinning
nuclear magnetic resonance spectroscopy and a combined Rietveld refinement from synchrotron
X-ray and neutron powder diffraction data reveal that this compound contains two types of protons,
in a pyrochlore-type structure of stoichiometric formula (H3O)1.20(7)H0.77(9)Sb2O6. Some protons belong
to heavily delocalized H3O+ subunits, while some H+ are directly bonded to the oxygen atoms of the
covalent framework of the pyrochlore structure, with O–H distances close to 1 Å. A proton diffusion
mechanism is proposed relying on percolation pathways determined by bond-valence energy
landscape analysis. X-ray absorption spectroscopy results corroborate the structural data around Sb5+
ions at short-range order. Thermogravimetric analysis and differential scanning calorimetry endorsed
the conclusions on the water content within antimonic acid. Additional 0.7 water molecules per
formula were assessed as moisture water by thermal analysis.
One of the long-standing chemical identity issues is that corresponding to the so-called ‘antimonic acid’ (here-
after: AA), also referred to as hydrated antimony pentoxide (frequently termed HAP), antimony oxide hydrates,
and Sb(V) hydroxide. This material has proven useful for a variety of applications due to its distinctive proton-
conducting nature1–4, ionic e xchangeability5–10, and radiation r esistance7, serving as potential candidate for
photocatalyst11,12, fuel cells e lectrolyte13,14, heavy metals r emover15,16, and for its application in electrochromic
displays3 or as precursor of several useful d erivatives7,11,17–19, among others. This enigmatic substance was already
described by J.J. Berzelius. In his pioneering work in 1812, Berzelius p ublished20 the preparation of a ‘hydrated
antimony pentoxide’ by treating alkali antimonate with diluted nitric acid, while his junior student H. Rose
synthesized it in 1824 by hydrolysis of antimony pentachloride21. One of the earliest structural discussions
concerning AA salts dates back from the mid-nineteenth century, where oxygen/metal ratios were elucidated,
and six-sided crystals of magnesium, cobalt, and nickel antimonates are successfully synthesized22. More than a
100 years later, the atomic arrangement within the crystal of this elusive compound (or more properly speaking,
series of compounds) is still being a topic of debate. Perhaps the first modern review gathering all these results
is the one presented by J. W. Mellor17 in 1929. The most accepted formula for AA is Sb2O5·xH2O; depending on
the synthesis and water content; water amounts varied from one to six H 2O molecules per formula unit. A few
years later, L. Pauling suggested the formula HSb(OH)6, equivalent to that of Sb2O5·7H2O, as the most likely
composition for the acid phase23. This was supported by the water amount in the crystals and the ionic radius
and behaviour of the S b5+ cation, and it was widely accepted as a base of further compositional and structural
determinations7,24–27. So forth, although researchers took many efforts to define the composition of AA, the
crystal structure was totally unknown, perhaps given the difficulty of obtaining well-crystallized samples.
In a big attempt to shed light on the plausible structures adopted by AA-type compounds, Abe and Ito28 syn-
thesized AA samples from antimony pentachloride under different acidic conditions, temperatures, and aging
times, obtaining solids tagged as amorphous, glassy, and crystalline s olids1. They demonstrated that the crystal-
line phase can be fostered at higher acid concentrations, longer aging times, and suitable aging temperatures,
1
Instituto de Ciencia de Materiales de Madrid (ICMM), Consejo Superior de Investigaciones Científicas (CSIC), Sor
Juana Inés de la Cruz 3, 28049 Madrid, Spain. 2European Synchrotron Radiation Facility, ESRF, 71 Avenue des
Martyrs, 38043 Grenoble, France. 3Institut Laue Langevin (ILL), BP 156X, 38042 Grenoble, France. 4CELLS-ALBA
Synchrotron, Cerdanyola del Valles, 08290 Barcelona, Spain. *email: s.mayer@csic.es
Scientific Reports | (2021) 11:17763 | https://doi.org/10.1038/s41598-021-97147-0 1
Vol.:(0123456789)
www.nature.com/scientificreports/
regardless of the starting phase employed. The crystalline solid, of formula unit S b2O5·4H2O, was defined in
the Fd3m space group, with a lattice constant of 10.38 Å. This was the first time that a pyrochlore-type phase
was effectively defined for the AA crystalline oxides. With 6 days of difference, Baetsle and Huys announced
similar results for AA samples obtained from K and Na antimonates, with similar unit-cell parameters and same
compositions5, also concomitant with pioneering properties predicted for hydrated Sb2O529.
In the present work, we have chosen a straightforward synthesis procedure, to our best knowledge described
for the first time by Ozawa et al.3, yielding well-crystallized powder samples from easy-to-handle reactants,
namely Sb2O3 and H 2O2. It has been characterized by state-of-the-art techniques including neutron and syn-
chrotron X-ray diffraction (NPD and SXRD, respectively), solid-state magic-angle spinning nuclear magnetic
resonance spectroscopy (MAS NMR) and local order techniques like X-ray absorption spectroscopy (XAS),
in complement with thermogravimetric analysis and differential scanning calorimetry (TGA/DSC), as well as
scanning electron microscope (SEM). Our findings agree on a consistent picture of the atom-scale arrangement
of AA, in a pyrochlore-type framework containing both H 3O+ and H+ units accounting for the acidic behaviour
of this material.
Results and discussion
Long‑range order structural determinations. Crystalline AA powder was obtained in the form of a
colloidal slurry by soft-chemistry procedures as described in “Methods”. The obtained compound of nominal
formula (H3O)pH2−pSb2O6 and defect pyrochlore-type crystal structure has been investigated using long- and
short-range characterization techniques, in order to determine its composition and atomic arrangement. Firstly,
a peak indexing over a laboratory XRD pattern was performed as shown in Fig. 1a, confirming that AA adopts
a cubic pyrochlore-type structure belonging to the Fd3m (# 227, Oh7) space group, in agreement with previous
reports3,28. Briefly, pyrochlore-type oxides present a general formula A2B2O6O′, where A is a voluminous mono-,
di- or trivalent cation, B is a smaller metal of higher oxidation state, and O′ is an oxygen atom that can be par-
tially or even entirely absent, giving rise to the so-called defect pyrochlores A2B2O6O′1−δ. When O′ is present, two
structural groups can be identified within the unit cell: a main covalent framework of B2O6 corner-sharing octa-
hedra, and a sub-lattice A2O′, interspersed in a tetrahedral arrangement. Once the XRD data of AA were indexed
in the Fd3m space group, the crystalline structure was fully determined by a combined Rietveld refinement from
SXRD and NPD data collected at room temperature. Patterns from NPD and SXRD data contained sharp dif-
fraction peaks, consistent with a cubic pyrochlore phase with a = 10.36052(15) Å, as displayed in Fig. 1b,c. An
origin choice # 2 at 3m was adopted for this analysis. The in-detail refinement procedure is described in the Sup-
plementary Information, while the refinement parameters can be found in “Methods”.
The final refinement includes Sb and O1 atoms located at 16d (1/2,1/2,1/2 ) and 48f (x,1/8,1/8 ) Wyckoff sites,
constituting the covalent S b2O62− framework of the pyrochlore oxide. Two types of H atoms were identified: H1
located at 96g (x,x,z) sites, constituting together with the O2 atoms at 32e (x,x,x) the hydronium H3O+ units,
and H2 species located at 48f (x,1/8,1/8) positions, directly linked to the Sb2O6 covalent framework. O2 can be
considered to be the O′ atoms of the standard pyrochlore structure. Ultimately, the individual atomic anisotropic
displacement factors for each non-equivalent atom were determined, with the only exception of the H2 species,
which was modelled as an isotropic sphere. This is due to a strong divergence of the model when attempted to
be anisotropically determined, probably due to its vicinity to the resonant H1 atom. Attempts to incorporate
additional water or hydronium molecules within the structure, as for example centred at 8b sites occupying the
empty cages generated by the main framework or along the main diagonal (as reported by Slade et al.30), resulted
in atomic site occupation factors (SOFs) close to zero, many times even reaching negative isotropic displace-
ment factors. This way, tens of feasible structural alternatives and atomic incorporations were discarded, many
of which containing constrains or restrains varying O–H bond length distances and O2/H1,2 SOF ratios. No
preferred orientation is expected to occur due to the isotropy of the cubic structure and the octahedral shape
of AA microcrystals, and neither the parameters of preferred orientation nor roughness were refined as they
showed no improvement in the reliability factors.
Occupancies of H1, H2, and O2 atoms were constrained to each other according to the MAS NMR analysis,
and strongly endorsed by a TGA/DSC study, as explained in the water and proton content assessment section;
occupancy constrains partially relied on the electroneutrality of the crystal structure. For the Sb and O1 ele-
ments, small displacement ellipsoids were obtained (Ueq = 0.98(2) × 10−2 and 0.83(10) × 10−2 Å2, respectively),
denoting small vibrational and delocalization of the scattering contributions. In contrast, although far smaller
than those obtained in the ‘Case B’ scenario described in the Supplementary Information, O2 and H1 atoms
belonging to the hydronium units exhibited rather large cigar-shaped (prolate type) displacement ellipsoids
of Ueq = 5.4(4) × 10−2 and 6.7(8) × 10−2 Å2, stretched along the (x,x,x) direction. They are reminiscent to those
described in the ( H3O)1+pSb1+pTe1−pO6 series31. This is expected, considering their high multiplicity and their
relatively small occupancy, as well as by the fact that the hydronium units may rattle within the wide cavities gen-
erated by the S b2O62− framework, where a high diffusivity of the hydronium units across its channels is expected.
Finally, H2 atoms presented somewhat in-between isotropic displacements (Uiso = 3.626(1) × 10−2 Å2), suggesting
lower ionic mobility and lower atomic delocalization. The final structure achieved by Rietveld refinement of both
SXRD and NPD diffraction data for the AA is exhibited in detail in Fig. 1d–f. Besides, an animated representation
of the H3O+ units and H2 protons in their Sb2O62− framework cavity is displayed in Supplementary File 2, and its
caption in Supplementary File 1. A powder diffraction CIF file is also available as Supplementary Information.
At room temperature, convergence RB Bragg R-factors achieved values of 3.55% for SXRD and 2.47% for NPD,
suggesting that the calculated model fits reasonably well with the experimental data. To summarize, all these
agreement factors, together with the final atomic positions, anisotropic and isotropic equivalent displacement
factors, and the SOF of each species are recapitulated in Table 1.
Scientific Reports | (2021) 11:17763 | https://doi.org/10.1038/s41598-021-97147-0 2
Vol:.(1234567890)www.nature.com/scientificreports/
XRD Obs (b) SXRPD Obs (c) NPD Obs
(a)
λ = 1.5406 Å SXRPD Calc NPD Calc
111
Difference Obs-Calc Difference Obs-Calc
Bragg Positions Bragg Positions
SXRPD (a.u.)
SXRD = 0.44271 Å Background
XRD (a.u.)
NPD (a.u.)
311
NPD = 1.5947 Å
220
2 8 1,555
711,551
622
531
75
333,511
40
800
400
533
222
440
553,731
11
66
660,822
3,9
444
331 75
422 31
9 844
20 40 60 80 100 0 10 20 30 40 50 20 40 60 80 100 120 140
2θ (°)
(d) (e) (f)
Case C scenario
Sb5+ O O H1+ H1+
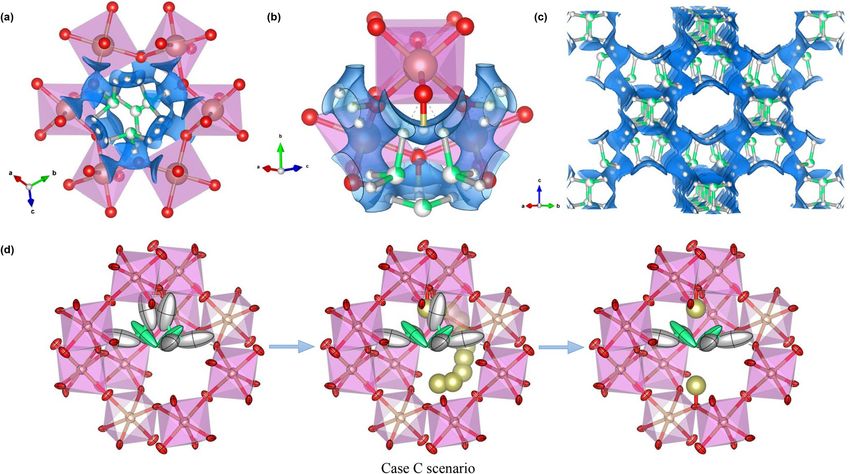
Figure 1. Diffraction patterns and structural representation of AA. (a) Laboratory XRD diagram of
( H3O)1.20(7)H0.77(9)Sb2O6 (λ = 1.5406 Å Cu Kα radiation) with peaks indexed in a face-centred cubic unit cell
with a = 10.36052(15) Å. (b,c) Plots from the combined Rietveld refinement from SXRD and NPD data.
Experimental (red crosses), calculated (solid black line), and difference (solid blue line at the bottom) (b) SXRD
(λSXRD = 0.44271 Å) and (c) NPD (λNPD = 1.5947 Å) patterns, with Bragg reflection positions marked by vertical
green bars. (d–f) Views of the AA pyrochlore final structure (‘Case C’ scenario described in the Supporting
Information). Atoms of the three panels are presented as anisotropic displacement ellipsoids at a 95% probability
level. Caption colour reference at the bottom of Figure is common to all figures. (d) Representation of a
snapshot of the crystal approximately along the [101] direction: the covalent framework made by the ( Sb5+O6)
corner-sharing octahedra consists of 16d (Sb, brown) and 48f (O1, red) fully occupied sites, with golden (H2)
protons linked to the skeleton O1 atoms at distances of 1.13(6) Å. Hydronium subunits are constituted by silver
(H1) protons bonded to green (O2) oxygens at 1.323(11) Å in a tetrahedral distribution (with 104.0(16)° angles).
These atoms present high mobility, with prolate anisotropic ellipsoids oriented along the (x,x,x) main threefold
diagonal. (e) Close up of the statistical distribution of a single cavity wherein the O2 and H1 are distributed at
32e and 96g Wyckoff positions, respectively, with SOFs close to 0.301(2), and H2 atoms at 48f sites exhibiting a
SOF of 0.129(15). Only 1.20(7) H3O+ groups and 0.77(9) H2 species are statistically present in each cavity. (f)
Snapshot of a single octahedra-sharing crown with a hydronium subunit and a H2 proton. In dotted lines: H1
atoms of the H3O+ subunit establish H bonds with the O1 atoms at about 1.400(10) Å.
The crystallographic formula obtained from the structural refinement is ( H3O)1.20(7)H0.77(9)Sb2O6, which pre-
sents electroneutrality within the standard deviation and is also endorsed by the low Rietveld reliability factors
and the reasonable equivalent isotropic displacement factors obtained for each mobile atom. It is interesting to
examine the ionic conduction path obtained from a bond-valence energy landscape (BVEL) study of the crys-
tal, illustrated in Fig. 2a–c. The conduction pathway, highlighted with a blue isosurface, involves both types of
H atoms and exhibits an isotropic distribution along the three axes. The percolation of the H atoms presents a
very low activation energy of 0.13 eV and a noticeably large volume fraction of the unit cell for ion mobility of
72.38% for the given parameters, providing the mechanism for the high ionic intracrystalline proton conduction
announced by several a uthors3,4,13,32. The average site-energy computed by bond-valence theory for both mobile
protons is − 2.95 eV, differing between both species in only 0.12 eV.
The H2 atom is bonded to the framework in a S b5+‒OH fashion, with hydroxyl interatomic distances H2‒
O1 of 1.13(6) Å. The O2 at 32e Wyckoff sites is coordinated by three H1 species at 96g positions in a tetrahe-
dral arrangement, with internal H1‒O2‒H1 angles of 104.0(16)°. The lone electron pair of the oxygen atoms
belonging to the hydronium groups are oriented in the 8a (1/8,1/8,1/8) direction. The H1 atoms are located about
1.400(10) Å away from the O1 oxygen of the covalent framework, with which a hydrogen bond is likely estab-
lished. Remarkably, the mean H1‒O2 interatomic distance within the hydronium unit is 1.323(11) Å, which
might seem rather large for a well-established (coordinated) covalent bond. The reason for this is that, statistically,
Scientific Reports | (2021) 11:17763 | https://doi.org/10.1038/s41598-021-97147-0 3
Vol.:(0123456789)www.nature.com/scientificreports/
Pyrochlore Antimonic acid
a (Å) 10.36073(9)
V (Å3) 1112.17(2)
Sb, 16d (1/2,1/2,1/2) Sb5+
u11 = u22 = u33a
0.01034(15)
u12 = u13 = u23a 0.0008(2)
Ueq (Å2) 0.01034(15)
SOF 1.0000
O1, 48f (x,1/8,1/8) O2−
x 0.43095(17)
u11a 0.0038(13)
u22 = u33a 0.0113(9)
u23a,b − 0.0059(9)
Ueq (Å2) 0.0088(10)
SOF 1.0000
O2, 32e (x,x,x) O2−
x 0.0652(7)
u11 = u22 = u33a 0.055(4)
u12 = u13 = u23a 0.043(4)
Ueq (Å2) 0.055(4)
SOF 0.301(17)
H1, 96g (x,x,z) H+
x 0.3321(8)
z 0.0602(17)
u11 = u22a 0.033(4)
u33a 0.139(16)
u12a 0.011(6)
u13 = u23a − 0.022(8)
Ueq (Å2) 0.068(8)
SOF 0.301(2)
H2, 48f (x,1/8,1/8) H+
x 0.323(4)
Ueq (Å2) 0.036261(10)
SOF 0.129(15)
Reliability factors SXRD NPD
Rp (%) 6.85 0.893
Rwp (%) 10.5 1.22
Rexp (%) 5.53 1.86
χ2 3.60 0.433
RBragg (%) 3.55 2.47
Table 1. Structural parameters for AA refined from combined SXRD and NPD data. Unit-cell (a), fractional
atomic coordinates (x, z), Debye–Waller anisotropic (uij) and equivalent isotropic (Ueq) displacement
factors, SOFs and Rietveld agreement factors (Rp, Rwp, Rexp, χ2, and R
Bragg) for (H3O)1.20(7)H0.77(9)Sb2O6, with
cubic space group Fd3m (# 227) and Z = 8, from dual SXRD and NPD data refinement collected at 298 K
(λSXRD = 0.44271 Å, λNPD = 1.5947 Å, Origin Choice # 2). a Anisotropic uij (×104). b u12 = u13 = 0.
there are 1.20(7) hydronium groups within the framework per formula unit, but in reality, only one or two subu-
nits may fit in each cavity, off-centre of the 8a (1/8,1/8,1/8) Wyckoff site and displaced along the (x,x,x) direction.
Therefore, about eight cavities hold one single hydronium ion, whereas two H3O+ subunits must be contained in
two of them. In the latter case, owing to the repulsive electrostatic forces between the two highly electronegative
O2 atoms fitting close to each other at a mean 1.752(10) Å distance, the H3O+ units accommodate even farther
from the 8a site. Due to this shift along the main diagonal, H1 atoms become closer to the O1 atoms of the cova-
lent framework, fostering a resonance in which the H1 protons may jump into the H2 48f position and establish
a hydrogen bond with their correspondent O2 at a mean distance of 1.679(17) Å. Recently, we have found a
similar shift along the main diagonal direction due to the increasing occupancy of H 3O+ groups on a related
family of Sb and Te pyrochlore-like acid oxides31. Certainly, it was confirmed that the shift of the O′ atoms along
this path, regarding the lower-multiplicity 8a (1/8,1/8,1/8) Wyckoff site, is frequent within the pyrochlore f amily33.
Scientific Reports | (2021) 11:17763 | https://doi.org/10.1038/s41598-021-97147-0 4
Vol:.(1234567890)www.nature.com/scientificreports/
Figure 2. Proton percolation pathway and mechanism in the AA (‘Case C’ scenario described in the
Supplementary Information). Atoms in all six panels are presented as anisotropic displacement ellipsoids at
a 95% probability level. The colour reference is the same one used in Fig. 1. (a,b) Close up of the AA final
structure; the ionic percolation path is highlighted in blue. The pathway involves both H + species in a 3D
interconnected arrangement, generating the 3D percolation isosurface defined for the AA. The ionic percolation
begins with a low percolation activation energy barrier of 0.13 eV. (c) Proton percolation pathway in a
simplified view of the AA unit cell approximately along the [110] direction. For the sake of clarity, the S b2O62−
octahedra-sharing covalent framework is hidden, and only the H 3O+ acid groups and the H2 species are visible.
Statistically, less than a third of the hydronium units here figured are present. (d) Proposed ionic migration
mechanism of two H1 atoms from 96g to 48f (H2) Wyckoff sites, for those cages wherein two H3O+ subunits
coexist. The repulsive electrostatic forces between the two O2 species would force their shift away from the
8a (1/8,1/8,1/8) along the (x,x,x) direction. One of the in-between protons is shared between the two O2 atoms and
the O1 framework oxygen, while the other is relocated at the antipodal position of the cavity by following the
percolation path highlighted in panels (a–c), achieving an electrostatic stability.
Therefore, when two hydronium groups get close to each other, the central protons become prone to delo-
calization. Here, it is very likely that one of these in-between protons starts resonating and becomes a shared
ion between the two O2 and the O1 oxygens. Such a scheme would entail the bonding of four protons to two
O2, the share of a fifth H + between these and one O1 oxygen, and the sixth remaining H + species leaving the
H3O+ groups behind by following the ionic conduction path and bonding to the opposite O1 at a mean O2–H2
distance of 2.811(12) Å. As there are statistically less than 0.8 H2 atoms per cavity, there is room for the proposed
mechanism as some of the cages will not present an OH hydroxyl group at all. A schematic representation of
this effect is shown in Fig. 2d.
The determined Sb–O1–Sb angle and Sb–O1 distances within the S b2O62− covalent network are 137.33(3)°
and 1.9663(12) Å, respectively, which are larger than those of 136.39(2)° and 1.9624(5) Å recently reported for
an AA derivative, viz. Sb6O13, obtained by thermal decomposition of the former19. The unit-cell parameter is
also longer for AA, about 0.53% more than that of Sb6O13 (10.36052(15) vs 10.30653(11) Å). A wider and bigger
cavity for the hydrated sample is consistent with the presence of 1.20(7) voluminous H3O+ groups per cage, in
contrast with the 0.5 Sb3+2–O′ groups found in the calcined sample. The main interatomic distances and angles
obtained are summarized in Table 2.
The obtained Rietveld profiles are exhibited in Fig. 1b,c and in more detail in Supplementary Fig. S1. The
domain size assessment, determined by Scherrer’s34,35 equation from SXRD data, yields a crystallite of 42.00(8) nm
average apparent size. Instrumental broadening was deconvoluted for Scherrer’s apparent domain size determi-
nation, see “Methods” for more details.
Water and proton content assessment. The occupancies of O2, H1, and H2 species used on the com-
bined Rietveld refinement were determined by means of MAS NMR applied to dry AA. This is a powerful tech-
nique to identify the different 1H species that may be found within the crystal structure. Prior to this analysis,
the sample was dried at 105–107 °C to eliminate all contributions to the final spectrum that could come from
adsorbed water. The resulting deconvolution, shown in Fig. 3a, is mainly made up of two components with dif-
Scientific Reports | (2021) 11:17763 | https://doi.org/10.1038/s41598-021-97147-0 5
Vol.:(0123456789)www.nature.com/scientificreports/
Bond (occurrence) Distance (Å) Atoms set Angle (°)
(Sb2O62−) covalent framework
Sb–O1 (× 6) 1.9663(12) Sb–O1–Sb 137.33(3)
O1–H2 (× 1) 1.12(4) O1–Sb–O1 180.00(6)
O1–Sb–O1 87.39(4)
O1–Sb–O1 92.61(8)
Sb–O1–H2 111.3(14)
(H3O+) unit
O2–H1 (× 3) 1.323(11) H1–O2–H1 104.0(16)
Non-bonding pairs (occurrence) Distance (Å) Atoms set Angle (°)
Non-bonding atoms
Sb–Sb (× 6) 3.66307(2) Sb–O1–O2 98.3(3)
Sb–O1 (× 6) 3.7791(6) Sb–O1–O2 110.1(3)
Sb–O2 (× 12) 3.845(7) Sb–O1–H1 109.0(7)
Sb–H2 (× 6) 2.59(3) O1–O1–H2 135(3)
Sb–H1 (× 12) 2.760(10) O1–O2–H2 108.7(6)
O1–H1 (× 2) 1.400(10) O1–H2–O2 149(3)
O1–H1 (× 4) 2.471(9) O1–H2–O2 92(2)
O1–H1 (× 4) 3.111(9) O1–H2–H1 129(2)
O1–O2 (× 2) 2.697(7) O1–H2–H1 88(2)
O1–O2 (× 2) 3.034(7) O1–H1–O2 164.1(9)
O2–O2 (× 3) 1.752(10) H1–O1–H2 66(2)
O2–O2 (× 1) 2.340(10) H1–O2–H2 93.5(9)
O2–H2 (× 2) 1.679(17) H1–O2–H2 115.3(15)
O2–H2 (× 2) 2.788(7) H2–H1–O2 99.3(9)
O2–H2 (× 2) 2.811(12) H2–H2–H2 65.0(15)
H2–H2 (× 4) 2.90(4) H2–H2–H2 57.5(3)
H2–H2 (× 1) 4.10(6) O1–O1–O1 107.56(6)
H2–H1 (× 4) 2.250(10) O1–O1–O1 111.181(16)
H2–H1 (× 2) 3.33(2)
H2–H1 (× 4) 3.18(3)
H2–H1 (× 2) 4.02(4)
H1–H1 (× 2) 2.085(19)
H1–H1 (× 2) 2.92(2)
Table 2. Selected interatomic distance and angles refined from combined SXRD and NPD data. Main
interatomic distances and angles for (H3O)1.20(7)H0.77(9)Sb2O6, with cubic space group Fd3m (# 227) and Z = 8,
from dual SXRD and NPD data refinement collected at 298 K (λSXRD = 0.44271 Å, λNPD = 1.5947 Å, Origin
Choice # 2). S b2O62− covalent framework, H3O+ subunit, and non-bonding atoms categories are classified. In
the latter, only meaningful distances and angles from atomic pairs and triplets of near non-bonding elements
are summarized.
ferent widths and intensities, corresponding to the two proton types observed by Rietveld refinement from NPD
data. Additionally, a small component has been introduced to the deconvolution at a chemical shift of 1 ppm,
corresponding to a parasitic signal from the organic rotor cap. The chemical shift values of the main two contri-
butions are rather similar to each other (8.70 for H1 and 8.46 ppm for H2) and, in both cases, higher than those
of the water molecule (5 ppm), indicating a somewhat stronger acidity of the protons. The dependence of the
chemical shift or anisotropy with the orientation regarding the external magnetic field B0 is not pronounced, and
the calculated isotropic chemical shift (tabulated in Table 3) coincides with the position of the main components.
At the same time, proton contributions (H1 and H2) present similar small chemical shift anisotropy (usually
termed CSA) patterns, which are slightly broadened by anisotropic interactions, meaning that the structural
environment is slightly distorted in both cases. Signal contribution widths, on the other hand, are noticeably
different; in NMR, a higher width may indicate less mobility due to greater interaction with the surface and a
higher heterogeneity of structural positions. From the two main deconvoluted signals, the wider and less signifi-
cant one (6.5 ppm wide, 17.49%) is assigned to the more restrained, short-bonded H2 protons, while the narrow
and stronger signal (2.5 ppm, 81.30%) corresponds to the H1 protons constituting the high-mobility hydronium
groups. The relationship between the two areas is 4.648, in close agreement with the H1/H2 Rietveld SOFs ratio
of 4.674. Principal elements deduced from sideband patterns are given in Table 3, where isotropic chemical shift,
anisotropy, and asymmetry parameters corresponding to each site are also included. A brief explanation of the
tabulated elements is presented in “Methods”.
Scientific Reports | (2021) 11:17763 | https://doi.org/10.1038/s41598-021-97147-0 6
Vol:.(1234567890)www.nature.com/scientificreports/
(a) (b) 5
100 A 25.21°C
8.7 ppm 100.0%
1 169.96°C
H MAS NMR 96.07%
0
95 B 600
Temperature (°C)
Heat Flow (mW)
-5
Weight (%)
90 400.01°C 400
C -10
D
76.73°C 348.74°C E
88.21% 567.31°C 200
85 436.73°C
-15
ssb ssb 86.36% 505.70°C F
85.59%
274.76°C 659.28°C
82.77%
80 -20
100 200 300 400 500 600 700
40 30 20 10 0 -10 -20 Exo Up Temperature (°C)
ppm
(c) (d)
Figure 3. (a) 1H MAS NMR deconvoluted spectrum, where three contributions can be identified: two
corresponding to the H1 and H2 atoms at 8.70 ppm and 8.46 ppm, respectively, and a third, parasitic signal at
1 ppm coming from the rotor cap. The first two present higher chemical shifts than water molecules (5 ppm),
accounting for the acidity of the protons of the sample. (b) TGA/DSC curves of the thermal analysis of the AA.
Labels correspond to the stoichiometric formulae (A) (H3O)1.20H0.77Sb2O6·0.703 H2O or Sb2O5·2.89 H2O, (B)
(H3O)1.20H0.77Sb2O6 or Sb2O5·2.19 H2O, (C) H1.1Sb2O5.55 or Sb2O5·0.55 H2O, (D) H
0.32Sb2O5.16 or Sb2O5·0.16 H2O,
(E) Sb2O5, and (F) Sb6O13. These structures were inferred from the total weight loss of the AA sample, and
later confirmed by carefully matching up these curves with the TGA and DTA curves of the Kovalenko et al.
thermolysis analysis reported for a hydrated antimony pentoxide s ample38. (c,d) low magnification SEM images
of the AA sample obtained by soft-chemistry oxidative hydrolysis reaction.
Position
Signal Signal source Line model Amplitude (ppm) Width (ppm) Integral (%) xG/(1 − x)L dCS (ppm) η
#1 H1 CSA MAS 12.62 8.70 2.65 81.30 0.00 10.00 0.50
#2 H2 CSA MAS 1.35 8.46 2.8 (1) 17.49 0.70 15.00 0.50
#3 Rotor cap Gaus/Lor 0.30 1.00 6.0 (1) 1.21 0.00 – –
Table 3. 1H MAS NMR chemical shift anisotropy data from spectra recorded at 10 kHz. In spectra analysis,
position, linewidth, and integrated area of central components were deduced with non-linear iterative
techniques. The analysis of spinning sideband patterns enables a determination of the isotropic chemical shift
(δiso), and the axiality (dCS) and asymmetry parameter (η) of the chemical shift anisotropy tensor.
In the AA series, moisture is frequently present, and the total water amount they contain seems to vary from
zero to six H2O molecules per formula unit1,5,17,28, some of which are expected to be adsorbed on the solid surface
linked by H bonds to the outmost framework oxygen atoms and exposed acid groups. In order to assess this mois-
ture content and to confirm the crystalline water determined by MAS NMR, a TGA/DSC analysis was performed
on both, a dry, and a long-term air-stored sample. The weight and heat flow curves are summarized in Fig. 3b.
The dry sample was used to determine the quantity of hydronium and H2 species, obtaining values in close
agreement with those derived from NMR and in agreement with the proposed structural model. It comes to no
Scientific Reports | (2021) 11:17763 | https://doi.org/10.1038/s41598-021-97147-0 7
Vol.:(0123456789)www.nature.com/scientificreports/
(a) (b) (c)
(d) (e) (f)
Figure 4. Structural short-range order studies. Room condition Sb K-edge XANES spectra of AA as compared
with reference samples of Sb foil, S b2O3, and FeSbO4 (a). The k3-weighted EXAFS signals (b) and their
corresponding moduli of the Fourier transform (c). The fitting was performed using the scattering paths in
Table 4: the EXAFS oscillations k3χ(k) (d), moduli of the Fourier transform |χ(R)| (e), and its real part Re[χ(R)]
(f) in R space. The open symbol stands for the experimental point, the solid blue line is the best fit, and the green
line the residue.
surprise that AA presents some major water affinity, as a small amount of moisture was adsorbed on the dry sam-
ple during the TGA/DSC experiment setup, and later degassed in the heating process up to 150 °C. Seamlessly,
this extraordinary water affinity was recently identified and reported by our group for a potassium pyrochlore-
like niobate and tungstate33, probably bound to many series of pyrochlore-like materials as a common behaviour
pattern. For the assessment of H content in the dry sample, this last moisture-related contribution was deducted.
The final stoichiometric formula achieved with TGA/DSC for dry AA is ( H3O)1.24H0.76Sb2O6, in agreement within
the standard deviations with that obtained from the structural refinement. Moreover, the dehydrated sample
corresponds to a stoichiometric formula close to S b2O5·2.19 H2O, which is fairly similar to the one reported by
Ozawa et al. (Sb2O5·2 H2O)3, pioneers in the soft-chemistry procedure utilized here to synthesize the AA phase.
By combining the refined crystallographic formula with the TGA results, 0.703 moisture water molecules were
determined for the moisturized and long-term stored AA sample, which can be described as Sb2O5·2.88 H2O.
Moisture water molecules are presumed to be physisorbed on the surface of the AA crystals through hydrogen
bond linkages1,3,36. The thermal decomposition steps that AA experiences upon warming up have been widely
studied along the y ears6,7,37. Perhaps the most significant contribution in this regard is the one made by Kovalenko
et al. in 2018 by studying the thermal decomposition of hydrated antimony pentoxide, obtained by oxidation of
antimony(III) chloride in nitric acid and later hydrolysis in water. Authors’ assessment was performed by ther-
mal analysis in combination with mass spectrometry analysis of released gases, and reliable intermediate steps
were presented. Our TGA/DSC study is in close agreement with the reported decomposition steps, and similar
intermediate formulas were labelled for each meaningful step in its corresponding figure.
Scanning electron microscope. SEM images shed light on the microscopic uniformity of the of AA. This
landscape is compatible with the soft-chemistry procedure here used to synthesize the solid. Figure 3c,d shows
two pictures of the long-term stored sample, displaying particles of a size smaller than a micron. This is in line
with the colloidal nature of the sample, and the impossibility of collecting it from the slurry by a simple filtration
process.
Structural short‑range order studies. XAS is a powerful tool to probe both chemical features of the
constituting elements, such as valence and coordination environment around the target atoms, and local struc-
tural information, which includes average nearest-neighbour distances and coordination number39. XANES
(X-ray absorption near-edge structure) part of the XAS spectra provides information on the valence state as the
edge position, such that the binding energy of the bound electrons increases with the v alence40. Figure 4a com-
pares the XANES at Sb K-edge (30.491 keV) of AA with the reference samples, including the Sb foil ( Sb0), Sb2O3
(Sb3+) and FeSbO4 (Sb5+). One may see the blue shift of the edge position when the valence state increases from
0 up to 5+, as indicated by the black arrow. The shift ΔE of the edge energy, from the Sb0, is 1.7 eV for valence
Sb3+, while for valence Sb5+ of AA is 5.6 eV. Such a result agrees with the edge shift observed for FeSbO4 oxide,
which also contains S b5+. It is also worth noting that the XANES features of AA increase as compared to that one
of Sb2O3, meaning that the coordination number of the first shell Sb–O has also risen.
Scientific Reports | (2021) 11:17763 | https://doi.org/10.1038/s41598-021-97147-0 8
Vol:.(1234567890)www.nature.com/scientificreports/
Sample Shell RŴ, Å NŴ 10−3 × σŴ2, Å2
Antimonic acid Sb–O 1.955(1) 6.5(1) 3.4(6)
Edge position, eV Sb–Sb 3.612(1) 2.8(1) 2.7(8)
30,495.6 Sb–O 3.898(1) 6.0(1) 12(1)
Nidp Nvar R-factor Δk-range, Å−1 ΔR-range, Å
26 8 0.0115 2–14.5 0.9–4.2
Table 4. Structural parameters extracted from EXAFS data. RŴ is the distance from absorber atom, NŴ is the
average coordination number, σŴ2 the Debye–Waller factor, and R-factor stands for the quality factor of the
fitting. Maximum number of independent variables as imposed by the uncertainty principle: Nidp ≈ 2ΔkΔR/π.
Nvar, number of variables used during the fitting procedure.
Quantitative information on the local structure was obtained using the extended part of the XAS spectra,
the so-called EXAFS (extended X-ray absorption fine structure). Indeed, EXAFS spectra were recorded up to
k = 16 Å−1, as represented in Fig. 4b. Here, the EXAFS oscillations k3χ(k) of Sb foil, S b2O3, FeSbO4, and AA are
compared, showing similarities among the oxides. This can be better seen by plotting the moduli of the Fourier
transform in R space in Fig. 4c: two main peaks at 1.52 and 3.35 Å (not corrected by photoelectron phase-shift).
In order to evaluate the pair-bond distances and the coordination numbers, the standard EXAFS equation was
used, which stands for39:
NŴ S02 2 2 2R
− Ŵ
χ(k, Ŵ) = 2
· FŴ (k, RŴ ) · sin[2kRŴ + ϕŴ (k)] · e−2σŴ k · e (k) (1)
2kRŴ
such that RŴ, NŴ, and σŴ are the structural parameters to be determined for each photoelectron path: distance
from absorber atom to its neighboring ones, coordination number of the shell, and Debye–Waller (DW) factor
(it measures the mean square relative displacement), respectively. S0 stands for the amplitude reduction factor
from a previous calibration using a metallic antimony (S0 is equal to 0.7802 for all the samples). FŴ (k, RŴ ), (k),
and ϕŴ (k) denote the backscattered amplitude, photoelectron mean free path, and phase shift, correspondingly,
which are determined by the FEFF-8 code41.
The EXAFS signal at room temperature of AA was fitted using three neighbouring shells: one short Sb–O, one
Sb–Sb, and a long Sb–O one. All the adjusted parameters of interest in Eq. (1) are listed in Table 4. Figure 4d–f
shows the quality of fitting by exhibiting the EXAFS oscillations, moduli of the Fourier transform and its real
part in R space, respectively. The first peak in |χ(R)| at 1.52 Å (not phase-shift corrected) denotes the S b5+–O
bond with RSb−O = 1.955(1) Å and coordination number NSb−O around 6.5(1). Such a shell fully agrees with the
pair bond Sb−O1 (× 6) with a distance of 1.9663(12) Å, as obtained from NPD. The second feature in |χ(R)|
at 3.35 Å has two components: a metallic-metallic pair with RSb−Sb = 3.612(1) Å and a metallic-anion one with
RSb−O = 3.898(1) Å. The Sb–Sb pair possesses a coordination environment close to 3, which may be associated
with the non-bonding pair Sb–Sb (× 6) with a metal–metal distance of 3.66307(2) Å in Table 2. The second non-
bonding pair Sb–O has RSb−O = 3.898(1) Å and coordination number NSb−O around 6.0(1), being similar to that
obtained for Sb–O2 (× 12) with a distance of 3.845(7) Å. Details on the EXAFS analyses in S b2O3 and FeSbO4
samples can be found e lsewhere19.
Differently from NPD, here it is not possible to identify pair containing this hydrogen by EXAFS, since the
atomic number of Hydrogen is 1; therefore, the shortest and longest distances are missing in this study. The
DW factors of the shells Sb–O (1.955(1) Å) and Sb–Sb (3.612(1) Å) were derived as 3.4(6) and 2.7(8) × 10−3 Å2,
respectively. These values agree well with those reported for cubic Sb2O5, meaning that AA and the last oxide have
a very similar short-range structure42, i.e. with a similar covalent framework composed by Sb5+–O pair bonds.
Conclusions
A compelling study of the so-called ‘antimonic acid’ structure by robust local- and long-range techniques,
together with a BVEL analysis, shed light on the stoichiometry and atomic distribution in the crystal structure,
and provide a plausible ionic diffusion mechanism for its well-established high proton conductivity. The struc-
ture can be defined as a defect pyrochlore, belonging to the Fd3m space group. Aided by a combined Rietveld
refinement from SXRD and NPD data, and by TGA/DSC and MAS NMR studies, we were capable of identify-
ing two main types of protons in this material, one at 96g Wyckoff sites that belongs to the highly delocalized
hydronium subunits and presents lengthened prolate displacement ellipsoids, and another one at 48f positions,
directly bonded at 1.12(4) Å to the oxygen atoms constituting the B2O6−2 covalent framework within which the
hydronium groups percolate. The refined crystallographic formula is ( H3O)1.20(7)H0.77(9)Sb2O6, with 0.703 water
molecules from physisorbed moisture per formula unit. We found neither additional H species nor the presence
of Sb3+ remaining from the oxide precursor or generated by reduction of Sb5+ at A sites. Although no additional
crystallization water was found, a plausible mechanism where two H3O+ groups within the same cavity are prone
to become two H 2O molecules and two H2 protons is proposed, endorsed by the repulsion among hydronium
units sharing the same cavity, and by the 48f site availability. Good Rietveld refinement reliability factors were
achieved, and the XAS, the MAS NMR, and TGA/DSC results are all consistent with the proposed model. In
particular, XANES endorsed the pentavalent state of antimony ion in AA, while EXAFS probed the covalent
framework composed by Sb5+ and O1 atoms.
Scientific Reports | (2021) 11:17763 | https://doi.org/10.1038/s41598-021-97147-0 9
Vol.:(0123456789)www.nature.com/scientificreports/
Methods
Sample preparation. All the commercially available ReagentPlus or Analytical-grade reagents were pur-
chased at Sigma Aldrich and Fisher Scientific.
Antimonic acid was obtained by an oxidative hydrolysis soft-chemistry reaction. It begins from S b2O3 and
a 31% H rocedures3,43. The mixture was stirred at 343 K for 24 h,
2O2 solution, following previously described p
while the hereunder reaction occurs:
Sb2 O3 + 2 H2 O2 + p − 1 H 2 O → (H3 O)p H2−p Sb2 O6 . (2)
The white colloidal slurry is centrifuged at 15,000 rpm for 10 min until nearly complete sedimentation. The
product, a glassy-white solid, is then dried in air at 105–107 °C for 48 h and finally ground.
The (H3O)pH2−pSb2O6 sample was firstly investigated utilizing X-ray powder diffraction (XRD). Labora-
tory XRD data were collected with a conventional diffractometer (40 kV, 30 mA) in Bragg–Brentano reflection
geometry with Cu Kα radiation (λmean = 1.5418 Å). The SXRD pattern was collected at the CELLS‒ALBA facility,
Barcelona (Spain), in the MSPD high-angular resolution diffractometer under an incident beam with an energy
of 28 keV and a wavelength of λ = 0.44271 Å. For determining the instrumental broadening, the sample was
characterized together with a powdered N a2Ca3Al2F14 fluoride (NAC) standard. The high-angular resolution
mode (MAD set-up) was used on the MSPD-diffractometer44. The polycrystalline powder was contained in a
spinning glass capillary of 0.7 mm diameter. For the NPD experiments, the D2B high-resolution two-axis dif-
fractometer was used, installed at the Institut Laue-Langevin, in Grenoble (France). The sample (about 2–3 g) was
contained in a vanadium can. The full diffraction patterns were collected in a 2 h-long analysis time. A wavelength
of 1.5947 Å was selected from a Ge monochromator; the measurement temperature was 298 K.
Structural refinement from synchrotron X‑ray and neutron diffraction data. FULLPROF45 soft-
ware (see “Methods”) was used for performing the combined Rietveld refinement46 from SXRD and NPD data.
A relative pattern weight of 0.10/0.90 favouring NPD data was considered, as it presents an absence of form fac-
tor and exceptional sensitivity for both hydrogen and oxygen atoms, essential for determining their positions,
occupancies and atomic displacement factors (ADPs). Moreover, H+ atoms are invisible to X-rays and the atomic
weight ratio between Sb and O is large enough for the SXRD to differentiate them even at low pattern weighting.
The best ADPs and lowest Rietveld reliability factors were obtained for the announced relationship.
The Thompson–Cox–Hastings47 pseudo-Voigt convoluted with axial divergence asymmetry over SXRD data
were used to determine the crystallite size. A calculated μR = 0.92 absorption correction coefficient determined
by adopting a 0.5 packed factor was included in the refinement for compensating transmission and absorption
of the X-rays through the irradiated cylindrical volume of the sample. An apparent isotropic crystallite size of
42.00(8) nm and average maximum generalized strain of ε = 6.666(7) × 10–4 were obtained through microstrain-
and domain size-determining FULLPROF modules. For the NPD data treatment, a pseudo-Voigt48 function with
the asymmetry correction published by Berar and Baldinozzi49 were respectively employed for the simulation of
the peak shape and the asymmetry assessment.
Both SXRD and NPD backgrounds were linearly interpolated between 68 and 44 individual refined points.
The coherent neutron scattering lengths used in the Rietveld refinement are internally tabulated in the program
FULLPROF, rated in 5.570, 5.803, and − 3.739 fm for Sb, O, and H atoms, respectively.
BVEL was carried out with BondStr50 software (see “Methods”), a module embedded in the FULLPROF
toolbar. For ensuring a percolation energy convergence of a few hundredths of electron volt, BVEL analysis
considering H+ as the mobile ion was computed by applying a grid resolution of 0.1 Å and a percolation radius
of 8 Å, suiting with the optimal parameters described by Katcho et al. in their high-throughput BVEL calcula-
tion of Li and Na ionic c onductors50. As both mobile ion share almost the same minimum site-energy (− 2.93
and − 3.05 eV for H1 and H2, respectively), and that they fit in the same conduction path, we tacitly assume
that the migration energy Em is equivalent to the threshold energy Eth here determined, defined as the energy
at which the proton pathway starts percolating across the unit cell50. Hence, undertaking a multiple-technique
approach, we disclose a detailed and comprehensible structural description of the AA, which is compatible with
its main chemical properties.
Magic‑angle spinning nuclear magnetic resonance spectroscopy. The chemical shift anisotropy is
the interaction between the external magnetic field B0 and the electron density surrounding the nucleus, owing
to the magnetic moment coming from its rather ellipsoidal shape. The weak secondary magnetic fields that are
generated are added or subtracted to B0, modifying the magnetic field around the nucleus, and therefore its
resonance frequency in a so-called ‘shielding’ process that results in a chemical shift. The three main values of
the shielding associated tensor are frequently expressed as a function of the isotropic chemical shift (δiso), and
the axiality (dCS) and asymmetry parameter (η) of the chemical shift anisotropy tensor. For nucleus in an axial
symmetry site, it is true that δxx = δyy ≠ δzz and η = 0. The shape of the powder sample line is very different,
depending on the symmetry of both the shielding tensor and the site where the nucleus is located. The MAS
experiment (‘magic angle spinning’ or rotation of the sample around the magic angle) can average the chemical
shift anisotropy. Even slow spinning provides very narrow lines, although there may be a substantial number
of spinning sidebands. It is interesting to note that the orientation-dependent information of the interaction
remains, embedded in the amplitudes of the spinning sidebands. Indeed, a simulation can extract the principal
values of the chemical shift anisotropy from slow speed MAS spectra.
1
H MAS NMR spectrum was recorded on a Bruker AVANCE 400 spectrometer. Single pulse sequences were
used to irradiate the sample at the 1H resonance frequency in a 9.4 T (400 MHz) magnetic field. The sample was
Scientific Reports | (2021) 11:17763 | https://doi.org/10.1038/s41598-021-97147-0 10
Vol:.(1234567890)www.nature.com/scientificreports/
placed on zirconia rotors that rotate inside the probe at an angular frequency of 10 kHz around the magic angle
(54° 44′ with respect to the external magnetic field). NMR spectrum was obtained after excitation of the sample
with a π/2 pulse duration of 4.7 µs and an interval between successive accumulations of 5 s. The total number
of accumulations was 72. To determine the values of the chemical shift, tetramethylsilane was used as internal
standard. By adding the components as a combined Lorentzian–Gaussian form, a calculated envelope that
reproduces the spectrum is obtained, from which the intensity, position (chemical shift) and width parameters
of central components were deduced with non-linear iterative techniques (DMFIT s oftware51, see “Methods”).
The analysis of spinning sideband patterns enables a determination of chemical shift, dCS and η parameters.
X‑ray absorption spectroscopy at the CLÆSS beamline of the ALBA synchrotron. The X-ray
absorption process was performed by measuring the photon flux through three ionization chambers. This well-
established technique used in transmission mode provided an exact measurement of the X-ray absorption coeffi-
cient. The resulting absorption spectra were then characterized by one or more jumps (absorption edges), whose
energy positions are element specific since they coincide with the energy of the corresponding atomic core level.
The X-ray transitions are controlled by the dipolar selection rules relating to well-defined atomic symmetry of
the involved core hole and the final state angular momenta. XANES spectra show a remarkable site-specific
behaviour, because they are sensibly affected by the strong spatial localization of the initial core–shell state.
Short-range atomic studies were performed by means of XAS at the BL22-CLÆSS beamline of the Spanish
synchrotron, CELLS-ALBA, Barcelona, with electron energy and current in the ring of 3 GeV and 200 mA,
respectively. Data acquisition was performed with a double crystal monochromator with two Si(311) crystal
pairs and three ionization chambers for determining the photon flux before/after the sample and before/after the
metal foil employed for energy calibration. In this way, the X-ray absorption coefficient may be exactly measured.
Details on the beamline setup can be found e lsewhere52. Concerning the sample preparation for XAS measure-
ments, the samples were ground in an agate mortar with an inert matrix (boron-nitride, BN), pelletized into disks
to optimize the absorption jump of the XANES spectrum, and then protected with Kapton tape. The reference
samples such as Sb foil (> 95%) and S b2O3 (99.7%) were purchased from Aldrich and Alfa Aesar, respectively.
FeSbO4 was synthesized using solid-state reaction method, as detailed e lsewhere19.
Complementary techniques. The TGA/DSC characterization was performed in a Mettler TA3000 sys-
tem equipped with a DSC Q-100 unit. The measurements were performed in heating runs from room tempera-
ture to 700 °C with a rate of 10 K min−1 for powder samples encapsulated in standard alumina crucibles. About
49 and 56 mg of sample were used for the dry-basis and long-term stored AA experiments, correspondingly. The
thermal decomposition reaction of the AA is determined as follows:
�
(3)
3(H3 O)p H2−p Sb2 O6 · nH2 O −→ Sb6 O13 + O2 + 3 + 3p + n H2 O.
SEM experiments were conducted with a Hitachi TM1000 (Hitachi High‑Technologies Corporation, Minato,
Tokyo, Japan) desktop instrument with an acceleration voltage of 1.5 kV and a 90 s acquisition time.
Details on data processing. FULLPROF45 toolbar software (Version 5th May 2020, Institut Laue-Lan-
gevin Grenoble, France, https://www.ill.eu/sites/fullprof/) includes the embedded modules WinPLOTR-2006
(Version 0.50 of June 2013, Institut Laue-Langevin Grenoble, France), BondSTR (Version July 2010, Institut
Laue-Langevin Grenoble, France) and GFOURIER (Graphic Fourier Program, Version 04.06 of 2007, Univ. La
Laguna, Tenerife, Spain), that were used for the Rietveld Refinement, the Fourier difference density maps calcu-
lation, and the BVEL analysis, respectively. Data processing was performed with OriginPro (Version 8 SR0 and
2018 SR1, OriginLab, Northampton, MA, USA, https://www.originlab.com). Crystal structure projections were
generated using VESTA53 (Visualization for Electronic and STructural Analysis, Version 3.5.5 of 26th Septem-
ber 2020, 64-bit Edition, https://jp-minerals.org/vesta/en/) graphing tools. ATHENA and ARTEMIS from the
Demeter suite41 (Version 0.9.26, 64-bit Edition, https://bruceravel.github.io/demeter/) were employed to process
the XAFS data. MAS NMR spectra were treated with the DMFIT software51 (Version 2020.03.06, https://nmr.
cemhti.cnrs-orleans.fr/dmfit/).
Data availability
The datasets generated during and analysed during the current study are available from the corresponding author
on reasonable request.
Received: 4 June 2021; Accepted: 17 August 2021
References
1. Abe, M. & Ito, T. Synthetic inorganic ion-exchange materials. XII. Some observation on surface structure and cation-exchange
behaviour of three different antimonic acids. Bull. Chem. Soc. Jpn. 41, 2366–2371 (1968).
2. England, W. A. & Slade, R. C. T. NMR Study of proton transport in crystalline antimonic acid. Solid State Commun. 33, 997–999
(1980).
3. Ozawa, Y., Miura, N., Yamazoe, N. & Seiyama, T. Proton conduction in thermally treated antimonic acid samples. Chem. Lett.
https://doi.org/10.1246/cl.1982.1741 (1982).
4. Amarilla, J. M. et al. Antimonic acid and sulfonated polystyrene proton-conducting polymeric composites. Solid State Ion. 127,
133–139 (2000).
Scientific Reports | (2021) 11:17763 | https://doi.org/10.1038/s41598-021-97147-0 11
Vol.:(0123456789)www.nature.com/scientificreports/
5. Baetsle, L. H. & Huys, D. Structure and ion-exchange characteristics of polyantimonic acid. J. Inorg. Nucl. Chem. 30, 639–649
(1968).
6. Veselý, V. & Pekárek, V. Synthetic inorganic ion-exchangers-I. Hydrous oxides and acidic salts of multivalent metals. Talanta 19,
219–262 (1972).
7. Belinskaya, F. A. & Militsina, E. A. Inorganic ion-exchange materials based on insoluble antimony(V) compounds. Russ. Chem.
Rev. 49, 933–952 (1980).
8. Abe, M., Tsuji, M. & Kimura, M. Synthetic inorganic ion-exchange materials. XXXI. Ion-exchange behavior of tervalent metals
and rare earth elements on crystalline antimonic(V) acid cation exchanger. Bull. Chem. Soc. Jpn. 54, 130–134 (1981).
9. Dyer, A. Ion exchange. In Reference Module in Chemistry, Molecular Sciences and Chemical Engineering (Elsevier, 2013). https://
doi.org/10.1016/B978-0-12-409547-2.04402-4..
10. Wang, B. et al. Mn-substituted tunnel-type polyantimonic acid confined in a multidimensional integrated architecture enabling
superfast-charging lithium-ion battery anodes. Adv. Sci. 8, 2002866 (2021).
11. Li, G., Yang, N., Yang, X., Wang, W. & Zhang, W. F. Reagent dependency of the extent of organic compound degradation ability
under visible light irradiation. J. Phys. Chem. C 115, 13734–13738 (2011).
12. Chen, J. et al. Antimony oxide hydrate (Sb2O5·3H2O) as a simple and high efficient photocatalyst for oxidation of benzene. Appl.
Catal. B Environ. 210, 379–385 (2017).
13. England, W., Cross, M., Hamnett, A., Wiseman, P. & Goodenough, J. Fast proton conduction in inorganic ion-exchange compounds.
Solid State Ion. 1, 231–249 (1980).
14. Slade, R. Ac and dc conductivity of crystalline pyrochlore antimonic acid, Sb2O5·nH2O. Solid State Ion. 35, 29–33 (1989).
15. Möller, T. et al. Titanium antimonates in various Ti∶Sb ratios: Ion exchange properties for radionuclide ions. J. Mater. Chem. 13,
535–541 (2003).
16. Sivaiah, M. V., Venkatesan, K. A., Krishna, R. M., Sasidhar, P. & Murthy, G. S. Ion exchange properties of strontium on in situ
precipitated polyantimonic acid in amberlite XAD-7. Sep. Purif. Technol. 44, 1–9 (2005).
17. Mellor, J. W. A Comprehensive Treatise on Inorganic and Theoretical Chemistry Vol. IX (Green and Co., 1929).
18. Shi, J. et al. A novel Sn2Sb 2O7 nanophotocatalyst for visible-light-driven H2 evolution. Nano Res. 5, 576–583 (2012).
19. Mayer, S. F. et al. A comprehensive examination of the local- and long-range structure of Sb6O13 pyrochlore oxide. Sci. Rep. 10,
16956 (2020).
20. Berzelius, J. J. II. Die Oxyde des Antimons. Schweigger’s J. Chem. Phys. 6, 144 (1812).
21. Rose, H. III. Ueber die verbindungen des Antimons mit Chlor und Schwefel. Poggendorff ’s Ann. Phys. Chem. 3, 441 (1824).
22. Heffter, L. On the salts of antimonic acid. The London, Edinburgh Dublin Philos. Mag. J. Sci. 4, 398–399 (1852).
23. Pauling, L. The formulas of antimonic acid and the antimonates. J. Am. Chem. Soc. 55, 1895–1900 (1933).
24. Siebert, H. Ultrarotspektren von Tellursäuren, Telluraten und Antimonaten. ZAAC J. Inorg. Gen. Chem. 301, 161–170 (1959).
25. Baes, C. F. & Mesmer, R. E. The Hydrolysis of Cations (Wiley, 1976).
26. Filella, M., Belzile, N. & Chen, Y. W. Antimony in the environment: A review focused on natural waters II. Relevant solution
chemistry. Earth Sci. Rev. 59, 265–285 (2002).
27. Accornero, M., Marini, L. & Lelli, M. The dissociation constant of antimonic acid at 10–40 °C. J. Solut. Chem. 37, 785–800 (2008).
28. Abe, M. & Ito, T. Synthetic inorganic ion-exchange materials. X. Preparation and properties of so-called antimonic (V) acid. Bull.
Chem. Soc. Jpn. 41, 333–342 (1968).
29. Dehlinger, U. & Glocker, R. Über den atomaren Aufbau der Antimonoxyde. Zeitschrift für Anorg. und Allg. Chemie 165, 41–45
(1927).
30. Slade, R. C. T., Hall, G. P., Ramanan, A. & Prince, E. Structure and proton conduction in pyrochlore-type antimonic acid: A neutron
diffraction study. Solid State Ion. 92, 171–181 (1996).
31. Mayer, S. F., Falcón, H., Fernandez-Diaz, M. T., Campos-Martin, J. & Alonso, J. A. Structure-properties relationship in the hydro-
nium-containing pyrochlores (H3O)1+pSb1+pTe1-pO6 with catalytic activity in the fructose dehydration reaction. Dalt. Trans.
49, 11657–11667 (2020).
32. Vaivars, G., Kleperis, J., Azens, A., Granqvist, C. & Lusis, A. Proton conducting composite electrolytes based on antimonic acid.
Solid State Ion. https://doi.org/10.1016/s0167-2738(97)00049-0 (1997).
33. Mayer, S. F., Falcón, H., Fernández-Díaz, M. T. & Alonso, J. A. The crystal structure of defect KBB’O6 pyrochlores (B, B’: Nb, W,
Sb, Te) revisited from neutron diffraction data. Curr. Comput.-Aided Drug Des. 8, 1–11 (2018).
34. Scherrer, P. Bestimmung der Größe und der inneren Struktur von Kolloidteilchen mittels Röntgenstrahlen. In Kolloidchemie Ein
Lehrbuch. Chemische Technologie in Einzeldarstellungen 387–409 (Springer, Berlin, Heidelberg, 1912). https://doi.org/10.1007/
978-3-662-33915-2_7.
35. Langford, J. I. & Wilson, A. J. C. Scherrer after sixty years: A survey and some new results in the determination of crystallite size.
J. Appl. Crystallogr. 11, 102–113 (1978).
36. Stewart, D. J., Knop, O., Ayasse, C. & Woodhams, F. W. D. Pyrochlores. VII. The oxides of antimony: An X-ray and Mössbauer
Study. Can. J. Chem. 50, 690–700 (1972).
37. Jander, G. & Simon, A. Zur Kenntnis der Antimonpentoxydhydrate. Zeitschrift für Anorg. und Allg. Chemie 127, 68–82 (1923).
38. Kovalenko, L. Y., Yaroshenko, F. A., Burmistrov, V. A., Isaeva, T. N. & Galimov, D. M. Thermolysis of hydrated antimony pentoxide.
Inorg. Mater. 55, 586–592 (2019).
39. Lee, P. A., Citrin, P. H., Eisenberger, P. & Kincaid, B. M. Extended X-ray absorption fine structure its strengths and limitations as
a structural tool. Rev. Mod. Phys. 53, 769–806 (1981).
40. Bunker, G. Introduction to XAFS: A Practical Guide to X-ray Absorption Fine Structure Spectroscopy. (Cambridge University Press,
2010). https://doi.org/10.1017/CBO9780511809194.
41. Ravel, B. & Newville, M. ATHENA, ARTEMIS, HEPHAESTUS: Data analysis for X-ray absorption spectroscopy using IFEFFIT.
J. Synchrotron Radiat. 12, 537–541 (2005).
42. Scheinost, A. C. et al. Quantitative antimony speciation in shooting-range soils by EXAFS spectroscopy. Geochim. Cosmochim.
Acta 70, 3299–3312 (2006).
43. Jang, J. & Seung-Joo, K. Photoelectrochemical properties of nanocrystalline Sb6O13, MgSb2O6, and ZnSb2O6-based electrodes
for dye-sensitized solar cells. Jpn. J. Appl. Phys. 51, 1–4 (2012).
44. Fauth, F. et al. The crystallography stations at the Alba synchrotron. Eur. Phys. J. Plus 130, 160 (2015).
45. Rodríguez-Carvajal, J. FULLPROF: A program for rietveld refinement and pattern matching analysis. In Abstracts of Satellite
Meeting on Powder Diffraction of the XV Congress of the IUCr 127 (1990).
46. Rietveld, H. M. A profile refinement method for nuclear and magnetic structures. J. Appl. Crystallogr. 2, 65–71 (1969).
47. Finger, L. W., Cox, D. E. & Jephcoat, A. P. Correction for powder diffraction peak asymmetry due to axial divergence. J. Appl.
Crystallogr. 27, 892–900 (1994).
48. Wertheim, G. K., Butler, M. A., West, K. W. & Buchanan, D. N. E. Determination of the Gaussian and Lorentzian content of
experimental line shapes. Rev. Sci. Instrum. 45, 1369–1371 (1974).
49. Berar, J. F. & Baldinozzi, G. Modeling of line-shape asymmetry in powder diffraction. J. Appl. Crystallogr. 26, 128–129 (1993).
50. Katcho, N. A. et al. An investigation of the structural properties of Li and Na fast ion conductors using high-throughput bond-
valence calculations and machine learning. J. Appl. Crystallogr. 52, 148–157 (2019).
51. Massiot, D. et al. Modelling one- and two-dimensional solid-state NMR spectra. Magn. Reson. Chem. 40, 70–76 (2002).
Scientific Reports | (2021) 11:17763 | https://doi.org/10.1038/s41598-021-97147-0 12
Vol:.(1234567890)You can also read