The Bay Area's Middle Housing Market - September 17, 2021
←
→
Page content transcription
If your browser does not render page correctly, please read the page content below
The Bay Area’s Middle
      Housing Market
                                September 17, 2021

      Prepared for: Association of Bay Area Governments

                                             KOIN Center
                                   222 SW Columbia Street
                                               Suite 1600
                                       Portland, OR 97201
                                            503-222-6060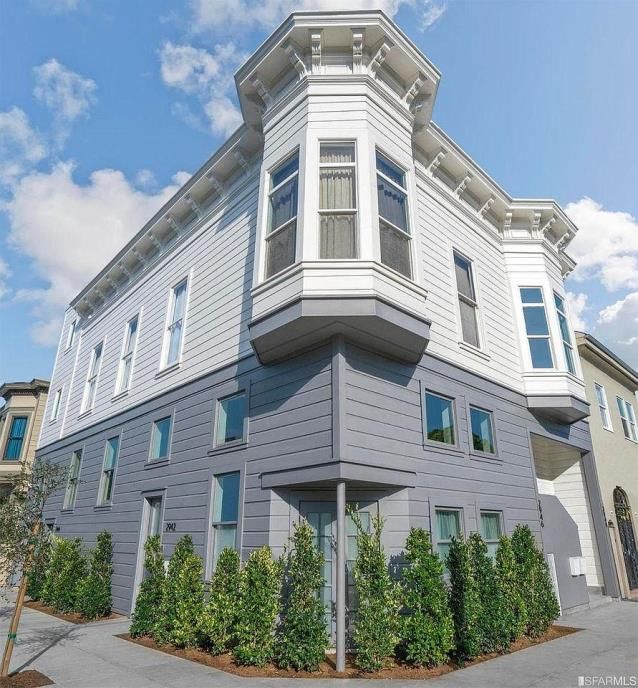
This page intentionally blank
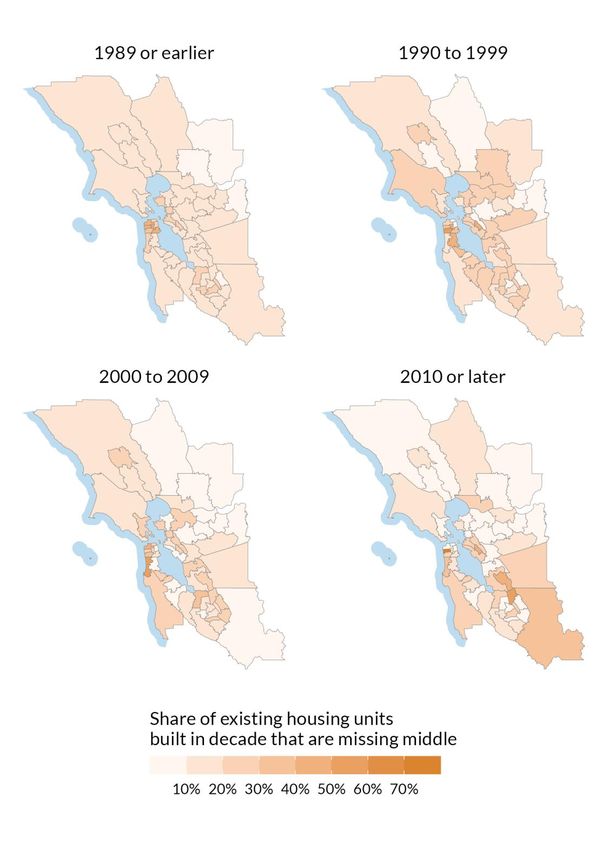
Table of Contents
INTRODUCTION .............................................................................................................................................................. 1

SECTION 1.              MIDDLE HOUSING DEVELOPMENT TRENDS ..................................................................................... 3

SECTION 2.              MIDDLE HOUSING RESIDENTS .......................................................................................................... 5

SECTION 3.              MIDDLE HOUSING MARKET CONDITIONS .......................................................................................12

SECTION 4.              OTHER FACTORS INFLUENCING MIDDLE HOUSING DEVELOPMENT ............................................27

APPENDIX: ADDITIONAL EXAMPLES OF RECENT TRANSACTIONS AND RENTAL LISTINGS ....................................37

This page intentionally blank
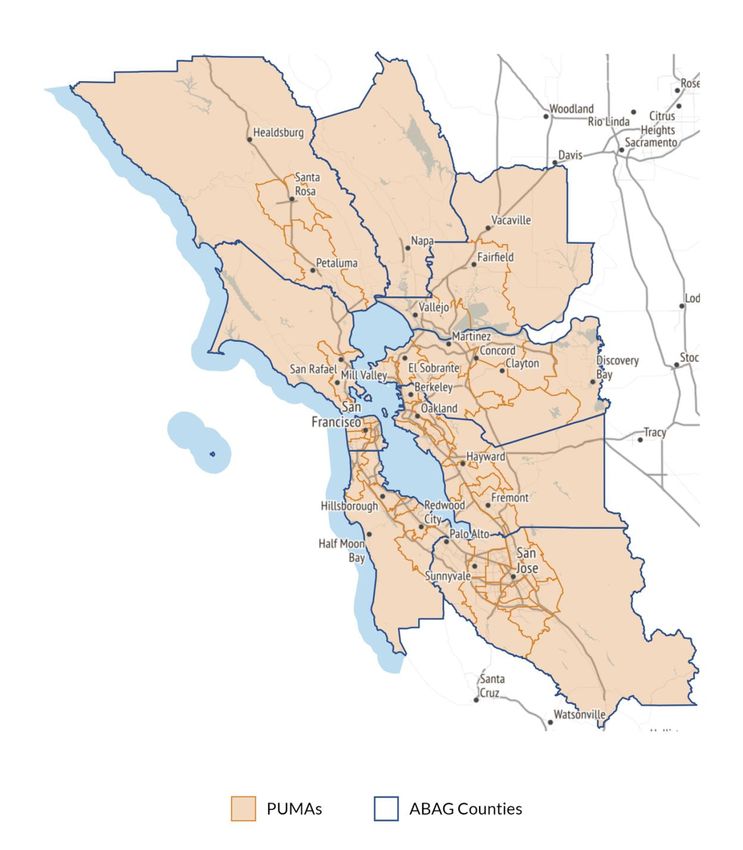
Introduction

Context and Purpose
This report is prepared for jurisdictions in the Association of Bay Area Governments (ABAG)
that are planning for their 6th cycle of the Regional Housing Needs Allocation (RHNA). As
jurisdictions prepare to update their housing policies and strategies in their Housing Elements,
some planning staff and stakeholders are considering policies that could create new housing
opportunities in areas that are predominantly zoned for detached single-family housing.
ECONorthwest, in partnership with Baird+Driskell Community Planning and Opticos Design,
is supporting a Missing Middle Housing Work Group for interested jurisdictions in the Bay
Area to learn about zoning changes that would successfully integrate market-feasible and
compatibly designed “missing middle” housing types (e.g., duplexes, triplexes, townhomes,
small apartments, etc.) in existing low-density residential areas.
This report on the Bay Area’s middle housing market provides context about middle housing in
the Bay Area, including existing middle housing stock, development trends over time, patterns
and trends in middle housing pricing, and demographic information to help understand the
types of households and people that are served by middle housing.

Geography
In addition to considering overall trends across and differences among the nine counties that
comprise the ABAG region, this report uses a smaller geography known as Public Use
Microdata Areas (PUMAs) for much of the data analysis. PUMAs are the smallest units of
geography available for analyzing the US Census’ American Community Survey Public Use
Microdata Sample (ACS PUMS) data. PUMS data allows users to analyze demographic data
with more granularity and cross-tabulation than standard Census tables (e.g., cost-burdened
renter households who speak Spanish and have children present). However, to maintain survey
respondents’ privacy, PUMS data is aggregated geographically to groups of census tracts
intended to contain around 100,000 people. As Figure 1 shows, the ABAG region is made up of
55 PUMAs that generally (though not always) conform to urban-rural divisions within the
region.

ECONorthwest                                                                                       1
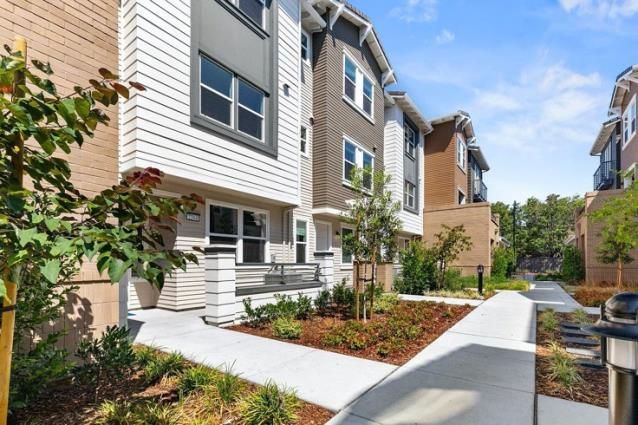
Figure 1. ABAG Region and Study Area Geographies
Source: ECONorthwest, using data from the US Census

ECONorthwest                                          2
Section 1. Middle Housing Development Trends
Middle housing is “missing” in all but a few urban                      Data Note:
areas because past development patterns and                             Data in this section comes from the U.S. Census
                                                                        Bureau—specifically, 2019 American Community
regulations in most areas have favored detached                         Survey (ACS) 1-year sample data from the Public
single-family housing or larger multifamily                             Use Micro Data Sample (PUMS) and permit data
                                                                        aggregated by the U.S. Department of Housing
development.
                                                                        and Urban Development (HUD). While definitions
This section provides a high-level overview of middle                   of middle housing can vary, ECONorthwest’s
                                                                        analysis of Census data uses “attached units” and
housing stock and historical production across the                      buildings having “2-4 units” and “5-19 units” as
region.                                                                 the best available proxy for middle housing within
                                                                        that data set. HUD’s permit data does not include
                                                                        a category for 1-unit attached housing permits
                                                                        and groups all buildings with 5+ units together,
                                                                        which results in discrepancies between the permit
                                                                        data and PUMS.

Existing Middle Housing Stock
As shown in Figure 2, middle housing—combining “lower” and “upper” scales—makes up
about 18% to 28% of the housing stock for most ABAG counties, except for San Francisco
County, where 51% of units are middle housing.

Figure 2. Housing Units by Housing Type and County
Source: ECONorthwest, using ACS PUMS 2019 1-year estimates

Note: Other housing includes mobile homes, RVs, boats, etc., but does not include group quarters.

ECONorthwest                                                                                                         3
Looking at the PUMA scale            Figure 3. Missing Middle Share of Total Housing Units
to see how the pattern varies        Source: ECONorthwest, using ACS PUMS 2019 1-year estimates
within counties (Figure 3)
shows higher concentrations
of middle housing (2- to 19-
unit buildings and attached
units) in more urban areas
with lower percentages
towards the edges of the
region.

Middle Housing Development Trends
Middle housing development has varied over time. Over the past 20 years, 2-4 unit middle
housing has made up a very small portion of the housing permitted and built in the ABAG
region, as seen in Figure 4. However, it is important to note that HUD’s State of the City Data
System (SOCDS), the main source of permit data for the ABAG region, does not differentiate
between 1-unit attached and 1-unit detached structures, resulting in townhome development
being classified under single-family or multifamily (e.g., for townhome-style apartments)
categories.

ECONorthwest                                                                                      1
Figure 4. Housing Units Permitted in ABAG Region by Housing Type and Year
Source: ECONorthwest, using HUD SOCDS

Looking at all existing housing today by the decade in which it was constructed, 1 it’s clear that
middle housing has never been the predominant housing type in the region, but its share of the
housing stock has varied over time. As shown in Figure 5, middle housing represents more than
a quarter of the existing housing that was built before 1940. However, the vast majority of the
housing built in the 1950s, following WWII, was single-family detached, with middle housing
accounting for just 12% of the units built in that decade. Since the 1950s, the share of single-family
detached housing that dates from each decade has been dropping, while the share that is larger
apartment buildings has steadily increased. Middle housing and smaller apartment buildings
with less than 50 units both account for a larger share of the housing built in the 1970s and 1980s
than in most other decades, but have been decreasing as a share of units since that time.

1 Note that this data may not be entirely representative of all housing built in a given decade, because it captures only
the housing that still exists today. Smaller homes and housing that was poorly constructed are generally less likely to
have survived to the present day and may be under-represented in this data set; however, this could include housing
of all housing types, and we do not have data regarding the distribution of housing that has been redeveloped over
time.

ECONorthwest                                                                                                            2

Figure 5. Housing Units in ABAG Region by Decade Built and Housing Type
Source: ECONorthwest, using ACS PUMS 2019 1-year estimates

The development pattern of middle housing has also varied across the region, as shown in
Figure 6. The highest concentration of middle housing built before 1990 is in San Francisco, with
notable shares in Berkeley, Oakland, Richmond, and San Jose areas. Although there were fewer
middle housing units built in the 1990s overall, they were more evenly spread throughout the
Bay Area. Middle housing construction overall dipped again in the following decade, but
middle housing share of new units increased in San Mateo County. For housing built in the past
decade, there are higher concentrations of middle housing in parts of eastern Santa Clara
County, Concord, Walnut Creek, and Vallejo, among other areas.

ECONorthwest                                                                                    3
Figure 6. Middle Housing Share of Housing Units Built by Decade Built
Source: ECONorthwest, using ACS PUMS 2019 1-year estimates

ECONorthwest                                                            4
Section 2. Middle Housing Residents
This section considers how middle housing can align with housing types by life stage and
household size as well as actual data on who is living in the Bay Area’s existing middle housing
stock today.

Who Might Middle Housing Serve?
Middle housing can meet a variety of housing needs. It can provide both rental and
homeownership opportunities across a broad range of unit sizes and price-points. It can serve
those seeking smaller homes, lower cost housing in desirable areas, more environmentally
sustainable housing, and multigenerational housing, among other things. Seniors, younger new
households, and small households are all growing segments of the population that have reasons
to consider middle housing.

Figure 7. Illustration of the Lifecycle of Housing Needs
Source: ECONorthwest, adapted from Clark, W. A. V., & Dieleman, F. M. (1996). Households and housing: Choice and
outcomes in the housing market. New Brunswick, N.J.: Center for Urban Policy Research.

ECONorthwest                                                                                                       5
Seniors and Older Adults: America is aging, and the number of seniors will continue to
        grow for the next few decades. By 2035, seniors (over age 65) are expected to comprise
        one-fifth of the total U.S. population and outnumber children for the first time ever.
        Seniors may prefer housing that allows for downsizing, lower-maintenance living, and
        aging in place. This could include middle housing types with few stairs and shared or
        low-maintenance outdoor areas.
        Younger Households: Younger households are more likely to be renters initially, and
        progress into homeownership when they are able. Lower-cost homeownership
        opportunities, which can include middle housing types, can help first-time homebuyers
        make the leap to homeownership.
        Single-Person and Single-Parent Households: Nuclear family households, the
        predominant type of household of the mid 20th Century, shrunk from 40% in 1970 to 20%
        in 2018 while in contrast, the share of single-person households increased from 15% in
        1970 to 28% in 2018. Today, single person households are the most prevalent household
        type. Growth in single-parent households has elevated so that by 2015, 27% of children
        were living with a single parent.2 These trends have increased the demand for smaller
        housing.

Who Lives in Middle Housing Today?
Middle housing residents in the ABAG region are not a homogenous group; they vary greatly
in terms of size, composition, race, ethnicity, income, and tenure. A household living in a
rowhouse in San Francisco and a household living in a duplex in Fremont are likely to differ in
significant aspects such as income, the rate of cost-burdening, or their reliance on cars as a
primary mode of transportation. Simply summarizing demographic data for all missing middle
households across all nine counties, without accounting for local context, would generalize
away important information.
To account for local geographic context, we summarized key census microdata variables at the
smallest geographic unit available – the Public Use Microdata Area (PUMA) – comparing
middle housing households to all other types of households within their local area. The data
comes from ACS, and households in the “missing middle” housing type include those living in
buildings that are identified as “attached units” or having “2-4 units.”
The difference between middle housing households in a PUMA and other households in the
same PUMA is summarized by calculating the percentage point difference in their
characteristics. For example, if 45% of middle housing households are renters and 30% of all

2AARP (2018) Making Room for a Changing America, U.S. Census Bureau Annual Social and Economic
Supplements 1950 and 1970, 2015 U.S. Census ACS, PSRC Draft 2050 Forecast of People and Jobs.

ECONorthwest                                                                                     6
other households are renters, then we say middle housing households are 10% more likely to be renters than households in their area. The results from all 55 PUMAs in the ABAG region are summarized (weighted by the number of missing middle households) to arrive at the regional average differences between missing middle households and other households. Tenure and Income Middle housing households are more likely to be renters than all other households in their area, but middle housing renters are less likely to be cost-burdened than the other renters in their area. Middle housing renters may be less likely to be burdened compared to other renters because much of middle housing’s rental stock are older, unregulated units that have filtered down to more affordable levels over time. In contrast, middle housing households who do own their home are more likely to be cost-burdened than other home-owners in their area, perhaps because they tend to have lower incomes. Overall, households living in middle housing in the Bay Area are more likely to earn less than the Area Median Income for their area (as defined by HUD) than other households in their area, as shown on Figure 8. However, the difference in household incomes vary greatly in the ABAG region. Figure 9 shows that middle housing households are more likely to have lower incomes in the North Bay area as well as in Richmond, Oakland, Redwood City, Palo Alto, and Mountain View, among others. Middle housing households are less likely to have lower incomes in San Francisco, Fremont, and Santa Clara, among others. Figure 8. Tenure and Income of Middle Housing Households Compared to Other Households Source: ACS PUMS 2019 1-year estimates ECONorthwest 7
Figure 9. Likelihood of Middle Housing Households Earning Below 100% of Area Median Income
Relative to Other Households in the Same PUMA
Source: ACS PUMS 2019 1-year estimates

Demographics
Figure 10 shows that, compared to other households in their area, households living in middle
housing overall are:
        Less likely to include those age 65 and up;
        More likely to have a child present; and
        More likely to have a head of household who is a person of color (POC), meaning
        someone who does not identify as “White and non-Hispanic”.
However, as with income, there are some areas where middle housing households are less
likely to have POC residents than other housing, including northeast San Francisco, parts of San
Jose, and parts of Contra Costa County (see Figure 11).

ECONorthwest                                                                                    8
Figure 10. Demographics of Middle Housing Households Compared to Other Households Source: ACS PUMS 2019 1-year estimates Figure 11. Likelihood of Middle Housing Households that are People of Color Relative to Other Households in the Same PUMA Source: ACS PUMS 2019 1-year estimates ECONorthwest 9
Transportation
Middle housing households in the region are more likely to have one or no vehicles compared
to all other households and are slightly more likely to use transit or bike/walk to work.
There are geographic differences in commuting mode. Figure 13 shows that middle housing
households are more likely to use transit or bike/walk to work in most of the Bay Area, which is
likely correlated with access to the BART transit system. Middle housing households are less
likely to commute by transit or bike/walk in parts of San Francisco, near San Jose and Concord,
and in Marin County.

Figure 12. Vehicle Ownership and Mode of Commute Among Middle Housing Households
Compared to Other Households
Source: ACS PUMS 2019 1-year estimates

ECONorthwest                                                                                  10
Figure 13. Likelihood of Middle Housing Households that Commute by Transit, Bike, or Walk
Relative to Other Households in the Same PUMA
Source: ACS PUMS 2019 1-year estimates

ECONorthwest                                                                                11
Section 3. Middle Housing Market Conditions
Understanding the Middle Housing Market
Middle housing is just one of many choices that households have when making housing
decisions. Their housing type preferences tend to be influenced by their income, savings,
household size and composition, age, and lifestyle (see discussion on page 5). The market for
middle housing is made up of households who might choose middle housing over another
housing type if the middle housing was available in a suitable location and at price point within
their means. The housing market can be thought of as two separate but interconnected markets:
one for for-sale housing, and one for rental housing. Within both the for-sale and rental
markets, middle housing is “competing with” both single-family housing and larger multi-
family housing, but single-family housing is more likely to be owner-occupied / for-sale, while
multifamily housing is more likely to be rental apartments, with fewer for-sale condominiums.
In lower-density areas, nearly all ownership housing is single-family detached, and a sizeable
share of the rental market is older single-family homes that are managed as rentals. In higher-
density areas, condominiums may be the primary ownership option, and nearly all rentals are
in multifamily buildings.
Zoning regulations and government programs have a strong influence over the housing options
available within a community’s housing market today. However, even a highly constrained
housing market can tell us something about the prospective market for middle housing if
zoning regulations were to change. For example:
       In areas where homebuyers are choosing between single-family detached homes and
       potential for-sale middle housing units, demand and high prices for luxury single-family
       homes is likely to translate into high land costs and high prices for newer middle
       housing as well, with larger unit sizes and potentially more outdoor space. While the
       middle housing will typically be less expensive than new single-family housing, it may
       still be too expensive for many households. There may also be strong demand for lower-
       cost housing options in these areas; however, for lower-cost units to be viable and
       potentially compete with luxury housing development in areas with high land costs,
       they must be able to spread the costs across more units through higher density.
       Areas with a strong demand for family-size, moderately-priced rental and for-sale units
       that do not have high demand for luxury units may see development of more
       moderately-priced middle housing with two to four bedrooms and small yards,
       common open space areas, or other outdoor space.
       Areas with many one- and two-person renter households and a strong rental market for
       smaller apartment units may see middle housing with smaller rental units and less
       emphasis on outdoor space (perhaps balconies or roof decks) if regulations allow it in
       ways that are efficient to build.

ECONorthwest                                                                                   12
Bay Area Housing Market Conditions and Trends
This section summarizes market conditions and trends for middle housing, both new
construction and older units. Examples drawn from recent
sales transactions illustrate various middle housing options
Data Note:
that exist today in the ABAG region. Middle housing sales data come from
Redfin (for overall data) and Zillow (for
Sales Prices some transaction data) and were
obtained in July 2021. In the Redfin
data, the “townhouse” category was
Home Prices and Affordability by Housing Type selected to best represent for-sale
middle housing. While some middle
Home prices vary by county and housing type. According to housing may be sold as condominiums,
summary data available through Redfin, 2021 year-to-date condominium units overall tend to be in
larger multifamily buildings that are not
(YTD) median sales prices of single-family detached and representative of middle housing. There
townhouses are both over $1 million in San Mateo, San is also some data for “multifamily 2-4
units”, but it captures sales transactions
Francisco, and Santa Clara Counties, where incomes tend to
for small rental properties (without
be higher. As shown in Figure 14, the median sale price of regard for whether the property has
single-family detached units is consistently more expensive two, three, or four units) and is not a
reliable indicator of for-sale middle
than the median sale price of townhouses across all counties housing prices.
in the ABAG region.
Figure 14. 2021 YTD Median Sales Price by County, Single-
Family Detached and Townhouses
Source: Redfin, July 2021 Median Sales Price: July 2021
$2,000,000
$1,800,000
$1,600,000
Median Sales Price
$1,400,000
$1,200,000
$1,000,000
$800,000
$600,000
$400,000
$200,000
$-
San San Santa Marin Alameda Contra Napa Sonoma Solano
Mateo Francisco Clara Costa
Single-Family Detached Townhouse
ECONorthwest 13Additionally, as shown in Table 1, the median single-family detached unit sales price exceeds
120% of median family income (MFI) in all but one county, as compared to townhouses which
are affordable at close to 100% of MFI for four of the nine counties.3
Table 1. Incomes Needed to Afford a Mortgage in 2021 by County and Housing Type
Source: ECONorthwest analysis of Redfin data; Median Family Income from California Department of Housing and
Community Development
San Contra
San Mateo Santa Clara Marin Alameda Napa Solano Sonoma
Francisco Costa
Townhouse
Median sales price $1,359,700 $1,374,700 $1,106,900 $785,700 $834,800 $696,300 $649,500 $493,800 $465,700
Annual income
needed to afford $257,770 $260,530 $211,330 $152,330 $161,350 $135,900 $127,310 $98,700 $93,540
mortgage
Annual income
needed as a 172% 174% 140% 102% 128% 108% 125% 99% 91%
percent of MFI*
Single-Family
Median sales price $1,851,300 $1,741,400 $1,571,000 $1,645,400 $1,204,300 $895,900 $843,300 $752,600 $546,300
Annual income
needed to afford $348,060 $327,890 $296,580 $310,240 $229,220 $172,560 $162,910 $146,250 $108,350
mortgage
Annual income
needed as a 233% 219% 196% 207% 183% 137% 160% 147% 105%
percent of MFI*
*as compared to 100% MFI for a 4-person household. Orange indicates less affordability, blue indicates greater affordability.
Note: Estimates of the income needed to afford a mortgage, as expressed as a percent of MFI, use a budget-based
approach related to the 100% MFI income limit (for a household of four) as defined by HUD for each county. The
calculations assumed dedicating 30% of a household’s income to housing, a 20% down payment4 and a 30-year mortgage
with a 3.5% interest rate. The calculations also factored in assumed HOA dues of $200 per month, property taxes at 1% of
value, and homeowner’s insurance of 0.20% of value.
As shown on Figure 15, on a per-square-foot basis, single-family detached is still generally more
expensive than townhouses, despite the fact that single-family detached homes tend to be larger
than townhouse units (see Figure 16), and smaller units are sometimes associated with higher
per-square-foot sales prices.
3The price, as expressed as a percent of MFI, is a ratio of the annual income needed to afford a mortgage and other
costs of homeownership (e.g., property taxes and homeowners’ insurance), divided by the 100% MFI income limit for
a household of four. For prices less than 100% MFI, this approach is different from the complex formula used by
HUD to set income limits for affordable housing program eligibility in high-cost housing markets.
4For households earning less than median income, a 20% down payment might require down payment assistance.
Without the assistance, the owners might have to put down less than 20%, which would increase the monthly
mortgage payment and add mortgage insurance costs, reducing what the household could afford and increasing the
income needed to afford to buy at a given price point.
ECONorthwest 14Figure 15. 2021 YTD Median Sales Price per Square Foot by County, Single-Family Detached and
Townhouses
Source: Redfin, July 2021
Median Sales Price per Square Foot: July 2021
$1,200
Meidan Sales Price per Square Feet
$1,000
$800
$600
$400
$200
$-
San Mateo San Santa Marin Alameda Contra Napa Sonoma Solano
Francisco Clara Costa
Single-Family Detached Townhouse
Figure 16. 2021 YTD Median Unit Size (Gross Building Area)
Source: Redfin, July 2021
Median Gross Building Area: July 2021
2,500
2,000
Square Feet
1,500
1,000
500
-
San Mateo San Santa Marin Alameda Contra Napa Sonoma Solano
Francisco Clara Costa
Single-Family Detached Townhouse
Home Prices for New Construction
Redfin also provides data comparing sales of new construction (sales from home builders of
homes that have never been lived in) to sales of existing homes. The data on new construction is
volatile because there are comparatively few units sold each month, but the trend over time and
comparison between single-family detached and townhouses is fairly consistent, as shown in
Figure 17 and Figure 18. (Data is only available for the larger metro areas—San Francisco-
Oakland-Berkeley and San Jose-Sunnyvale-Santa Clara Metropolitan Statistical Areas.)
ECONorthwest 15The charts show that while pricing of new construction is volatile, it is typically more expensive
than existing housing, and the price of new single-family detached homes is escalating faster
than that of new townhouses. Furthermore, the sale price of new townhouses is generally close
to the median price of existing single-family detached homes in the area, while new single-
family detached homes are typically selling for well above the median price of existing homes
in the area.
Figure 17: Median Sale Price of New Construction and Existing Home Sales, San Francisco Metro,
2011-2021
Source: Redfin, July 2021, 90-day rolling
San Francisco Metro Area
$4,500,000
$4,000,000
$3,500,000
$3,000,000
$2,500,000
$2,000,000
$1,500,000
$1,000,000
$500,000
$0
April 2011
October 2011
April 2012
October 2012
April 2013
October 2013
April 2014
October 2014
April 2015
October 2015
April 2016
October 2016
April 2017
October 2017
April 2018
October 2018
April 2019
October 2019
April 2020
October 2020
July 2011
January 2012
July 2012
January 2013
July 2013
January 2014
July 2014
January 2015
July 2015
January 2016
July 2016
January 2017
July 2017
January 2018
July 2018
January 2019
July 2019
January 2020
July 2020
January 2021
2011 2012 2013 2014 2015 2016 2017 2018 2019 2020 2021
SFR Existing SFR New Construction TH Existing
TH New Construction SFR New Construction Trend TH New Construction Trend
ECONorthwest 162021
$500,000
$1,000,000
$1,500,000
$2,000,000
$2,500,000
$3,000,000
$0
ECONorthwest
April 2011
July 2011
2011
October 2011
January 2012
April 2012
July 2012
2012
SFR Existing
October 2012
January 2013
April 2013
TH New Construction
July 2013
Source: Redfin, July 2021, 90-day rolling
2013
October 2013
January 2014
April 2014
July 2014
2014
October 2014
January 2015
April 2015
July 2015
2015
October 2015
January 2016
April 2016
San Jose Metro Area
SFR New Construction
July 2016
2016
October 2016
SFR New Construction Trend
January 2017
April 2017
July 2017
2017
October 2017
January 2018
TH Existing April 2018
July 2018
2018
October 2018
January 2019
April 2019
July 2019
2019
TH New Construction Trend
October 2019
January 2020
April 2020
July 2020
October 2020
Figure 18: Median Sale Price of New Construction and Existing Home Sales, San Jose Metro, 2011-
January 2021
2020 2021
17Rental Market Data Note:
Rental data comes from CoStar (a
Rent Trends proprietary data source primarily
focused on larger income properties)
The overall rental market in the Bay Area experienced a and from Zillow’s Observed Rent Index.
In the CoStar data, multifamily
rapid increase in rents in the middle of the last economic developments with 2 to 5 units were
cycle. Figure 19 shows an annual rent increase of 10% to selected to represent middle housing
15% in 2015. The pace of rent growth slowed in 2016 and types in some cases, but due to data
limitations for this scale of property,
settled at about 3% per year through 2019. In the past year, two- to three-story properties with up
rents have fallen by 6% on an annual basis due to the to 20 units were used for more detailed
analysis.5 Zillow’s rent data does not
pandemic. differentiate by housing type.
Figure 19. Overall Rent Trends, San Francisco Metro Area,
2015-2021
Source: Zillow Observed Rent Index
Rents and YoY % Change in San Francisco Metro Area
$3,600 20%
Annual % Change in ZORI
$3,000 15%
$2,400 10%
ZORI
$1,800 5%
$1,200 0%
$600 -5%
$- -10%
Mar-16
Mar-17
Mar-18
Mar-19
Mar-20
Mar-21
Jun-15
Sep-15
Dec-15
Jun-16
Sep-16
Dec-16
Jun-17
Sep-17
Dec-17
Jun-18
Sep-18
Dec-18
Jun-19
Sep-19
Dec-19
Jun-20
Sep-20
Dec-20
Jun-21
Annual % Change in Zillow Observed Rent Index Zillow Observed Rent Index
Looking at multifamily rent (for multifamily buildings of all sizes) by County, a similar trend
appears, with fairly steady rent growth post-recession starting in 2009-2010, with a dip in 2020
across many of the more urban counties due to COVID. Average rent per unit, blending all sizes
of units and accounting for concessions (e.g., offering weeks of free rent at the start of a lease),
as of July 2021 ranges from just over $1,700 in Solano and Sonoma Counties to over $2,800 in
San Francisco County.
5 Because of CoStar’s focus on larger income properties and the difficulty of collecting data from many small
landlords for smaller multifamily properties, data coverage and quality for housing in this size range is poor;
however, there are no better readily available sources of data for this type of housing.
ECONorthwest 18Figure 20. ABAG Region Multifamily Rent Trends by County, 2000-2021
Source: ECONorthwest, using data from CoStar (average effective rent per unit)
$3,500
$3,000
San Francisco, $2,861
San Mateo, $2,685
Santa Clara, $2,502
$2,500
Napa, $2,494
Average Effective Rent per Unit
Alameda, $2,143
$2,000 Marin, $1,989
Contra Costa, $1,977
Sonoma, $1,755
Solano, $1,708
$1,500
$1,000
$500
$0
00 01 02 03 04 05 06 07 08 09 10 11 12 13 14 15 16 17 18 19 20 TD
20 20 20 20 20 20 20 20 20 20 20 20 20 20 20 20 20 20 20 20 20 1 Y
2
20
Rent for New Construction
For newer multifamily buildings in particular, looking specifically at two-bedroom rents, Figure
21 shows that very few newer buildings offer rents below $2,000 per month for an average two-
bedroom unit. Most newer building rents fall between $3,000 and $4,000 for a two-bedroom in
Alameda, Contra Costa, and Santa Clara Counties, while in San Francisco and San Mateo most
newer buildings charge between $4,000 and $5,000 or more for a typical two-bedroom. There
are few newer apartment buildings in Marin, Napa, Solano, and Sonoma Counties, but their
rents are somewhat more affordable, at between about $2,500 and $3,500 for a two-bedroom.
ECONorthwest 19Figure 21: Distribution of Rents for Multifamily Built in Last 10 Years by County (Two Bedroom Units) Source: ECONorthwest, using August 2021 data from CoStar; effective rents for market-rate multifamily built since 2011 Within these newer buildings, Figure 22 shows that smaller-scale multifamily that is more similar to middle housing tends to be less expensive than other, larger multifamily buildings. This is likely due to differences in the cost of construction at different scales and the number and type of amenities that are provided in the building—larger buildings tend to have more amenities, which can add costs and also increase what tenants are willing to pay in rent. As shown in Table 2, the two-bedroom rents of the newer small multifamily buildings are generally affordable at 70-110% of MFI for a three-person household, while those for larger new multifamily buildings tend to be affordable for households earning 100-140% of MFI for a three- person household.6 6To arrive at the estimates of the income needed to afford the rent, as expressed as a percent of MFI, we assumed dedicating 30% of a household’s income to housing and compared that income to the 100% MFI income limit (for a household of three, as is the typical assumption for 2-bedroom units) as defined by HUD for each county. ECONorthwest 20
Figure 22: Rents for Multifamily Built in Last 10 Years by County and Building Scale (Two Bedroom
Units)
Source: ECONorthwest, using August 2021 data from CoStar; effective rents for market-rate multifamily built since 2011

 $6,000

 $5,000

 $4,000

                                                                                                                                           1-3 stories - 3-20 units
 $3,000                                                                                                                                    1-3 stories - >20 units
                                                                                                                                           4-7 Stories (Mid-rise)
                                                                                                                                           8 + Stories (Tower)
 $2,000

 $1,000

      $0
              Alameda       Contra        Marin         Napa          San          San          Santa       Solano       Sonoma
                            Costa                                  Francisco      Mateo         Clara

Table 2. Incomes Needed to Afford Rent for Newer Multifamily in 2021 by County and Building
Scale
Source: ECONorthwest analysis of CoStar data; Median Family Income from California Department of Housing and
Community Development

                                               San                                                             Contra
                           San Mateo                       Santa Clara         Marin         Alameda                              Napa       Solano       Sonoma
                                            Francisco                                                          Costa
Buildings with 20 units or less (built after 2011)
 Median income
 Annual   2-bed rent         $4,010         $5,580               $2,870              N/A         $2,880               N/A            N/A           N/A       $2,420
 needed to afford
                         $160,480 $223,080                   $114,600                N/A      $115,240                N/A            N/A           N/A      $96,840
 rent
 Annual income
 needed as a                 119%           166%                    84%              N/A           102%               N/A            N/A           N/A           104%
 percent of MFI*
Buildings with 21 units or more (built after 2011)
 Median income
 Annual   2-bed rent        $4,370        $4,650                 $3,690              N/A         $3,840               N/A            N/A           N/A       $2,770
  needed to afford
                             $174,840        $185,880        $147,480                N/A      $153,440                N/A            N/A           N/A    $110,800
  rent
  Annual income
  needed as a                     130%            138%            108%               N/A           136%               N/A            N/A           N/A           119%
  percent of MFI*
  *as compared to 100% MFI for a 3-person household. Orange indicates less affordability, blue indicates greater affordability.

ECONorthwest                                                                                                                                                        21
Middle Housing Rents
Looking more specifically at multifamily buildings with two to five units, there are few
observations of newer construction, as most of the building stock in this size range is older.
Current average asking rents for middle housing (buildings with two to five units in CoStar) are
estimated at between about $1,200 per month in Solano and Sonoma Counties to over $2,100 per
month in San Francisco County. This appears to be substantially more affordable than overall
multifamily rents, likely due to a combination of older building stock, fewer amenities, smaller
units, and rent data that is not updated as reliably.
Figure 23. Average Asking Rents by County for 2-5 Unit Multifamily, 2021
Source: ECONorthwest, using data from CoStar (2021, Q2)
$2,500
$2,000
Average Asking Rent
$1,500
$1,000
$500
$0
Alameda Contra Marin Napa San Santa San Solano Sonoma
County Costa County County Francisco Clara Mateo County County
County County County County
Note: Rent data from smaller rental properties is less likely to be updated consistently than rent data from larger buildings.
In addition, the existing buildings in this size range are generally older properties and may have smaller units than other
multifamily properties.
Middle Housing Sales and Rental Pricing Examples
The examples in this section are intended to illustrate a range of price-points for newer middle
housing of a range of types and in a range of locations. Not all examples shown exemplify “best
practices” from a design perspective, but they reflect the diversity of middle housing stock in
the ABAG region. For each example, this section identifies the location and housing types, unit
size, parking available, sales price/rent (including the per unit amount if the listing is for
multiple units), year built, and photos from sales or rental listings. Some examples include
location information provided in the listing or based on reviewing Google maps. The
ECONorthwest 22information and pictures were collected from listings on Zillow and Redfin in July 2021. More
examples, including examples of older middle housing buildings, are available in the appendix.
Napa: Duplex / House with ADU7
Duplex unit 1
3 beds, 2.5 baths
1,590 square feet
Duplex unit 2
1 bed, 1 bath
565 square feet
1-car garage
$1.1 million ($550,000 per unit)
Built 2018
“This Napa duplex presents a unique turnkey
opportunity for either an investor or
owner/landlord… Conveniently located off
Lincoln Ave East and approx .6 miles to
Downtown.”
Concord: Townhouse8
3 beds, 3 baths
1,876 square feet
2-car garage
$800,000
Built 2020
“This quaint townhome community is nestled
in the heart of Concord.”
7 https://www.zillow.com/homedetails/1962-Yajome-St-Napa-CA-94559/111417685_zpid/
8 https://www.redfin.com/CA/CONCORD/1840-ENCLAVE-PL-94519/home/52205621
ECONorthwest 23Pittsburgh: Triplex9
3 beds, 2.5 baths
1,300 square feet
$2,800 per month
Built 2020
“located near downtown Pittsburg, three
minute drive to BART and Hwy 4. Three
minute walk to marina shoreline and
restaurants”
Castro Valley: Triplex (Detached)10
Triplex unit 1
2 beds, 1 bath
2-car garage
Triplex units 2 and 3 (same)
3 beds, 2.5 baths each
2-car garage each
3,719 square feet (total)
$2.26 million ($753,000 per unit)
Built/Remodeled 2018
“1 extensively remodeled home + 2 newer
construction homes (2018) on large
13,404sf. lot, centrally located in highly
desirable Castro Valley close to great schools,
parks, shopping and transportation.”
9https://www.zillow.com/homes/465-E-Santa-Fe-Ave-.num.463.dash.465.dash.46-Pittsburg,-CA-
94565_rb/2072157873_zpid/; CoStar
10 https://www.redfin.com/CA/Castro-Valley/20175-San-Miguel-Ave-94546/home/819059
ECONorthwest 24San Mateo: Townhouse11
3 beds, 2.5 baths
1,750 square feet
1-car garage
$5,400 per month
Built 2019
“Only a few blocks away from Burlingame Ave
Shops & Restaurants, the Library and all
amenities. … Easy access to 101, 280 &
Bart.”
San Jose: Townhouse with ADU12
3 beds, 3.5 baths
1,452 square feet
2-car garage
$990,000
Built 2018
“2 Masters Suites Upstairs with one Studio on
1st Level… Ground Floor Features Full
Kitchen, Bathroom and Private exterior
entrance, great for In-Laws or as a RENTAL
INCOME. Walking distance to the
neighborhood park, playground & basketball
court. This property is located approx. 1 mile
from The Plant Shopping Center, Costco &
major freeways. Centrally located near
Caltrain & VTA, downtown San Jose, most
major tech companies & a few miles from the
future San Jose Google Campus.”
11 https://www.zillow.com/homedetails/322-Grand-Blvd-San-Mateo-CA-94401/15521746_zpid/
12 https://www.zillow.com/homedetails/2726-Montecito-Vista-Way-San-Jose-CA-95111/2081101433_zpid/
ECONorthwest 25Redwood City: Duplex13
Duplex
3 beds, 3.5 baths each
1,707 square feet each
2-car garage (side-by-side)
2-car garage (tandem)
$2.75 million ($1.325 million per unit)
Built 2021
Close to parks and commercial areas.
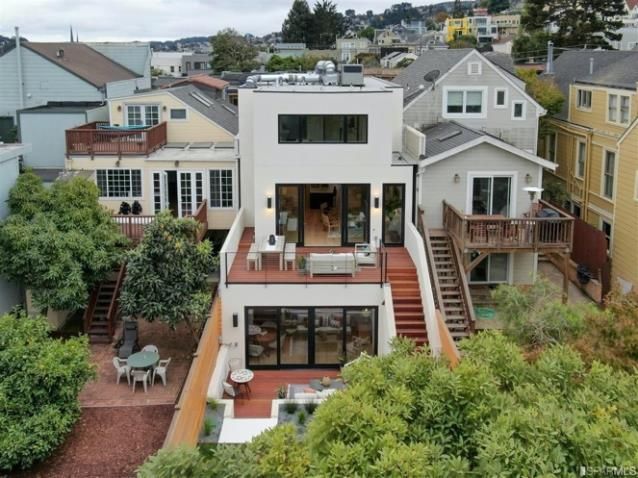
San Francisco: Duplex / Home with ADU14
Unit 1: 3 beds, 2.5 baths
Unit 2: 2 beds, 1.5 baths
3,575 square feet (total)
1-car garage
$4.9 million ($2.45 million per unit)
Built 2020
Close to transit and commercial areas.
13 https://www.zillow.com/homes/1128-Mckinley-St-Redwood-City,-CA-94061_rb/15574223_zpid/
14 https://www.redfin.com/CA/San-Francisco/232-Clipper-St-94114/home/1728382
ECONorthwest 26Section 4. Other Factors Influencing Middle Housing Development Because there have been fewer opportunities to build middle housing in recent decades, expanding the supply of middle housing requires understanding the business model for middle housing development and how additional middle housing might be built today. Tenure: How Form Drives Finance (and vice versa) Middle housing can be owner-occupied or rental housing, or a combination of the two (e.g., where the owner lives in one unit and rents another). Ownership can also take several forms, including fee simple and condominium ownership. While most development codes do not address tenure, it is an important factor in the business model for developing middle housing because it affects how it is financed by developers, when developers can recoup their investment, and the legal risks/complexities associated with development. Rental vs. Ownership Relatively few development companies are set up to build units that they retain ownership of and rent. Many rely on the proceeds from selling the units they have built to fund their next project. There are also relatively few investors who build new investment properties themselves. Rental housing development typically requires a partnership between a developer who has the expertise to take a property through the development process and an investor who buys the property as an investment once it is complete and occupied. While larger apartment buildings are often owned by institutional investors, small apartments and plexes are more likely to be owned by local real estate investors or even (mostly for two and three-unit buildings) by an individual who lives in one unit and rents out the other(s). The number of interested investors may be a limiting factor on new rental middle housing development. Fee Simple vs. Condominium Ownership With fee simple ownership, the owner owns the house and the land. This generally requires each unit to be on its own lot and have frontage on a street. 15 Units must be side-by-side or detached, not stacked. This tends to be the simplest form of ownership for the builder and the buyer and is common for single-family detached housing and townhouses, so buyers and homebuilders are generally comfortable with it. However, land division can be a time- consuming process. 15Whether and in what circumstances new lots can be created without street frontage is determined by local land division standards. ECONorthwest 27
Fee simple developments can include common areas maintained by homeowners’ associations
(HOAs) or cross-access easements that enable adjacent properties to share driveways. However,
HOAs and easements increase complexity somewhat for developers and can add costs for
buyers (HOA dues).
With condominium ownership, the owner generally owns the space within their walls (and
sometimes the exterior, particularly for detached condominiums). The land (and often the
exterior structure) is owned and maintained by a condominium association. Due to construction
defect liability laws, which allow condominium associations to hold developers liable for issues
with the building (e.g., water intrusion) for years after completion, and which have been the
source of many lawsuits, many homebuilders avoid condominium ownership. 16 Those who do
build condominiums sometimes create the condominiums but hold them as rentals for the first
10 years until the statute of limitations for construction defect liability has passed before selling
them. Architects in California also face liability on condominium projects and must carry
expensive liability insurance; this increases design costs and means that few architects are
willing to work on smaller condominium projects. However, condominium creation can be
faster than land division in some cases.
For homebuyers, condominiums can offer a lower purchase price than fee simple ownership
because they do not fully include the land cost, but typically have higher ongoing costs for
condominium association dues.

Implications for Middle Housing Form
Townhouses are often on their own lots, which provides fee simple ownership. This tends to
make them more appealing to both builders and buyers. However, with attached units and
sometimes shared driveways or common areas, they sometimes have HOAs and/or cross-access
easements. Local code requirements (for setbacks, open space, etc.) can sometimes make
creation of fee simple townhomes difficult or impossible, depending on lot size and
configuration, or can result in very small footprint, vertical townhomes that make inefficient use
of space (with a larger percentage of each townhome’s floor area devoted to stairwells).
Because plexes are typically multiple units on a single lot, they cannot be built with fee simple
ownership. They are commonly built as rentals, either with the owner living on-site (e.g., for
some duplexes or triplexes) or as an investment property. If they are built for ownership, it
would be condominium ownership, which is less appealing for some builders and buyers.

16While Senate Bill 800, passed in 2002, introduced reforms to construction defect liability laws aimed at reducing the
number of construction-defect lawsuits and making it easier for developers/builders to obtain liability insurance for
the housing constructed, the liability risk remains. (FindLaw Attorney Writers, California Senate Bill 800:
"Groundbreaking" Legislation Concerning Construction Defect Claims,” March 26, 2008,
https://corporate.findlaw.com/corporate-governance/california-senate-bill-800-groundbreaking-legislation.html) The
risk is not limited to condominium developments, but because condominium associations typically own and
maintain the exterior structure of the building, the likelihood of lawsuits tends to be higher for condominium
projects.

ECONorthwest                                                                                                        28
Duplexes that are designed like single-family homes with an Accessory Dwelling Unit (ADU),
such that one unit is larger than the other, are often purchased by individual home-buyers, who
may (or may not) then rent out the smaller unit as a source of rental income. By keeping costs
and design similar to a typical single-family detached home, these tend to have a broader
market and pool of potential buyers than multiplexes with more units.
Cottage cluster units may or may not be on individual lots. However, even if they are on
individual lots, they tend to require HOAs and cross-access easements, which limit the benefits
of fee simple ownership.

Scale: Why Building Smaller Can Be Harder
The scale of a development project and the number of units per property have important
implications for financing, property management, and condominium liability.

Financing and Investors for Small Rental Properties
For rental housing, demand for new construction is based on both demand from future renters
and demand from future investors in the rental housing. These factors are related (greater
demand for rental housing tends to increase interest in rental housing as an investment), but
certain types of investors are only interested in acquiring certain types of rental properties. As
shown in Figure 24, most small rental properties are owned by individuals.

Figure 24: Owner Type for Apartments by Number of Units in Property, United States, 2020
Source: Rental Housing Finance Survey, US Department of Housing and Urban Development and US Census Bureau, June
2020, via National Multifamily Housing Council Quick Facts (https://www.nmhc.org/research-insight/quick-facts-
figures/quick-facts-ownership-and-management/).

 100%
  90%                                                                                 Other / Not Reported
  80%
                                                                                      Nonprofit Organization/Housing
  70%                                                                                 Cooperative/Tenant in Common
  60%                                                                                 Real Estate Corporation

  50%
                                                                                      Real Estate Investment Trust
  40%                                                                                 (REIT)
  30%                                                                                 LLP, LP, LLC, or General
                                                                                      Partnership
  20%                                                                                 Trustee for estate
  10%
                                                                                      Individual Owner
    0%
               2-4 Units in           5-49 Units in           50+ Units in
                Property                Property               Property

Note: LLP, LP, LLC, and General Partnership are common legal structures used to hold investment properties for both large
institutional investors and some smaller investors. It is often difficult to determine who the “true” owners are for property
held by one of these types of entities.

ECONorthwest                                                                                                               29
Individuals can buy properties with up to four units using FHA (Federal Housing Authority) loans if they occupy one of the units, which provides easier access to financing and typically lower interest rates for small investors. Financing is based on both the expected rental income (net of expenses) and the buyer’s other income and credit rating.17 Other residential mortgage options are available for investors in properties with two to four units who don’t plan to live on-site, though down-payments and interest rates are typically higher. For more than four units, buyers must get a commercial loan, which can be challenging for new investors. Commercial loans typically require more equity investment (a larger down-payment) and have higher interest rates than residential mortgages, particularly for those without a strong track-record in commercial real estate. Multiplexes and small apartment buildings are typically owned by regional real estate investors or smaller investment groups who have experience owning rental properties and access to commercial loans, but do not have enough funds available to acquire larger properties. Large apartment buildings are more likely to be owned by institutional investors and investment groups with strong access to capital—both equity investment and commercial loans— and large amounts of money to invest. These investors can place more of their funds with fewer transactions if they invest in larger properties, and can also benefit from management efficiencies, as described below. Scale also affects affordable housing developers. Much funding for affordable rental housing comes from the Low-Income Housing Tax Credit (LIHTC) program, which works best for larger developments with more units. Affordable housing developers using other funding sources may have more flexibility to develop at different scales, but those operating rental housing will still face the same scale challenges related to property management as market-rate housing (see below). However, affordable homeownership development, such as Habitat for Humanity, is often funded in ways that make building smaller projects more appropriate. Affordable homeownership development is often compatible with townhome-style or cottage courtyard forms, as they lower the land cost per unit while allowing the potential for fee-simple development. Property Management Smaller rental properties face a number of inefficiencies for property management relative to larger properties. Larger properties can support on-site property management, while smaller properties typically must pay a property management company. While management fees vary, they are commonly higher as a percentage of rent or on a per unit basis for smaller properties than larger ones. Smaller properties mean property managers must visit more different sites to 17Up to 75 percent of the rental income from the unit(s) that are rented out can be used to qualify for the mortgage. For triplexes and fourplexes, buyers must also show that 75 percent of the rent is sufficient to cover the mortgage payment. (A and M Mortgage, “Understanding The FHA Self Sustainability Test For 3 & 4 Unit Properties,” https://www.anmtg.com/mortgage-resources/fha-loans/fha-sustainability-test-3-4-units/) ECONorthwest 30
meet with tenants and respond to issues. They also mean more building-level issues (e.g., roof,
landscaping, parking) relative to the number of units managed or the amount of rent collected.

Condominium Liability
While all condominium projects face liability risks and additional costs for insurance as
discussed above (see page 27), the scale of the development project affects the economics of
paying for the necessary insurance. With costs very high, small condominium projects may not
be worth the insurance cost for buildings and designers, while larger projects may better justify
and cover the expense of the insurance. However, the scale of the project also affects lawyers’
interest in litigation—a small project with just a few units means that payouts are likely to be
smaller and may not be worth the lawyer’s effort to press a lawsuit, whereas large condo
projects with more units tend to have more expensive repairs and larger payouts, making them
more of a target for litigation.18 Still, the difference in risk may or may not be reflected in the
cost of liability insurance policies for the development team. Small projects that are able to
obtain reasonable insurance rates may be able to consider condominium development, but
many will not be able to absorb the expense, and mid-size projects may be a particular
challenge.

Context: Middle Housing Project Types
Middle housing development can occur in a range of contexts and be built by different types of
developers. This section provides examples of some of the ways that middle housing
development occurs, and what type of developers may build middle housing in different
contexts.

Incorporated into new master-planned neighborhoods
New master-planned residential development sometimes includes a mix of single-family homes
and some for-sale middle housing types (e.g., townhouses, homes with accessory dwelling
units, or perhaps duplexes). The overall housing mix can vary: in larger developments where
zoning allows it, townhouses may represent a sizable share of the units, while other projects
may include only small numbers of duplex units. Developments typically span many acres with
a dozens or hundreds of units.
        Developers:
             Large professional developers: Master-planned communities tend to be delivered by
             larger land developers and/or homebuilders who primarily build single-family
             homes and townhouses. Many have little or no experience with other housing types.

18Kevin de Freitas, AIA, arcCA, “Working Around Condominiums,” January 2, 2018,
https://aiacalifornia.org/working-around-condominiums/; originally published 1st quarter 2005, in arcCA 05.1, “Good
Counsel.”

ECONorthwest                                                                                                    31
Most specialize in for-sale construction; few are set up to deliver both for-sale
housing and rental housing.
Examples:
Daybreak, South Jordan, UT (https://www.daybreakutah.com/find-a-home/)
Reeds Crossing, Hillsboro, OR (https://www.reedscrossing.com/new-homes/)
The Vineyards, Dublin, CA (http://integralcommunities.com/the-vineyards)
Luminescence at Liberty, Rio Vista, CA (https://www.denovahomes.com/new-
homes/ca/rio-vista/luminescence-at-liberty/7423/)—55+ community
Large for-sale townhome developments in higher-density areas
In areas with medium-density or multifamily zoning, larger groups of townhouses (e.g., 20-80
units) may be developed for sale. They may not be “house-scale” due to the number of units in
the buildings and the scale of the buildings.
Developers:
Large professional developers: Often built by developers who specialize in this type
of development and have the capacity and access to financing to deliver larger
projects. Most specialize in for-sale construction; few are set up to deliver both for-
sale housing and rental housing.
Affordable housing developers: Habitat for Humanity can work at this scale in
higher-density urban areas when larger sites are available.
Examples:
Residences at the District, Milpitas, CA (http://integralcommunities.com/residences-
at-the-district)
The Redwoods at Montecito, Redwood City, CA
(https://www.dividendhomes.com/communities/the-redwoods-at-
montecito/neighborhood/)
Bay Meadows, San Mateo, CA (https://baymeadows.com/residences/)
Mulberry Townhomes, Alameda, CA (https://www.livabl.com/2017/08/city-
ventures-opening-mulberry-townhomes-alameda.html)
Pear Tree, Napa, CA (https://www.taylormorrison.com/ca/bay-area/napa/pear-tree)
Elev8tion at Sunnyvale, Sunnyvale, CA (https://www.taylormorrison.com/ca/bay-
area/sunnyvale/elev8tion)
Esperanza Place by Habitat for Humanity, Walnut Creek, CA
(https://www.habitatebsv.org/blog/welcome-to-esperanza-place)
ECONorthwest 32Large townhome or middle housing-style rental developments
Some larger rental properties function like apartment complexes but can take the form of
townhomes (which may or may not be “house-scale”) or smaller clusters of units in house-scale
buildings (though they may be on the larger end of the middle housing spectrum). Both
affordable and market rate housing developers sometimes use this model to create a more
neighborhood-oriented feel while maintaining the operational efficiency of a larger rental
property.
Developers:
Large professional developers: Often built by multifamily rental housing developers
with the capacity and access to financing to deliver larger projects and expertise with
wood-frame construction (vs. podium or high-rise construction). Most specialize in
building rental housing. Some build for long-term ownership/management by the
development company; others build with the intention of selling the property to
investors (often large institutional investors, such as pension funds) once it is
completed and leased up.
Affordable housing developers: Also used sometimes by affordable rental housing
developers that work primarily with state and federal funding, which tends to work
best for multifamily development.
Examples:
Prairie Queen, Omaha, NE (https://opticosdesign.com/work/bungalows-on-the-lake-
prairie-queen/)
La Terraza, San Jose, CA (https://www.liveatlaterraza.com/floorplans.aspx)—mix of
townhouse-style apartments and flats in 8- to 10-unit buildings
Windsor Veterans Village, Windsor, CA (https://housingvets.org/windsor-veterans-
village/)
Bridge Meadows, Portland, Beaverton, and Redmond, OR
(https://bridgemeadows.org/about-us/#Communities)—multigenerational affordable
housing developments
Mid-scale middle housing infill development
In areas zoned for higher density where the market supports infill and redevelopment on small
sites, the mid-range of the middle housing spectrum sometimes emerges, with live/work units,
townhouses, multiplexes, etc.
Developers:
Small professional developers: Some smaller developers specialize in infill
development. Their financing may come from a variety of sources depending on the
project.
ECONorthwest 33You can also read