The Biolog EcoPlate Technique for Assessing the Effect of Metal Oxide Nanoparticles on Freshwater Microbial Communities
←
→
Page content transcription
If your browser does not render page correctly, please read the page content below
nanomaterials

Article
The Biolog EcoPlate™ Technique for Assessing the Effect of Metal
Oxide Nanoparticles on Freshwater Microbial Communities
Imre Németh, Szabina Molnár, Emese Vaszita and Mónika Molnár *

                                          Department of Applied Biotechnology and Food Science, Faculty of Chemical Technology and Biotechnology,
                                          Budapest University of Technology and Economics, H-1111 Budapest, Hungary; nemeth.imre@vbk.bme.hu (I.N.);
                                          szabina.molnar@edu.bme.hu (S.M.); vaszita.emese@vbk.bme.hu (E.V.)
                                          * Correspondence: molnar.monika@vbk.bme.hu

                                          Abstract: The application of Biolog EcoPlate™ for community-level physiological profiling of soils is
                                          well documented; however, the functional diversity of aquatic bacterial communities has been hardly
                                          studied. The objective of this study was to investigate the applicability of the Biolog EcoPlate™
                                          technique and evaluate comparatively the applied endpoints, for the characterisation of the effects of
                                          metal oxide nanoparticles (MONPs) on freshwater microbial communities. Microcosm experiments
                                          were run to assess the effect of nano ZnO and nano TiO2 in freshwater at 0.8–100 mg/L concentration
                                          range. The average well colour development, substrate average well colour development, substrate
                                          richness, Shannon index and evenness, Simpson index, McIntosh index and Gini coefficient were
                                          determined to quantify the metabolic capabilities and functional diversity. Comprehensive analysis

                                   of the experimental data demonstrated that short-term exposure to TiO2 and ZnO NPs affected the
                                          metabolic activity at different extent and through different mechanisms of action. TiO2 NPs displayed
Citation: Németh, I.; Molnár, S.;
Vaszita, E.; Molnár, M. The Biolog
                                          lower impact on the metabolic profile showing up to 30% inhibition. However, the inhibitory effect
EcoPlate™ Technique for Assessing         of ZnO NPs reached 99% with clearly concentration-dependent responses. This study demonstrated
the Effect of Metal Oxide                 that the McIntosh and Gini coefficients were well applicable and sensitive diversity indices. The
Nanoparticles on Freshwater               parallel use of general metabolic capabilities and functional diversity indices may improve the output
Microbial Communities.                    information of the ecological studies on microbial communities.
Nanomaterials 2021, 11, 1777. https://
doi.org/10.3390/nano11071777              Keywords: Biolog EcoPlate™; freshwater microbial community; biodiversity; metal oxide nanoparticles;
                                          nano titanium dioxide; nano zinc oxide
Academic Editors: Alexandru
Mihai Grumezescu and
Oana Gherasim

                                          1. Introduction
Received: 27 May 2021
Accepted: 6 July 2021
                                               Microbial diversity in aquatic and terrestrial environments is a key component of
Published: 8 July 2021
                                          ecosystem functioning, consequently contamination of these environmental matrices poses
                                          potential threats to the structure and function of the respective ecosystems [1–3]. Nano
Publisher’s Note: MDPI stays neutral
                                          titanium dioxide (nTiO2 ) and nano zinc oxide (nZnO) belong to the anthropogenic en-
with regard to jurisdictional claims in
                                          gineered metal oxide nanoparticles (MO-ENPs), the production and use of which was
published maps and institutional affil-   estimated to increase exponentially during the years owing to their extensive application
iations.                                  in medicine, electronics, cosmetic and textile industry [4,5], but recently also in modern
                                          agriculture [6]. The likeliness of nTiO2 and nZnO release into the environment is higher
                                          than that of other ENPs, given their high global production and consumption volume
                                          among the MONPs [7] and the several transport pathways. Some studies have reported the
Copyright: © 2021 by the authors.
                                          presence of anthropogenic ENPs, particularly TiO2 , in streams [8], wastewater treatment
Licensee MDPI, Basel, Switzerland.
                                          plants [9,10] and lakes [11]. Once released into the aquatic environment, MONPs have
This article is an open access article
                                          been reported to be involved in homo- and hetero-aggregation followed by precipitation or
distributed under the terms and           sedimentation and accumulation [12–15].
conditions of the Creative Commons             Furthermore, in the presence of ligands (Cl– , SO4 2– , NO3– etc.), ENPs may form
Attribution (CC BY) license (https://     complexes and adsorb onto natural organic matter (NOM) [15]. Therefore, the stability of
creativecommons.org/licenses/by/          ENPs in the aquatic ecosystems is influenced by environmental factors and the properties
4.0/).                                    of NPs [16], which in turn will influence their fate and effect on aquatic biota.

Nanomaterials 2021, 11, 1777. https://doi.org/10.3390/nano11071777                                  https://www.mdpi.com/journal/nanomaterials
Nanomaterials 2021, 11, 1777                                                                                             2 of 23

                                     On the other hand, the effect of MONPs in the environment is different to their bulk
                               size or dissolved ion counterparts, because of their high surface-to-volume ratio and surface
                               characteristics, such as the intensified charge and reactivity [17]. In addition, the ecotoxicity
                               of MONPs is also determined by further factors including size, oxidative state, exposure
                               time, particle concentration and the target organism and its habitat [18–21]. As reviewed
                               by Parada et al. [22], there are numerous nano-ecotoxicological studies on the potential
                               toxicity of MONPs involving single species aquatic model organisms, such as daphnids,
                               zebrafish, algae, freshwater bivalve, diatom.
                                     The significance of microbial activity concerning the ecosystem functionality and
                               services is well established, but microbial diversity of natural waters—especially the effect
                               of NPs on the biodiversity and structure of the complex aquatic microbial community—
                               has not been studied extensively. There are some valuable results on this topic based on
                               various approaches focused on rivers [15,23], a stream [13], marine estuarine sediments [24],
                               groundwater [25], and three Swedish lakes [11], nevertheless, the effect of nTiO2 and
                               nZnO on complex aquatic microbial communities needs further investigations and novel
                               approaches, and Biolog EcoPlate™ could be a great tool for this aim.
                                     Battin et al. [13] provided the first evidence that nano-TiO2 significantly impacted nat-
                               ural microbial communities (bacteria stream biofilms) under natural levels of UV radiation
                               and TiO2 concentrations expected in surface waters. To examine the effect of nano-TiO2 on
                               the membrane integrity of planktonic microorganisms and biofilm cells in stream water
                               microcosms, nucleic acid stains and epifluorescence microscopy was used [13].
                                     Farkas et al. [11] conducted the first ecotoxicological study assessing the effect of
                               nTiO2 on bacterial communities in situ, in three lakes, taking into consideration dissolved
                               organic carbon (DOC) concentrations, element concentrations and light regimes. Bacterial
                               growth after the termination of the exposure period was determined as abundance in the
                               water samples analysed by flow cytometry. Their results demonstrated that TiO2 NPs
                               could affect natural lake-water bacterial communities in terms of bacterial abundance and
                               bacterial activity. The study also showed that nTiO2 significantly affected natural lake
                               water bacteria and the effects varied among communities from lakes depending on the
                               chemical parameters of the water.
                                     To study the microbiological impact of zero-valent iron in the remediation of
                               groundwater exposed to a trichloroethylene-degrading anaerobic microbial community
                               Zabetakis et al. [25] monitored the changes in total bacterial and archaeal population
                               numbers using qPCR.
                                     Londono et al. [15] spiked TiO2 at 700 µg/L, ZnO at 70 µg/L either separately or
                               combined to freshly collected river water samples to investigate effects of engineered
                               nanoparticles (ENPs) at environmentally relevant concentrations to aquatic microbial
                               communities. DNA extraction was employed followed by next-generation sequencing to
                               understand the change of microbial distribution responding to the presence of the ENPs
                               in river water samples. Species richness (S) was determined by a genera or species taxa
                               count, while for each treatment the Shannon index (H) for species diversity and species
                               evenness was calculated. Compared to controls where no ENPs were added, the addition
                               of TiO2 NPs alone at the tested concentration had no statistically significant effect on both
                               the bacterial and eukaryotic communities. The presence of added ZnO or ZnO + TiO2 led
                               to significant shift of the microbial community structure and genus distribution. This shift
                               was more obvious for the bacteria than the eukaryotes. Based on results from single particle–
                               inductively coupled plasma–mass spectrometry (SP-ICP-MS), all ENPs aggregated rapidly
                               in water and resulted in much larger particles sizes than the original counterparts. The
                               “dissolved” (including particles smaller than the size detection limits and dissolved ions)
                               concentrations of Ti and Zn also increased in the treatment groups vs. the controls [15].
                                     Most of the conducted studies demonstrated that natural aquatic bacterial communi-
                               ties were more sensitive towards individual MONPs than single strains, due to differences
                               in resistance, highlighting the importance of their investigation [11,15]. Comparing the
                               effect of nTiO2 on complex bacterial communities with the effect on single species in other
Nanomaterials 2021, 11, 1777 3 of 23
studies, Farkas et al. [11] assumed that in complex bacterial communities the sum of effects
on different strains will determine the overall effect on bacterial abundance and productiv-
ity. However, in the case of bacterial communities the factors that are toxic to a subset of
the community might affect negatively the functioning of the overall community, altering
the interaction among the strains [2].
To study microbial diversity in the aquatic environment several biochemical or molec-
ular techniques emerged, as seen in the articles cited above. However, the application of the
Biolog EcoPlate™ for studying the MONPs-mediated influences on microbial diversity in
aquatic systems was demonstrated only in a few studies. In spite of this, Biolog EcoPlate™
is a low-cost, convenient and rapid technique for investigating the physiological diver-
sity in the environment and provides information about community-level physiological
profiles (CLPP).
Christian and Lind [26] explored several aspects of Biolog EcoPlate™ use for fresh-
water bacterial assemblages including inoculum density, incubation temperature, non-
bacterial colour development, and substrate selectivity and proposed a technique to allow
EcoPlate™ use in anaerobic freshwater bacterial studies.
Xie et al. [27] recently explored bacterial diversity, community composition and
metabolic function in Lake Tianmuhu, China, and in its upstream dammed river, us-
ing Illumina MiSeq sequencing and the Biolog EcoPlate™ method to identify the effects of
anthropogenic disturbances, such as pollution discharge and damming on biodiversity.
Even though the above-mentioned studies did apply the Biolog EcoPlate™ method
for soil bacterial community analysis, unfortunately, they did not report on some important
parameters, such as the reagents, sample preparation, incubation time, applied dilutions
and precise formulas for calculations. In addition, these studies usually only evaluated a
few Biolog-derived endpoints (usually just AWCD and AUC, sometimes SR) in terms of
biodiversity and microbial community structure. The majority of the conducted microbial
community studies tested ENPs typically higher than 100 mg/L concentrations, and only
some studies reported above 1 mg/L [15].
The objective of our work was the evaluation of the applicability of the Biolog
EcoPlate™ technique, a promising tool for community-level physiological profiling, in the
investigation of the concentration- and time-dependent effect of MONPs on the biodiversity
and functionality of freshwater microbial communities.
The research was conducted in lab-scale aquatic microcosms including only water
from Lake Balaton as a model for aquatic surface environments.
We hypothesised that: (i) the metallic NPs (nTiO2 and nZnO) added to Balaton water
would alter the activity and community composition of microbes, (ii) the concentration
of NPs as well as the exposure time would influence their effect, (iii) the applicability of
Biolog EcoPlate™ for characterising the effect of metal oxide nanoparticles on freshwater
microbial communities would be demonstrated based on substrate use patterns and that
(iv) the applied Biolog-derived endpoints—characterising both the microbial activity and
diversity—would provide reliable and a wide range of information about the microbial
communities affected by NPs exposure.
2. Materials and Methods
2.1. Freshwater Samples from Lake Balaton
Water samples from Lake Balaton, Révfülöp, Hungary (46◦ 490 36.500 N 17◦ 370 50.500 E)
were collected in sterile bottles and kept at 4 ◦ C for 24 h until the start of the experiments.
For the investigation of the effect of nZnO and nTiO2 the water samples were taken in July
and October 2020, respectively. A 3000 mL freshwater sample was collected in sterile glass
bottles and transported to the lab. The main physico-chemical properties of the freshwater
samples from Lake Balaton collected in July and October are shown in Table 1.Nanomaterials 2021, 11, 1777 4 of 23
Table 1. Characteristics of freshwater samples from Lake Balaton.
Samples from pH (1) EC (2) NO3 (NO2 )-N (3) K+ (4) Na+ (4) Ca2+ (4) Mg2+ (4) Cl- (5) CO3 2- (6) HCO3 - (6) SO4 2- (7)
Lake Balaton - µS/cm mg/L mg/L mg/L mg/L mg/L mg/L mg/L mg/L mg/L
8.3 707 0.22 6.7 36.4 33.9 58.8 38.4 27.9 233.4 134.2
Sample collected in July
±0.2 ±16 ±0.10 ±0.2 ±0.4 ± ±0.1 ±2.6 ±13.2 ±26.8 ±0.2
Sample collected 8.8 664 0.14 7.2 37.4 27.6 60.3 40.3 46.5 211.3 141.5
in October ±0.0 ±20 ±0.00 ±0.6 ±1.3 ±2.7 ±2.1 ±0.0 ±4.4 ±40.1 ±4.6
(1)
Determined by HS 21470-2:981; (2) Determined by HS EN 27888:1988; (3) Determined by ISO 7890-3:1988; (4) Determined by ICP-OES, HS
EN 11885:2005; (5) Determined by EPA 9253:1994; (6) Determined by HS EN ISO 9963-1:1998; (7) Determined by HS 448-13:1983.
2.2. Characteristics of the Tested Nanomaterials
The examined nanoparticles were purchased from the manufacturers: nano zinc
oxide (nZnO) from Sigma-Aldrich Inc. (Budapest, Hungary) (CAS number: 1314-13-2) and
AERODISP® VP Disp. W2370X nano titanium dioxide (nTiO2 ) were purchased from Evonik
Resource Efficiency GmbH (Essen, Germany) (CAS number: 13463-67-7). The particle size
of nZnO was less than 100 nm with an average of ≤40 nm. The mean aggregate size of
nTiO2 was ≤100 nm and the mean particle diameter by mass was 16 nm. Details and
properties on the NPs were provided by the manufacturers. The NPs were sonicated for
15 min before usage.
2.3. Experimental Setup
Two separate series of experiments—with identical experimental setups—were run in
triplicate to assess the effect of nZnO and nTiO2 in 100 mL microcosms. Samples of 45 mL
Balaton water were transferred into sterile, 100 mL volume Schott-bottles. Then each bottle
was completed to 50 mL with the studied NP suspension at different concentrations aiming
to reach 0.8, 4, 20 and 100 mg/L final NP nominal concentration in each microcosm. The
original NP suspensions were diluted with distilled water. Every treatment had 3 replicates.
Distilled water (DW) was the control. The proportion of DW in the control microcosms
was the same as in the NPs-containing microcosms.
During the experiment samples were shaken at 120 rpm and kept in the dark at room
temperature (22 ± 2 ◦ C). For monitoring the effect of NPs, the microcosms were sampled
on the 3rd, 7th, and 14th days.
2.4. Monitoring
2.4.1. Physico-Chemical Methods
The pH and electric conductivity of the freshwater samples from Lake Balaton and
the assembled microcosms were determined with a WTW (Wissenschaftlich Technische
Werkstätten GmbH, Weilheim in Oberbayern, Germany) instrument using a pH 330 Meter
including a precision Sentix 81 pH Electrode on the initial day and the 3rd, 7th, and 14th
days in three parallels. Electric conductivity (EC) was determined with a Consort C535
instrument (Turnhout, Belgium).
2.4.2. Microbiological Methods
The enzymatic activity of viable cells [28,29] was measured by a tetrazolium reduction
viability assay with ELISA Microplate Reader (Vienna, Austria) for assessing metabolic
activity. Three 200 µL samples were introduced into the wells of a sterile microplate and
the OD was measured at 630 nm.
Then 30 µL of 1 mg/mL 3-(4,5-dimethylthiazol 2-yl)-2,5-diphenyltetrazolium bromide
(MTT) was transferred into every well, and the plate was incubated for 15 min in the dark
at room temperature.
The absorbance was measured at 490 nm with DIALAB EL800 Microplate Reader. The
inhibition percentage (I%) compared to control was calculated based on the absorbance
values with the following Equation:
C−S
I% = ·100, (1)
CNanomaterials 2021, 11, 1777 5 of 23
where C is the absorbance of the control and S is the absorbance of the NP contain-
ing sample [30].
2.4.3. Biolog EcoPlate™
The Biolog EcoPlate™ test method [31] was applied to monitor the effect of zinc oxide
and titanium dioxide nanoparticles on the microbial communities, and how they influence
their substrate use (community-level physiological profiling, CLPP).
The EcoPlate™ includes three replicate wells containing 31 organic carbon substrates
and a control well with redox-sensitive tetrazolium dye, but no substrate, for community-
level physiological profiling (CLPP) of metabolically active heterotrophic bacterial assem-
blages able to grow in plate conditions [32]. Biolog-derived data for evaluation from CLPP
include: the average well colour development (AWCD) and the Shannon diversity index
(H) [32–34]. AWCD shows the general potential metabolic activity of the microbial com-
munity, thus it indicates the total bioactivity of the Biolog EcoPlate™ [33]. The Shannon
diversity index (H) informs on the physiological diversity of bacterial communities [33].
Higher values of H indicate metabolically active microbial communities able to degrade
more substrates [34]. Additional Biolog EcoPlate™-derived parameters include substrate
richness (SR) and Shannon evenness (E) [35].
Although the Biolog EcoPlate™ methodology does not inform about the genetic com-
position of the microbial community, it provides valuable insight into bacterial substrate
use patterns and metabolic functional potential in environmental matrices affected by
stressing factors, such as contamination. In addition, it could be applied as a monitoring
method, since it is rapid, low cost, reproducible and simple.
Therefore, this study aims to provide evidence to the applicability of the Biolog
EcoPlate™ technique for the characterisation of the microbial activity and biodiversity
of nTiO2 - and nZnO-impacted freshwaters. We compared several endpoints, primarily
those associated with the effects on biodiversity and microbial community structure. The
conventional endpoints, such the AWCD, the substrate richness (SR), the area under the
curve (AUC) and substrate average well colour development (SAWCD) were analysed, but
microbial diversity and its changes triggered by stress factors were in focus. The endpoints
studied and compared in terms of microbial diversity included: Shannon diversity index,
Shannon evenness index, Simpson index, McIntosh index and Gini coefficient.
Measurements were carried out by pipetting 125 µL samples into each well of the
EcoPlate. Plates were incubated in the dark at 25 ◦ C, and the absorbance of the wells
was measured every 24 h for 120 h at 490 nm wavelength by DIALAB EL800 Microplate
Reader. Although the Biolog EcoPlate™ method usually measures optical density (OD) at
590 nm, because the highest absorbance of the tetrazolium dye could be measured at this
wavelength [31,34,36], our microplate reader was equipped with 405, 450, 490 and 630 nm
filters, and the optimal OD values were provided at 490 nm [37,38].
Because the 96 wells of the Biolog EcoPlate™ contain 31 carbon sources and control
wells (blank) in 3 replicates, all measurements were done 3 times, 1–1 series from the
3 replicates of the experimental setup.
The measured absorbance values were corrected before evaluation. Firstly, the OD
values of the control wells (which contain water to read the clear absorption value) were
subtracted from the substrate containing wells’ OD values. Next, the initial OD value
of each well, measured immediately after pipetting the suspension into the wells, was
subtracted from each OD value corrected in the previous step. The aim was to eliminate
the background effect (the effect of nanoparticles on the optical density values). OD values
measured at 120 h were used for data evaluation because these indicated the optimal
range of OD readings [35,37,39]. Different endpoints were calculated from the corrected
data including average well colour development (AWCD), substrate average well colour
development (SAWCD), substrate richness (SR), Shannon index (H), Shannon evenness (E),
Simpson index (D), McIntosh index (U), and Gini coefficient (G).Nanomaterials 2021, 11, 1777 6 of 23
Average well colour development (AWCD) was computed by the following equation
for all carbon sources:
∑N ODi
AWCD = i=1 (2)
N
where ODi is the corrected OD value of each substrate-containing well, while N is the
number of substrates, which in this case is N = 31 [35,38]. For further investigation of the
AWCD, all carbon substrates were classified into six categories based on their characteris-
tics according to Sala et al. [40]: polymers (alpha-cyclodextrin, glycogen, Tween 40, Tween
80), carbohydrates (D-cellobiose, i-erythritol, D-galactonic acid-gamma-lactone, N-acetyl-
D-glucosamine, glucose-1-phosphate, beta-methyl-D-glucoside, D,L-alpha-glycerol phos-
phate, alpha-D-lactose, D-mannitol, D-xylose), carboxylic acids (gamma-hydroxybutyric
acid, alpha-ketobutyric acid, D-galacturonic acid, D-glucosaminic acid, itaconic acid, D-
malic acid, pyruvic acid methyl ester), amino acids (L-arginine, L-asparagine, glycyl-L-
glutamic acid, L-phenylalanine, L-serine, L-threonine), amines (phenylethylamine, pu-
trescine), and phenolic compounds (2-hydroxybenzoic acid, 4-hydroxybenzoic acid). For
every substrate category the substrate average well colour development (SAWCD) value
was calculated by the following equation:
∑N
i=1 ODi
SAWCD = , (3)
N
where ODi is the corrected OD value of the substrates within the substrate category and N
is the number of substrates in the category [33].
Substrate richness (SR) is the number of oxidised substrates. It was computed as the
total of the cells’ ODi value which was at least 0.5 after 120 h incubation [41].
The area under the curve (AUC) was computed by the following equation [42]:
N n ODin + ODin+1
AUC = ∑ i=1 ∑ j=1 2 · tin+1 − tin
, (4)
where N is the number of substrates, n is the number of measurements, ODi is the corrected
OD value of each individual well, at two consecutive measurements at two different
measurement times for tn and tn + 1 .
Shannon index (H) was calculated according to the following equation:
N
H = − ∑ Pi · ln Pi (5)
i=1
where N is the number of substrates, Pi is the relative colour development of the well over
the total colour development of each well of a plate [34,43,44].
ODi
Pi = N
(6)
∑i=1 ODi
Shannon evenness (E) was derived from the Shannon index by its partition based on
the substrate richness according to Jałowieczki et al. [42]:
H
E= , (7)
ln(SR)
where H is the computed Shannon index, while SR is the calculated substrate richness.
Simpson index (D) was computed by the following equation:
N
D = − ln ∑i=1 (Pi )2 , (8)
where Pi and N are the same as in the Shannon index calculation [45].Nanomaterials 2021, 11, 1777 7 of 23
McIntosh index (U) was calculated according to Manjunath et al. [46]:
q
N
U= ∑i=1 (ODi )2 , (9)
where N is the number of substrates, ODi , is the corrected OD value of each substrate
containing well.
Gini coefficient (G) was calculated by the following equation:
∑N N
i=1 ∑j=1 ODi − ODj
G= (10)
2N2 · (AWCD)
where N is the number of substrates, OD is the corrected OD value of each well, AWCD is
the computed AWCD value as described previously [32].
2.4.4. Statistical Analysis of Data
Data were submitted to analysis of variance (ANOVA) using StatSoft® Statistica 13.1
(TIBCO Software, Inc., Palo Alto, CA, USA) to calculate if the effect of a treatment was
significant. For this purpose, two types of statistical analyses were done, depending on
the examination.
To investigate the significant differences with respect to enzymatic activity determined
by MTT, one-way ANOVA was used. To verify the criteria for the homogeneity of variances
Cochran’s C test was applied.
Repeated measures ANOVA (RMANOVA) was used to investigate the significant
effects of the nZnO and nTiO2 treatments with Biolog EcoPlate™ tests. The Mauchley
sphericity test was applied to confirm the criteria.
Both types of statistical analyses were performed at the p < 0.05 significance level.
Fisher’s Least Significant Difference (LSD) was used for comparison of the effects of
the various treatments. The significant effects are marked with letters on all figures in
alphabetical order, where “a” is the smallest average value. Columns signed with the same
letter indicate that there was no significant difference between them.
All measured microcosm data were subject to Pearson correlation analysis for detecting
any coherence between the concentration of the applied NPs and diversity indices.
3. Results
3.1. Physico-Chemical Characteristics of Lake Balaton
The pH and electrical conductivity of the water samples did not change significantly
compared to control after 14 days. In the case of the nTiO2 experimental series, the pH was
8.69 ± 0.03 and the EC was 632.0 ± 9.5 µS, while in the nZnO experimental series the pH
was 8.97 ± 0.12 and the EC was 693.8 ± 32.9 µS after 14 days.
3.2. Effect of TiO2 and ZnO Nanoparticles on Enzymatic Activity
The results of the enzymatic activity test based on the tetrazolium reduction viability
assay presented low sensitivity (data not shown).
TiO2 NPs triggered no significant inhibition (Nanomaterials 2021, 11, 1777 8 of 23
while 0.8 mg/L nZnO the smallest (11–58%). However, the lowest nZnO concentration
(0.8 mg/L) resulted in a significant decrease compared to the control in the short term
(after 3 days). nZnO had significant impact at 4, 20 and 100 mg/L nZnO concentrations
after 14 days. Correlation analysis (Table S1) indicated strong linear negative association
between ZnO NP concentration and AWCD at each sampling time (r = −0.99).
Nanomaterials 2021, 11, x FOR PEER REVIEW 8 of 25
Table 2. RMANOVA results over time to evaluate effects of nZnO treatment on the freshwater microbial diversity. Bold
numbers indicate significant differences at p < 0.05.
The results of the enzymatic activity test based on the tetrazolium reduction viability
Source of Variation d.f. Mean Square F Ratio p-Value Source of Variation p-Value
assay presented low sensitivity (data not shown). d.f. Mean Square F Ratio
AWCD SR
TiO2 NPs triggered no significant inhibition (The area under the curve (AUC) had a similar trend to AWCD (Figure 2), but in this
case the interaction of treatment and time also had a significant effect, similarly to the
separate effect of time and treatment (Table 2). There was a decreasing trend in the de-
tected AUC values at the same concentration on different sampling days, except for the
Nanomaterials 2021, 11, 1777
100 mg/L nZnO concentration, which showed a slight growth. However, the increasing9 of 23
nZnO amount significantly reduced the AUC values (Figure 2). The nZnO concentrations
of 4 mg/L and above exhibited significant difference compared to control at each meas-
urement time. The results of the correlation analysis (Table S1) showed that the AUC val-
AUC values negatively correlated (r = −0.98–1.00) with the nZnO concentration after 3, 7
ues negatively correlated (r = −0.98–1.00) with the nZnO concentration after 3, 7 and 14
and 14 days of exposure (p < 0.05).
days of exposure (p < 0.05).
AUC
3
2.5
g g
2 f
f f
e
AUC [-]
e e
1.5
d
1
0.5 c bc
ab a ab a
0
Control 0.8 4 20 100
Start 3 days 7 days 14 days
nZnO concentration [mg/L]
Figure
Figure 2. The
2. The effect
effect of of
ZnOZnOnanoparticles
nanoparticles onon freshwater
freshwaterarea under
area thethe
under curve value.
curve LettersLetters
value. on the on
columns indicate sig-
the columns indicate
nificant differences (level of significance: p < 0.05).
significant differences (level of significance: p < 0.05).
The effect on substrate richness (SR) was similar to that on the AUC values
The effect on substrate richness (SR) was similar to that on the AUC values (Figure 3).
(Figure 3). The high nZnO concentrations significantly decreased the usage of many sub-
The high nZnO concentrations significantly decreased the usage of many substrates. A
strates. A concentration of 100 mg/L nZnO resulted in no detectable substrate use on the
concentration of 100 mg/L nZnO resulted in no detectable substrate use on the 3rd and 7th
3rd and 7th day of the experiment, while on the 14th day a colour change occurred in one
day of the experiment, while on the 14th day a colour change occurred in one substrate
substrate (pyruvic acid methyl ester), which was consistent with the results of AUC. Time,
(pyruvic
treatmentacidand
methyl
theirester), which was
interaction had consistent
significant with
effecttheonresults of AUC.
the SR valuesTime,
basedtreatment
on
and their interaction had significant effect on the SR values based on RMANOVA
RMANOVA analysis (Table 2). The correlation analysis (Table S1) showed strong and analysis
(Table 2). correlation
negative The correlation
between analysis (Table
the nZnO S1) showed
concentration andstrong and negative
the SR values correlation
(r = −0.97–0.99)
between
Nanomaterials 2021, 11, x FOR PEER REVIEW the nZnO concentration and the
after 3, 7 and 14 days of exposure (p < 0.05). SR values (r = − 0.97–0.99) after 3, 7 and 1425days
10 of
of exposure (p < 0.05).
30
Substrate richness
25
Number of substrates [pc]
i i
20
gh h egh
e efefg
15 d
10
5 b c b
a a a
0
Control 0.8 4 20 100
Start 3 days 7 days 14 days
nZnO concentration [mg/L]
Figure
Figure 3. effect
3. The The effect of ZnO
of ZnO nanoparticles
nanoparticles on on freshwater
freshwater substraterichness
substrate richnessvalue.
value.Letters
Letters on
on the
the columns
columnsindicate
indicatesignifi-
significant
cant differences (level of significance: p < 0.05).
differences (level of significance: p < 0.05).
According to our results, Shannon index (H) had similar structure to the AWCD,
AUC and SR pattern, although it seemed to be less sensitive at low concentrations, and it
had a peak value at 20 mg/L nZnO concentration.
On the other hand, the difference between the H values at 20 and 100 mg/L nZnO0
Control 0.8 4 20 100
Start 3 days 7 days 14 days
nZnO concentration [mg/L]
Nanomaterials 2021, 11, 1777 10 of 23
Figure 3. The effect of ZnO nanoparticles on freshwater substrate richness value. Letters on the columns indicate signifi-
cant differences (level of significance: p < 0.05).
According to to our
ourresults,
results,Shannon
Shannon index
index (H)(H)
hadhad
similar structure
similar to thetoAWCD,
structure AUC
the AWCD,
and SR pattern, although it seemed to be less sensitive at low concentrations,
AUC and SR pattern, although it seemed to be less sensitive at low concentrations, and it and it had a
peak value at 20 mg/L nZnO concentration.
had a peak value at 20 mg/L nZnO concentration.
On the
On the other
other hand,
hand, the
the difference
difference between
between the the H
H values
values atat 20
20 and
and 100
100mg/L
mg/L nZnO
nZnO
was not as high as in case of the previous endpoints (AWCD, AUC
was not as high as in case of the previous endpoints (AWCD, AUC and SR) at these and SR) at these
con-
concentrations.
centrations. In addition,
In addition, the Hthe H values
values at 20 at
and20100
andmg/L
100 mg/L
nZnO nZnO were significantly
were significantly lower
lowerinthan
than caseinofcase of lower
lower nZnOnZnO concentrations
concentrations (Figure(Figure 4). RMANOVA
4). RMANOVA demonstrated
demonstrated the
the sig-
significant effect of time, treatment and their interaction
nificant effect of time, treatment and their interaction (Table 2).(Table 2).
Shannon index
3.5 hifghi ghighi h fghi
fgi ef efg e
3
c d
2.5 cd
Shannon index [-]
b a
2
1.5
1
0.5
0
Control 0.8 4 20 100
Start 3 days 7 days 14 days
nZnO concentration [mg/L]
Figure 4.
Figure 4. The
The effect of ZnO
effect of ZnO nanoparticles
nanoparticles onon freshwater
freshwater Shannon
Shannon index
index value.
value. Letters
Letters on
on the
the columns
columns indicate
indicate significant
significant
differences (level of significance: p < 0.05).
differences (level of significance: p < 0.05).
The correlation analysis (Table S1) displayed a strong significant correlation between the
nZnO concentration and the H values (r = −0.99) only after 3 and 14 days exposure (p < 0.05).
Shannon evenness (E), derived from the Shannon index (H), did not show any signifi-
cant effects compared to the control at the smallest applied nZnO concentrations (0.8 and
4 mg/L). However, the E value at 20 mg/L nZnO concentration indicated significant effect
(Figure 5). The relevant Equation (7) and the involved SR values for the calculation of E
did not result any E values at 100 mg/L nZnO. According to the RMANOVA statistical
analysis, only the treatment with ZnO nanoparticles had significant effect (Table 2). The
Pearson correlation analysis (Table S1) displayed significant strong correlation between the
nZnO concentration and the E values but only after 7 and 14 days of exposure (r = −0.723
and −0.614 at p < 0.05, respectively).
Based on the Simpson index (D), similarly to the Shannon evenness, ZnO nanopar-
ticles at 0.8 and 4 mg/L concentration had no significant effect compared to the control
(Figure 6). The detectable significant effect occurred only at 20 and 100 mg/L concentra-
tions; the highest decrease (18%) occurred at 100 mg/L nZnO concentration after 14 days.
Although the highest tested concentration caused significant decrease compared to control
at each sampling time, RMANOVA analysis illustrated that the time, treatment and their
interaction had a significant effect on the Simpson index values (Table 2). Correlation
analysis with coefficients r = −0.641 (3rd day), −0.887 (7th day) and −0.849 (14th day)
illustrated significant linear negative relationship between the concentration and Simpson
index (Table S1).and 4 mg/L). However, the E value at 20 mg/L nZnO concentration indicated significant
effect (Figure 5). The relevant Equation (7) and the involved SR values for the calculation
of E did not result any E values at 100 mg/L nZnO. According to the RMANOVA statistical
analysis, only the treatment with ZnO nanoparticles had significant effect (Table 2). The
Nanomaterials 2021, 11, 1777 Pearson correlation analysis (Table S1) displayed significant strong correlation between
11 of 23
the nZnO concentration and the E values but only after 7 and 14 days of exposure (r =
−0.723 and −0.614 at p < 0.05, respectively).
Shannon evenness
3.5
3 d
2.5 c c
Shannon evenness [-]
2
1.5 b b b
b b b b b b
1
0.5
a a a
0
Control 0.8 4 20 100
Start 3 days 7 days 14 days
nZnO concentration [mg/L]
Figure 2021,
Nanomaterials 5. The effect
11,effect
x FORofPEER
of ZnOREVIEW
ZnO nanoparticleson
nanoparticles onfreshwater
freshwaterShannon
Shannon evenness
evenness value.
value. Letters
Letters onon
thethe columns
columns indicate
indicate signifi-
12 of 25
significant
cant differences
differences (level(level of significance:
of significance: p < 0.05).
p < 0.05).
Based on the Simpson index (D), similarly to the Shannon evenness, ZnO nanoparti-
cles at 0.8 and 4 mg/L Simpson
concentration
indexhad no significant effect compared to the control
(Figure 6). The detectable significant effect occurred only at 20 and 100 mg/L concentra-
1 e e ethe highest edecrease
e e e e e at 100 mg/L de
tions; (18%) occurred c cd after 14 days.
c nZnO concentration
0.9 Although the highest tested concentration caused significantb decrease compared to con-
a
0.8 trol at each sampling time, RMANOVA analysis illustrated that the time, treatment and
0.7 their interaction had a significant effect on the Simpson index values (Table 2). Correlation
Simpson index [-]
0.6 analysis with coefficients r = −0.641 (3rd day), −0.887 (7th day) and −0.849 (14th day) illus-
trated significant linear negative relationship between the concentration and Simpson in-
0.5
dex (Table S1).
0.4
0.3
0.2
0.1
0
Control 0.8 4 20 100
Start 3 days 7 days 14 days
nZnO concentration [mg/L]
Figure 6.
Figure 6. The
The effect
effect of
of ZnO
ZnO nanoparticles
nanoparticles on on freshwater
freshwater Simpson
Simpson index
index value.
value. Letters
Letters on
on the
the columns
columns indicate
indicate significant
significant
differences (level of significance: p < 0.05).
differences (level of significance: p < 0.05).
McIntosh
McIntosh index
index(U)(U)was
wasthe
themost
mostsensitive
sensitivediversity
diversityindex
indexforfor
indicating
indicating thethe
effect of
effect
ZnO nanoparticles
of ZnO on microbial
nanoparticles community
on microbial communityaccording to Figure
according 7. Generally,
to Figure the U values
7. Generally, the U
decreased with thewith
values decreased increase of the applied
the increase nZnO concentrations
of the applied and theand
nZnO concentrations elapsed time of
the elapsed
the
timeexperiment. 20 mg/L20
of the experiment. nZnO
mg/L concentration decreased
nZnO concentration the McIntosh
decreased index byindex
the McIntosh 74–76%by
74–76% compared
compared to the non-treated
to the non-treated control,
control, while 100while
mg/L 100
nZnO mg/L nZnO
resulted inresulted in 90–92%
90–92% reduction.
reduction.
The RMANOVA The RMANOVA clearly illustrated
clearly illustrated the very
the very strong strong significant
significant effect 0.000)
effect (p value (p value
of
0.000) of treatment
treatment and time, and
and time, and even
even their their interaction
interaction (Table 2.). Correlation
(Table 2.). Correlation analysis with analysis
coeffi-
with coefficients
cients r=−
r = −0.835 (3rd 0.835−0.838
day), (3rd day), −0.838
(7th day) and(7th
−0.806 and −
day)(14th 0.806
day) (14th day)
illustrated illustrated
strong linear
strong linear negative relationship between the concentration and Simpson
negative relationship between the concentration and Simpson index, which was signifi- index, which
was significant
cant at p < 0.05
at p < 0.05 (Table S1). (Table S1).
McIntosh index
7the experiment. 20 mg/L nZnO concentration decreased the McIntosh index by 74–76%
compared to the non-treated control, while 100 mg/L nZnO resulted in 90–92% reduction.
The RMANOVA clearly illustrated the very strong significant effect (p value 0.000) of
treatment and time, and even their interaction (Table 2.). Correlation analysis with coeffi-
Nanomaterials 2021, 11, 1777 cients r = −0.835 (3rd day), −0.838 (7th day) and −0.806 (14th day) illustrated strong 12
linear
of 23
negative relationship between the concentration and Simpson index, which was signifi-
cant at p < 0.05 (Table S1).
McIntosh index
7
g
6 g fg
efg efg
def d de
5
McIntosh index [-]
c
4
3
2 b b b
1 a a a
0
Control 0.8 4 20 100
Start 3 days 7 days 14 days
nZnO concentration [mg/L]
Nanomaterials 2021, 11, x FOR PEER REVIEW 13 of 25
Figure 7.
Figure 7. The
The effect
effect of
of ZnO
ZnO nanoparticles
nanoparticles onon freshwater McIntosh index
freshwater McIntosh index value.
value. Letters
Letters on
on the
the columns
columns indicate
indicate significant
significant
differences (level of significance: p < 0.05).
differences (level of significance: p < 0.05).
The Gini index (G) increased with the applied nZnO concentration (Figure 8). Low
The Gini
Gini index index
values (G) increased
indicated with of
high levels thefunctional
applied nZnO concentration
diversity (Figure
[47]. Gini index 8). Low
illustrated
Gini index values indicated high levels of functional diversity [47]. Gini index
significant effects only at higher nZnO concentrations (20; 100 mg/L). Highest increase illustrated
significant
(493%) effects only
compared at higher
to control nZnO concentrations
occurred at 100 mg/L (20; 100 mg/L).after
concentration Highest increase
7 days. (493%)
Statistical
compared
analysis to control
showed thatoccurred at 100
not just the mg/L concentration
treatment, after 7 days. Statistical
but also the treatment-time interaction analysis
had a
showed that
significant not just
effect the 2).
(Table treatment, but also
Correlation the treatment-time
analysis interaction
(r = 0.824–0.903) revealedhad a significant
strong positive
effect (Table 2).
relationship Correlation
between analysis (r = and
the concentration 0.824–0.903) revealed
Gini index, whichstrong positive relationship
was significant at p < 0.05
between the
(Table S1). concentration and Gini index, which was significant at p < 0.05 (Table S1).
Gini index
3.5
e
3
2.5 d
d
Gini index [-]
2
1.5 c
bc
1
a a ab ab
a a a a a a
0.5
0
Control 0.8 4 20 100
Start 3 days 7 days 14 days
nZnO concentration [mg/L]
Figure 8.
Figure 8. The
Theeffect
effectofofZnO
ZnOnanoparticles
nanoparticlesononfreshwater Gini
freshwater index
Gini value.
index Letters
value. on the
Letters columns
on the indicate
columns significant
indicate dif-
significant
ferences (level of significance: p < 0.05).
differences (level of significance: p < 0.05).
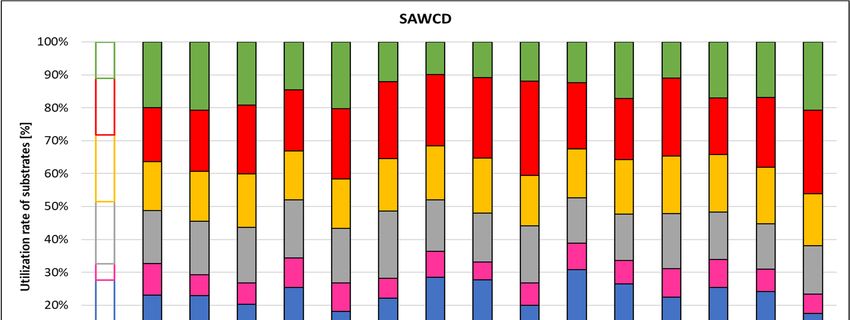
The microbial metabolic pathways were also influenced by the ZnO nanoparticles, as
confirmed by the substrate average well colour development values. The use ratio of each
substrate category was illustrated in Figure 9, considering that total use of the six different
substrate groups was 100%. The SAWCD ratio by substrate groups was highly influenced
by nZnO concentration. The metabolism of polymers decreased with the elapsed days andNanomaterials 2021, 11, 1777 13 of 23
The microbial metabolic pathways were also influenced by the ZnO nanoparticles, as
confirmed by the substrate average well colour development values. The use ratio of each
substrate category was illustrated in Figure 9, considering that total use of the six different
substrate groups was 100%. The SAWCD ratio by substrate groups was highly influenced
by nZnO concentration. The metabolism of polymers decreased with the elapsed days and
Nanomaterials 2021, 11, x FOR PEER REVIEW 14 of 25
the applied nZnO concentration, although, at 100 mg/L nZnO concentration the ratio of
the total substrate use increased.
Figure
Figure 9.
9. The
The effect
effect of
of ZnO
ZnO nanoparticles
nanoparticles on
on freshwater
freshwater substrate
substrate average well colour
average well colour development
development value.
value.
Use
Use of amines had a similar pattern. pattern. At 20
20 mg/L
mg/L nZnO
nZnO dose the amine metabolism
decreased, similarly to the phenolic compounds. On thethe
decreased, similarly to the phenolic compounds. On other
other hand,hand,
the the
use use
ratioratio of
of car-
carboxylic
boxylic acids
acids increased
increased withwith the applied
the applied nZnO nZnO concentration,
concentration, suggesting
suggesting thatofuse
that use of
these
these substrates
substrates was not was not influenced
influenced by ZnOby ZnO nanoparticles,
nanoparticles, or it wasorintensified
it was intensified by the
by the changed
changed environmental
environmental parameters. parameters.
According to
According tothetheresults,
results,the
theuseuse of each
of each substrate
substrate group group
was was influenced
influenced by thebypres-
the
presence of nZnO especially at 20 and 100 mg/L
ence of nZnO especially at 20 and 100 mg/L concentrations. concentrations.
Although carbohydrates
Although carbohydrateswere werethethemost
mostrepresented
representedsubstrate
substrateclass inin
class Biolog EcoPlate™,
Biolog EcoPlat-
they were the least used (0–14.5%)—while polymers (15–43%) and
e , they were the least used (0–14.5%)—while polymers (15–43%) and carboxylic
TM carboxylic acids (15–56%)
acids
had the highest
(15–56%) had thecontribution to CLPP. to CLPP.
highest contribution
3.4. Effect
3.4. Effect of
of TiO
TiO22 Nanoparticles
Nanoparticles on
on the
the Community-Level
Community-Level Physiological
Physiological Profiles
Profiles (CLPP)
(CLPP)
The average well colour development (AWCD) values usually showed a slight decline
The average well colour development (AWCD) values usually showed a slight de-
from the start to the end of the experiment (Figure 10) such as AUC values (Figure S1).
cline from the start to the end of the experiment (Figure 10) such as AUC values (Figure
The highest decrease (15%) was measured at 20 mg/L nTiO2 concentration after 7 days. A
S1). The highest decrease (15%) was measured at 20 mg/L nTiO 2 concentration after 7 days.
concentration of 100 mg/L nTiO2 resulted in 9% decrease compared to control after 14 days.
A concentration of 100 mg/L nTiO 2 resulted in 9% decrease compared to control after 14
However, the extent of the decrease was low. The RMANOVA analysis demonstrated that
days. However, the extent of the decrease was low. The RMANOVA analysis demon-
nTiO2 treatment and time as well as their interactions had significant effect on the AWCD
strated that nTiO2 treatment and time as well as their interactions had significant effect on
(Table 3). The most significant changes were after 1 week, with significant differences
the AWCD (Table 3). The most significant changes were after 1 week, with significant
between the AWCD values in the control and the nTiO2 microcosms mainly at higher
differences between the AWCD values in the control and the nTiO2 microcosms mainly at
concentrations (4–100 mg/L). However, after 2 weeks, nTiO2 displayed no significant
higher concentrations (4–100 mg/L). However, after 2 weeks, nTiO2 displayed no signifi-
cant effect. Correlation analysis did not show a clear correspondence between concentra-
tion and AWCD (Table S2).Nanomaterials 2021, 11, 1777 14 of 23
Nanomaterials 2021, 11, x FOR PEER REVIEW
effect. Correlation 15 of 25
analysis did not show a clear correspondence between concentration
and AWCD (Table S2).
AWCD
1 g
fg
0.9
e e ef ef
0.8 cde ab de bde
abcd abc abcd
0.7 ac abc
0.6
AWCD [-]
0.5
0.4
0.3
0.2
0.1
0
Control 0.8 4 20 100
Start 3 days 7 days 14 days
nTiO2 concentration [mg/L]
Figure 10.
Figure 10. The
The effect
effectof
ofTiO
TiO 2 nanoparticles on the freshwater average well colour development value. Letters on the col-
2 nanoparticles on the freshwater average well colour development value. Letters on the columns
umns indicate significant differences (level
indicate significant differences (level of of significance:
significance: p < 0.05).
p < 0.05).
Table 3.
Table 3. RMANOVA
RMANOVA results
results over
over time
time to
to evaluate
evaluate effects
effects of
of nTiO treatment on
nTiO2 treatment on the
the freshwater
freshwater microbial
microbial diversity.
diversity. Bold
Bold
2
numbers indicate significant differences at p < 0.05.
numbers indicate significant differences at p < 0.05.
Mean Mean
Sourceof
Source of Variation
Variation d.f.
d.f. Mean Square F Ratio p-ValueSource
F Ratiop-Value Source of Variation
of Variation d.f.
d.f. Mean Square F Ratio
F Ratio p-Value
p-Value
Square Square
AWCD SR
AWCD
Treatment 4 0.01 7.01 0.028 SR
Treatment 4 5.67 4.166 0.059
Treatment
Time 24 0.01
0.04 7.0152.87 0.028
0.000 Treatment
Time 42 5.67
21.30 4.166
26.438 0.059
0.000
Time × Treatment
Time 82 0.00
0.04 52.874.49 0.015
0.000 Time × Treatment
Time 28 5.14
21.30 6.381
26.438 0.002
0.000
AUC H
Time × Treatment 8 0.00 4.49 0.015 Time × Treatment 8 5.14 6.381 0.002
Treatment 4 0.25 35.38 0.000 Treatment 4 0.01 6.4 0.034
AUC
Time 2 0.24 53.20 0.000 HTime 2 0.05 40.9 0.000
Treatment
Time × Treatment 84 0.25
0.04 35.389.60 0.000
0.000 Treatment
Time × Treatment 48 0.01
0.00 6.42.1 0.034
0.132
SourceTime
of variation 2
d.f. 0.24
Mean square 53.20
F ratio 0.000
p-value Time
Source of variation 2
d.f. 0.05
Mean square 40.9
F ratio 0.000
p-value
Time × Treatment
E
8 0.04 9.60 0.000 Time × Treatment
U
8 0.00 2.1 0.132
Treatment 4 Mean
0.00 5.4 0.046 Treatment 4 Mean
0.34 6.80 0.030
Source of variation d.f. F ratio p-value Source of variation d.f. F ratio p-value
Time 2 0.00
square 2.7 0.114 Time 2 1.26
square 107.30 0.000
Time × Treatment 8 0.00 4.3 0.018 Time × Treatment 8 0.10 8.75 0.001
E U
D G
Treatment
Treatment 44 0.00
0.00 5.4 2 0.046
0.239 Treatment
Treatment 44 0.34
0.01 6.80
7.426 0.030
0.025
Time
Time 22 0.00
0.00 2.7 46 0.114
0.000 Time
Time 22 1.26
0.03 107.30
122.266 0.000
0.000
Time ××Treatment
Time Treatment 88 0.00
0.00 4.3 2 0.103 Time
0.018 Time × Treatment
× Treatment 88 0.00
0.10 4.887
8.75 0.011
0.001
D
AWCD—the G SR—the substrate richness, H—Shannon diversity index,
average well colour development, AUC—the area under the curve,
E—Shannon
Treatment evenness 4index, D—Simpson
0.00 index,
2 U—McIntosh
0.239 index, G—Gini coefficient.
Treatment 4 0.01 7.426 0.025
Time 2 0.00 46 0.000 Time 2 0.03 122.266 0.000
The evolution of the substrate number (SR) values function of concentration had
Time × Treatment 8 0.00 2 0.103 Time × Treatment 8 0.00 4.887 0.011
different trends at each sampling time (Figure 11). At up to 20 mg/L nTiO2 concentration
AWCD—the average well colour development, AUC—the area under the curve, SR—the substrate richness, H—Shannon
it decreased continuously after 3 days; however, at 100 mg/L concentration, there was no
diversity index, E—Shannon evenness index, D—Simpson index, U—McIntosh index, G—Gini coefficient.
significant change compared to control. A small increase was encountered proportionally
with The
the concentration after
evolution of the both 7 number
substrate and 14 days
(SR)of exposure.
values Theof
function largest difference
concentration (~19%
had dif-
inhibition)
ferent trendsversus thesampling
at each control occurred at 2011).
time (Figure mg/LAt concentration
up to 20 mg/Llevel,
nTiOafter 3 days. The
2 concentration it
RMANOVA
decreased (Table 3) demonstrated
continuously after 3 days;that the treatment
however, did not
at 100 mg/L influence thethere
concentration, evolution of
was no
substrate number; but the effect of time and the interactive effects of time ×
significant change compared to control. A small increase was encountered proportionallytreatment
with the concentration after both 7 and 14 days of exposure. The largest difference (~19%
inhibition) versus the control occurred at 20 mg/L concentration level, after 3 days. The
RMANOVA (Table 3) demonstrated that the treatment did not influence the evolution ofNanomaterials 2021, 11, x FOR PEER REVIEW 16 of 25
Nanomaterials 2021, 11, x FOR PEER REVIEW 16 of 25
Nanomaterials 2021, 11, 1777 15 of 23
substrate number; but the effect of time and the interactive effects of time × treatment were
significant on SR. Correlation
substrate number; but the effectanalysis showed
of time and strong positive
the interactive correlation
effects of between
time × treatment con-
were
were significant
centration and SR on
(r SR.
= Correlation
0.850) after 2 analysis
weeks ofshowed strong
exposure positive
(Table S2). correlation
significant on SR. Correlation analysis showed strong positive correlation between con- between
concentration
centration andand SR= (r
SR (r = 0.850)
0.850) afterafter 2 weeks
2 weeks of exposure
of exposure (Table
(Table S2).S2).
Substrate richness
25 Substrate richness
25 g ef
g def cef fg
ef bcdef
Number of substrates [pc]
20 bcdef cef
def cef fg bcdef
Number of substrates [pc]
20 abc bcdef bcde cef
abd
ab
abc
ab a
bcde
a abd abab
15 a a
15
10
10
55
00
Control
Control 0.8
0.8 44 20
20 100100
Start 3 days 7 days 1414
Start 3 days 7 days days
days
nTiO
nTiO22 concentration [mg/L]
concentration [mg/L]
Figure 11.11.
Figure
Figure The
11. effect
The
The ofof
effect
effect TiO
of TiO
TiO2 nanoparticles
2 nanoparticleson
onfreshwater
freshwater substrate richnessvalue.
substrate richness value.Letters
Lettersononthe
the columns
columns indicate
indicate signifi-
signifi-
2 nanoparticles on freshwater substrate richness value. Letters on the columns indicate significant
cant differences
cant (level
differences of
(level significance:
of p
significance: pNanomaterials 2021, 11, 1777 16 of 23
Nanomaterials 2021, 11, x FOR PEER REVIEW 17 of 25
The highest alteration (less than 5%) compared to
The to control
control occurred
occurred atat44mg/L
mg/L nTiO
nTiO22
after 7 days. Based
after Based onon the RMANOVA results, TiO TiO22 nanoparticles (treatment) and time
had significant
had significant effects on the Shannon
Shannon index
index (Table
(Table 3). Pearson
Pearson correlation
correlation coefficients did
not indicate significant correlation between variables in this case
not indicate significant correlation between variables in this case (Table (Table S2),
S2), but
but Shannon
Shannon
evenness (Figure S2) had significant correlation after 14 days exposure
evenness (Figure S2) had significant correlation after 14 days exposure (Table S2). (Table S2).
The McIntosh
The McIntosh index
index (Figure
(Figure 13)
13) showed
showed higher
higher differences
differences both
both in
in time
time and
and as
as aa func-
func-
tion of
tion of nanomaterial
nanomaterial concentration
concentration compared
compared to to the
the Simpson
Simpson index
index (Figure
(Figure S3).
S3). However,
However,
these changes
these changes did
did not
not exhibit
exhibit aa clear
clear tendency
tendency function
function of
of nTiO
nTiO22 concentration.
concentration.
7
McIntosh index
i hi
6 ghi
abcde fg df def defg def egh
abc bcdf cdf
5 a ab
McIntosh index [-]
4
3
2
1
0
Control 0.8 4 20 100
Start 3 days 7 days 14 days
nTiO2 concentration [mg/L]
Figure 13. The
The effect
effect of
of TiO
TiO22 nanoparticles
nanoparticles on
on freshwater
freshwater McIntosh
McIntosh index value. Letters
Letters on
on the
the columns
columns indicate
indicate significant
significant
differences (level of significance: p < 0.05).
differences (level of significance: p < 0.05).
Significant
Significant differences
differences compared
compared to the control occurred only at at 20
20 and
and 100
100 mg/L
mg/L
nTiO22 after
nTiO after77days
daysandand thethe
McIntosh
McIntosh index values
index valueswere the highest
were at this
the highest attime
this point. Dur-
time point.
ing the 7th
During the day, the McIntosh
7th day, the McIntoshindex values
index showed
values showeda slight decreasing
a slight decreasingtrend with
trend the the
with in-
crease
increaseof of
nTiO2
nTiO2concentration.
concentration. TheThe largest decrease
largest decreasecompared
compared to control occurred
to control occurredat 20
at
20 mg/L
mg/L andand 100 100 mg/L,
mg/L, representing
representing 13%13%and and
11%,11%, respectively.
respectively.
Based on
Based on the results of correlation analysis, there was only a slight non-significant
association
association between the two
two variables
variables (TiO(TiO22 concentration
concentration andandMcIntosh
McIntoshindex)
index)(Table
(Table S2),
S2),
such
such as in case of Gini index (Figure S4).
The RMANOVA
The RMANOVA analysis of the Biolog EcoPlate™ data based on the McIntosh index
showed a clear
showed clearsignificant
significanteffect
effectofoftreatment
treatment andandtime, as well
time, as of
as well astheir interaction
of their (Table 3).
interaction
The
(Table 3). SAWCD ratio per guild in the nTiO2 -contaminated microcosms did not change
significantly
The SAWCD during the per
ratio experiment
guild in (Figure
the nTiO 14).
2-contaminated microcosms did not change
According to the percent distribution
significantly during the experiment (Figure 14). of SAWCD for each nTiO2 concentration
(Figure 14), the use rate of the substrate groups did not change significantly with in-
cremental nTiO2 concentrations.
The microbes in the different microcosms used all six substrate groups, but there
were differences in the use of the various groups regardless of nTiO2 concentration and
elapsed time.
The use rate of carbohydrates (5–10%) was the lowest, while those of polymers
(18–31%) and amines (16–29%) were the highest.You can also read