The effect of display brightness and viewing distance: a dataset for visually lossless image compression - Ingenta ...
←
→
Page content transcription
If your browser does not render page correctly, please read the page content below

https://doi.org/10.2352/ISSN.2470-1173.2021.11.HVEI-152
                                                                                           © 2021, Society for Imaging Science and Technology

The effect of display brightness and viewing distance:
a dataset for visually lossless image compression
Aliaksei Mikhailiuk, Nanyang Ye and Rafał K. Mantiuk; Univeristy of Cambridge; Cambridge, United Kingdom

Abstract                                                                 less image compression dataset with varying peak display bright-
      Visibility of image artifacts depends on the viewing con-          ness and viewing distance and (ii) performance evaluation of im-
ditions, such as display brightness and distance to the display.         age quality and visibility metrics on the new dataset.
However, most image and video quality metrics operate under the
assumption of a single standard viewing condition, without con-          Related work
sidering luminance or distance to the display. To address this           Image compression
limitation, we isolate brightness and distance as the components               Image and video compression methods can be divided into
impacting the visibility of artifacts and collect a new dataset for      three types: lossless, lossy, and visually lossless. Lossless com-
visually lossless image compression. The dataset includes images         pression methods preserve all information in the decompressed
encoded with JPEG and WebP at the quality level that makes com-          image [6]. However, their compression rates are much lower
pression artifacts imperceptible to an average observer. The vis-        than for lossy compression. Lossy compression methods al-
ibility thresholds are collected under two luminance conditions:         low for much higher compression rates, but they compromise
10 cd/m2 , simulating a dimmed mobile phone, and 220 cd/m2 ,             on the visual image quality, often introducing noticeable arti-
which is a typical peak luminance of modern computer displays;           facts [25,26]. Two commonly used lossy image compression stan-
and two distance conditions: 30 and 60 pixels per visual degree.         dards are JPEG and WebP. Both methods have an adjustable qual-
The dataset was used to evaluate existing image quality and visi-        ity factor (QF). The QF varies between 0 (lowest visual quality
bility metrics in their ability to consider display brightness and its   and highest compression rate) and 100 (highest visual quality and
distance to viewer. We include two deep neural network architec-         lowest compression rate). Visually lossless compression meth-
tures, proposed to control image compression for visually lossless       ods introduce distortions but it is ensured that they are unlikely
coding in our experiments.                                               to be noticed [17]. Visually lossless compression requires finding
                                                                         a VLT — the maximum compression level at which distortions
Introduction                                                             are invisible to most observers. In this work, we choose the VLT
      Finding a threshold at which the human eye cannot perceive         for which at most 25% of observers can perceive the compression
changes introduced to an image can be beneficial for computer vi-        artifacts.
sion, computer graphics, and image processing algorithms. Such                 Most compression algorithms rely on hand-crafted methods
threshold can be used, for example, to adjust the image/video            with a relatively small number of adjustable parameters. With
compression level so that the size of the bit-stream is minimized        the advent of machine learning, deep neural networks, capable
while the distortions remain mostly invisible. We will refer to          of learning complex relations in an automated manner without
such quantization or quality level of an image/video codec as a          the need for explicit assumptions, have also been used for image
visually lossless threshold (VLT). Such a VLT depends not only           compression [18]. Their results, however, rely on the quality and
on the image content, but will also vary with the viewing condi-         quantity of training data.
tions: the viewing distance and display brightness. While all im-
age quality metrics account for image content, very few of them          Image quality and visibility assessment
account for viewing conditions [1, 13, 19, 35]. Such lack of ac-               To evaluate compression algorithms, it is necessary to mea-
countability for viewing conditions makes VLT prediction unreli-         sure the quality of the decompressed image. Two types of metrics
able, across different displays and different viewing distances.         can be used for that task: image visibility metrics [19, 35] and
      The goal of this work is to provide a dataset1 that could be       image quality metrics [30, 31, 37]. The latter are also known as
used to evaluate quality and visibility metrics on the task of find-     image fidelity or image impairment metrics and are typically used
ing VLTs under different viewing conditions. We measure VLT              to evaluate image and video codecs. These metrics produce a
at viewing distances corresponding to 30 ppd (pixels per degree)         single value representing the magnitude of the distortion for the
and 60 ppd and two peak brightness levels: 220 cd/m2 , common            entire image. They are meant to predict clearly visible (supra-
to computer displays, and 10 cd/m2 , replicating the brightness of       threshold) distortions and can be less accurate for barely visible
a dimmed phone. We collect a dataset for two popular compres-            (near-threshold) distortions. By comparison, visibility metrics,
sion methods: JPEG [28] and WebP [26]. We then benchmark                 are meant to predict near-threshold distortions. They produce a
both hand-crafted and data-driven image metrics on the dataset.          visibility map with local information about the probability of de-
      The main contributions of our paper are: (i) a visually loss-      tecting a difference between two images. Similar to compression
                                                                         algorithms, image quality and visibility metrics can be divided
  1 The dataset can be downloaded from https://doi.org/10.               into two categories: hand-crafted [30, 31, 37], and trained using
17863/CAM.60354.                                                         machine-learning methods [4, 10, 11, 20, 24, 35, 38]. Both quality

IS&T International Symposium on Electronic Imaging 2021
Human Vision and Electronic Imaging 2021                                                                                                 152-1
and visibility metrics have been adapted to operate under different
display luminance [1, 19, 20, 35].
      Several works have focused solely on predicting the VLT.
For example, authors in [3] proposed SUR-Net, a deep Siamese-
CNN architecture predicting the satisfied-user-ratio (SUR) curve.
For each compressed image, their model predicts the proportion
of the population, which would not notice the distortion. The au-
thors first pre-trained the network to predict image quality and
then fine-tuned on a smaller dataset to predict SUR. The authors
later extended the work to SUR-FeatNet [14], where the pre-
                                                                            (a) VLT experiment stage 1           (b) VLT experiment stage 2
trained Inception-V3-CNN is used to extract the features from the
                                                                        Figure 1: Two stages of visually lossless compression experiment.
images, which are then fed into a smaller network trained to pre-
                                                                        The images were displayed at the native display resolution with-
dict the SUR curve. Authors in [15] took a different approach and
                                                                        out upscaling (images are shown out of scale for better legibility).
trained a deep binary classifier. Which, given the distorted and
undistorted source image, predicts whether the distortion would
be noticed or not.                                                      quality and also the highest bit-rate.

Existing datasets                                                       Procedure
      To train and test image metrics to predict VLT, one requires            To improve the accuracy of the VLT measurements, we com-
a benchmark dataset where, at each quality level, the visibility        bined the method of adjustment and 4-alternative-forced-choice
of distortions is judged by a group of observers. While sev-            (4AFC) protocol, controlled by an adaptive procedure. In the first
eral image quality and visibility datasets are available, they either   method-of-adjustment stage, observers were presented with ref-
do not contain VLTs [23, 34, 35], or present images compressed          erence and compressed images presented side-by-side and were
only with JPEG codec at a single luminance level with at a fixed        asked to adjust the QF of the compressed image until they could
viewing distance. As such, the authors in [9] collected a sub-          not distinguish it from the reference (Figure 1a). A half-a-second
jective dataset, called MCL-JCI, with visually lossless thresholds      blank with a middle-gray background was displayed when chang-
for images compressed with JPEG codec. The dataset contains             ing compression levels to avoid observers relying on temporal
50 source images, with VLTs identified by 30 observers for each         changes to guide their choice. The compression level found in
image. Overall the dataset was collected with 150 observers. Sim-       the first stage was used as an initial guess for the 4AFC proce-
ilarly, authors in [16] created a dataset with VLTs for panoramic       dure [8], in the second stage. Observers were shown three copies
images compressed with JPEG codec. Each of the 40 panoramic             of an undistorted reference image and one distorted image in a
source images was inspected by at least 25 observers, using a           random quarter, as shown in Figure 1b. They were then asked to
head-mounted display.                                                   choose the distorted image by clicking on the spots where they
      Unlike exisiting datasets, the presented dataset in this work     could see the distortions. The location of those mouse clicks for
consist of VLTs for images compressed by not only JPEG but also         all four viewing conditions are shown in Figure 4. The next value
WebP standard. More importantly, the proposed dataset includes          of the QF parameter for the distorted image was then selected
VTLs based on different viewing distance and display brightness.        with the QUEST adaptive procedure [32]. We collected between
                                                                        20 and 30 4AFC trials per observer for each image. To find the
Proposed dataset                                                        VLT for each image we fitted a psychometric function to the col-
                                                                        lected data.
      Our goal was to create a dataset with VLTs for images de-
picting a varied selection of contents and compressed with two
codecs (JPEG and WebP), which were viewed on monitors of dif-           Display
ferent peak luminance (10 cd/m2 and 220 cd/m2 ), and at different            The experiments were conducted in a dim room (⇠10 Lux).
viewing distance (30 ppd and 60 ppd). We captured 20 images             The screen was positioned to minimize ambient light reflections.
with 1920 ⇥ 1281 resolution, which were obtained from DSLR              The viewing distance was controlled with a chin-rest. Observers
RAW images and stored in a lossless format. Half of the images          viewed a 27” Asus PG279Q display (2560x1440) from a dis-
were compressed with JPEG (libjpeg2 ) and the other half with           tance of 80 cm (angular resolution: 60 pixels per degree) or
WebP (libwebp3 ). Since it was more important for us to capture         of 40 cm (angular resolution: 30 pixels per degree). For the
the variety of content than to compare both codecs, we did not          bright condition, display brightness was set to its maximum value
attempt to collect VLT for the same contents and both codecs. To        (220 cd/m2 ). For the dark condition, we placed a 1.2 neutral
ensure that the observers could find the distortions in a reasonable    density filter (Rosco E-Colour 299) in front of the monitor and
amount of time, we cropped the stimuli to 512 ⇥ 512 pixels. Ex-         adjusted the display brightness so that the effective peak lumi-
amples of the images from the dataset are given in Figure 4. To         nance was 10 cd/m2 . We verified that the display color calibration
uniformly cover the entire range of compression quality values at       conformed with ITU-R recommendations [7] and sRGB transfer
a reasonable number of points, we incremented QF from 2 to 100          function.
in steps of 2, where 100 is an image compressed with the highest
                                                                        Observers
   2 https://github.com/LuaDist/libjpeg                                      We collected the data from 19 observers aged between 20
   3 https://github.com/webmproject/libwebp                             and 30 years old, with normal or corrected-to-normal vision. All

                                                                                        IS&T International Symposium on Electronic Imaging 2021
152-2                                                                                                  Human Vision and Electronic Imaging 2021
Figure 3: Visually lossless threshold (VLT) for all four viewing
                                                                       conditions shown in different colors. Note that the color used are
                                                                       consistent with Figures 2 and 4.

                                                                       shows that for this image, the distortions were spotted in different
                                                                       parts of the image for different observers (sky, trees, grass, peo-
                                                                       ple), which could explain the variability. Therefore, we opt to use
                                                                       a lower value of Pdet to find a VLT. This way the VLT reflects
                                                                       the results for the most attentive observers, who could spot the
                                                                       most critical part of an image. Another interesting case is image
                                                                       i17jpeg, for which the curves are close together and the slopes
Figure 2: Distribution of visually lossless thresholds across the      are steep (low inter-observer variance). As seen in Figure 4, the
population. The shaded regions are 99% confidence intervals (due       distortions for that image were consistently detected by most ob-
to limited sample size). The dashed red lines denote the detection     servers in a large smooth area of the sky.
threshold used to find the VLT.                                              For each condition the VLT is found by selecting the quality
                                                                       factor l for which Pdet = 0.25 (less than 25% of the population
observers were trained and paid for their participation and were       can see the difference). Such population VLT values are shown
naı̈ve to the purpose of the experiment.                               in Figure 3. The display brightness (circles vs. squares) seems
                                                                       to have a higher impact on the VLT than viewing distance (con-
Data analysis                                                          tinuous vs. dashed lines). Another interesting observation is that
     Before analyzing the data, we removed outliers. For each          some images were less affected by the display brightness (i3webp,
scene we followed the standard z-score procedure and removed           i11jpeg, i17jpeg) than the others (i12jpeg, i16jpeg). As shown in
VLT measurements which were more than two standard devia-              Figure 4, the distortions in less affected images were typically
tions away from the mean.                                              spotted in bright and smooth regions, for which Weber’s law can
                                                                       compensate for the loss of display brightness. It is also important
VLT distribution                                                       to note that the changes in VLTs between the viewing conditions
     We estimate VLT distribution across the population assum-         are different for each image, suggesting a strong interaction be-
ing it to be normally distributed, similarly as in [3]. The pro-       tween image content and viewing conditions.
portion of the population that can detect the distortion is, thus,
described by the function:                                             Evaluation of image metrics
                                                                             In this section, we evaluate how accurately image quality
     Pdet (l) = 1   F(l; µ, s 2 ) ,                             (1)    and visibility metrics can predict VLTs. The predicted VLTs
                                                                       then can be used to automatically adjust compression parameters
where l is the JPEG/WebP quality factor and F(l; µ, s ) is the cu-     to achieve a trade-off between image visual quality and bit-rate.
mulative normal distribution with the estimated mean and vari-         We evaluated both hand-crafted image quality metrics (PSNR,
ance of VLT distribution for each condition. The plots of those        SSIM [30], MS-SSIM [29], FSIM [36], HDRVQM [22]) and one
functions for each image are shown in Figure 2.                        metric based on machine learning (deep photometric image qual-
      The plots of probability of detection in Figure 2 show a clear   ity metric: PU-PieApp) [20]. Additionally, we evaluate two vis-
pattern, with the brighter display (220 cd/m2 ) and shorter viewing    ibility metrics: a high dynamic range visible difference predictor
distance (30 ppd) requiring the highest quality factor. The oppo-      (HDRVDP3) [19,21], and a CNN-based deep photometric visibil-
site is shown for the darker display (10 cd/m2 ) seen from a larger    ity metric (DPVM) [35]. Note that for the HDRVDP3, we report
distance (60 ppd). The slope of those curves indicates how the         the results of both the visibility predictor (labelled HDRVDP3V)
VLT varied between the observers. The slope is similar for most        and the quality predictor (labelled HDRVDP3Q). We could not
tested conditions, with a few exceptions. For example, the slope       include metrics intended for VLT prediction in [15] and [3], as
is shallower for i7webp with 220 cd/m2 and 60 ppd (red), indicat-      we could not access the trained models. Furthermore, correspon-
ing a higher variance between the observers. Figure 4 (red dots)       dence with the authors revealed that the models were trained on

IS&T International Symposium on Electronic Imaging 2021
Human Vision and Electronic Imaging 2021                                                                                                152-3
are then converted into the Perceptually Uniform (PU) or loga-
                                                                                      rithmic values. In our work, we use the PU transform, as it has
                                                                                      proven to achieve better results than the logarithmic coding [12].
                                                                                      The shape of the PU-transform is shown in Figure 5.
                                                                                           To transform standard-dynamic-range (SDR) images from
    i0webp                        i1webp               i2webp               i3webp    gamma-encoded sRGB colors to linear RGB values shown on
                                                                                      the high-dynamic-range (HDR) display, gain-gamma-offset dis-
                                                                                      play model is often used [5]:
                                                                                                                         g
                                                                                           Clin = (Lpeak       Lblack )CsRGB + Lblack ,                              (2)

                                                                                      where Clin is the linear color value, CsRGB is the gamma-encoded
    i4webp                        i5webp               i6webp               i7webp
                                                                                      color value for one of the channels (R, G or B), and g = 2.2.
                                                                                      In our experiments we set the peak luminance of the display to
                                                                                      Lpeak = 10 cd/m2 , or Lpeak = 220 cd/m2 , and the black level Lblack
                                                                                      was set to 0.001 Lpeak (assuming that the contrast of the display
                                                                                      was 1000:1 and there were no ambient light reflections) for both
                                                                                      cases. We used PU encoding to adapt PSNR, SSIM and FSIM
    i8webp                        i9webp               i10jpeg              i11jpeg   to different luminance conditions. Other metrics (HDRVDP-3,
                                                                                      DPVM, HDRVQM and PU-PieApp,) are photometric by design,
                                                                                      and thus do not require the application of PU-transform.

                                                                                      Viewing distance-aware metrics
                                                                                            To account for viewing distance in VLT prediction, we fol-
    i12jpeg                       i13jpeg              i14jpeg              i15jpeg   lowed the procedure in [35]. We re-sampled images with angu-
                                                                                      lar resolution of 30 ppd, to the angular resolution of 60 ppd with
                                                                                      Lanczos filter [27] before passing them to the metrics. 60 ppd is
                                                                                      the highest resolution in our dataset and also a reasonable limit
                                                                                      for most visual tasks, since the sensitivity of visual system drops
                                                                                      rapidly below 30 cpd [2]. We did not perform the re-sampling for
    i16jpeg                       i17jpeg              i18jpeg              i19jpeg   HDRVDP3, as it automatically accounts for the viewing distance.

Figure 4: The images used in the experiment and the distributions                     Metrics validation
of observer clicks (blue for 10 cd/m2 , 60 ppd, green for 10 cd/m2 ,                        To validate the metrics, we performed 5-fold cross-
30 ppd, black for 220 cd/m2 , 30 ppd and red for 220 cd/m2 ,                          validation. Our goal was to find a mapping between the qual-
60 ppd). Colors are consistent with Figures 2 and 3.                                  ity score predicted by the metrics and the VLTs for Pdet = 0.25.
                   600                                                                We also experimented with different threshold Pdet values and ob-
                          PU-Transofrm
                   400                                                                tained similar results (not reported here).
        PU value

                   200                                                                      We assume that a metric prediction can be mapped to the
                     0
                                                                                      predicted probability of detection P̃det by a monotonic function f :
                   -200
                          0.0001 0.001   0.01   0.1   1    10    100   1000 10000          P̃det = f (M(Tl , R)) ,                                                   (3)
                                          Luminance [cd/m 2]
Figure 5: PU-transform used to transform absolute physical val-
                                                                                      where M is the quality metric, R is the reference image and Tl
ues (in cd/m2 ) into approximately perceptually uniform units that
                                                                                      is the test image encoded at the quality level l. Therefore, the
can be used with existing quality metrics. Note, some values are
                                                                                      predicted VLT l˜ can be found as:
negative – to ensure that the luminance range of a typical (sRGB)
monitor of 1 cd/m2 to 80 cd/m2 is mapped to the range 0–255.                              l˜ = argmin || f (M(Tl , R))       0.25||2       ^     l 2 2, 4, .., 100 . (4)
                                                                                                  l
very small datasets and thus could not generalize well beyond the
                                                                                      Since we are interested in the single value of VLT rather than
training data.
                                                                                      finding the function f , we instead estimate the VLT using a single
                                                                                      (per metric) value qV LT :
Luminance-aware metrics
      Hand-crafted image quality metrics, PSNR, SSIM, MS-                                  l˜ = argmin ||M(Tl , R)       qV LT ||2     ^       l 2 2, 4, .., 100 ,   (5)
SSIM and FSIM were not designed to account for display lumi-                                          l
nance. Aydın et al. proposed a simple method for adapting exist-
ing quality metrics to operate on different display luminance lev-                    which we optimize per metric so that ||l˜ l||2 is minimized
els [1]. The image is first transformed to luminance emitted from                     (where l is the measured VLT). The individual qV LT was found
a display assuming a model of that display. The luminance values                      for each fold so that the results are reported for the testing set.

                                                                                                          IS&T International Symposium on Electronic Imaging 2021
152-4                                                                                                                    Human Vision and Electronic Imaging 2021
Since HDRVDP3V and DPVM produce a map of detec-
tion probabilities, rather than a single quality value, we con-
sider a percentile value from the probability map to be a predic-
tion. For DPVM, similar to [33], we search for the optimal per-
centile that minimizes root-mean-squared-error (RMSE) between
the predicted and measured VLT. The best percentile for DPVM
and HDRVDP3V were 86 and 97 respectively.

Results and discussion
      We first explore how well each of the metrics can account          (a) Fixed luminance (10 cd/m2 )   (b) Fixed luminance (220 cd/m2 )
for the viewing distance and the display brightness. The metrics
that use PU transform are prefixed with PU-. For each experiment
we fix one of the viewing conditions and let the metric predict the
VLT, while accounting for another viewing condition (e.g., how
well the metric can account for the viewing distance at a fixed
luminance level of 10 cd/m2 ). The results of the 5-fold cross-
validation are shown in Figure 6. Metrics, which were designed
to account for the viewing distance (HDRVDP3Q and DPVM)
match the experimental VLT better across different viewing dis-
tances compared to the metrics that used a simple resampling.
When viewing distance is fixed and metrics are trained to account
for the display brightness, DPVM performs the best among the               (c) Fixed distance (30 ppd)        (d) Fixed distance (60 ppd)
tested metrics. It is followed by three metrics with comparable        Figure 6: Five-fold cross-validation results for the compared met-
performance: PU-FSIM, HDRVDP3Q and PU-PieApp. In gen-                  rics under varied viewing conditions. We fix one the viewing con-
eral, all metrics better account for the display luminance changes,    ditions and make the metric account for the remaining condition.
compared to changes in viewing distance. In all experiments the        In the first row we isolate distance as the component impacting
visibility predictor HDRVDP3V performed unexpectedly worse             the VLT and test whether metrics can take it into account under
than HDRVDP3Q. This implies that HDRVDP3V requires fine-               fixed display luminance. Similarly, in the second row, we fix the
tuning for more accurate perfomance.                                   distance, and let the metrics account for the display luminance.
                                                                       Error bars show the standard deviation.
      Figure 7a shows the results of the 5-fold cross-validation
for all viewing conditions, i.e., each metric needed to account
for both display brightness and viewing distance. The results
show that DPVM is the best performing metric, followed by
five metrics of comparable performance (verified in the paired
ttest): HDRVDP3Q, PU-PieApp, PU-FSIM, HDRVQM and PU-
MS-SSIM. The visibility predictor HDRVDP3V performed worse
than its quality counterpart. It is also worth noting a relatively
good performance of PU-FSIM, as this is a hand-crafted metric
that has not been trained on this task. The RMSE of the DPVM
is 21.9, which is slightly larger, than the average variation of the
VLT across the population – 15.9 (refer to Figure 2). This differ-                     (a)                                (b)
ence can be acceptable, and the metric should be robust enough to      Figure 7: (a) Five-fold cross-validation results for the compared
adaptively encode images displayed at different luminance levels       metrics. Error bars show the standard deviation. (b) RMSE per
and at a different viewing distance in a visually lossless manner.     image.

     Figure 7b shows the RMSE per image for the four best
performing metrics. It is worth noting that while DPVM re-
                                                                       Conclusions
sulted in substantially smaller RMSE for some images, it was
the worst performing metric for others. The performance of the              We carefully collected a novel dataset for visually lossless
DPVM did not correlate with the folds. The hand-crafted met-           image compression under varying display brightness and viewing
rics with a few trainable parameters, HDRVDP3Q and PU-FSIM,            distance conditions and compared the performance of the state-
tend to be more consistent and vary less in RMSE than machine-         of-the-art image quality and visibility metrics on this dataset. The
leaning based metrics, PI-PieApp and DPVM. Most metrics (ex-           results indicate that the display brightness and the viewing dis-
cept HDRVDP3Q) showed a very large error for images with large         tance can significantly affect the compression level required for
smooth gradient areas (e.g., sky), i3webp,i4webp,i5webp,i13jpeg,       visually lossless coding. We found that, recently proposed deep
i14jpeg and i17jpeg, suggesting that those metrics could be worse      photometric visibility metric (DPVM) is the best at matching the
at modeling contrast masking.                                          experimental thresholds for the collected dataset.

IS&T International Symposium on Electronic Imaging 2021
Human Vision and Electronic Imaging 2021                                                                                                    152-5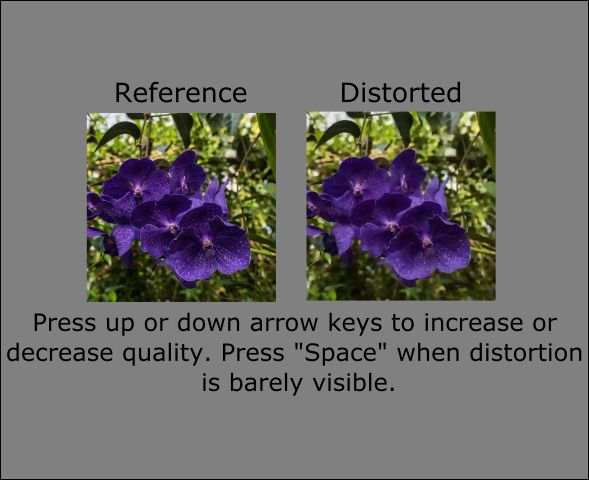
Acknowledgments                                                                      X. Fan. Deep learning-based picture-wise just noticeable distortion
     We would like to thank the volunteers who participated in                       prediction model for image compression. IEEE Transactions on Im-
our experiments and Maryam Azimi for the insightful comments                         age Processing, 29:641–656, 2020.
on the manuscript. This project has received funding from the                 [16]   Xiaohua Liu, Zihao Chen, Xu Wang, Jianmin Jiang, and Sam
European Research Council (ERC) under the European Union’s                           Kowng. JND-Pano: database for just noticeable difference of JPEG
Horizon 2020 research and innovation programme — grant agree-                        compressed panoramic images. In Richang Hong, Wen-Huang
ment N 725253 (EyeCode).                                                             Cheng, Toshihiko Yamasaki, Meng Wang, and Chong-Wah Ngo, ed-
                                                                                     itors, Advances in Multimedia Information Processing – PCM 2018,
References                                                                           pages 458–468. Springer International Publishing, 2018.
 [1] Tunç Ozan Aydın, Rafał Mantiuk, and Hans-Peter Seidel. Extending        [17]   Vladimir Lukin. Performance analysis of visually lossless image
     quality metrics to full dynamic range images. In Human Vision and               compression. Conference on Video Processing and Quality Metrics
     Electronic Imaging XIII, Proc. of SPIE, pages 6806–10, San Jose,                for Consumer Electronics, 01 2012.
     USA, January 2008.                                                       [18]   Siwei Ma, Xinfeng Zhang, Chuanmin Jia, Zhenghui Zhao, Shiqi
 [2] Peter Barten. Contrast Sensitivity of the Human Eye and Its Effects             Wang, and Shanshe Wanga. Image and video compression with neu-
     on Image Quality. SPIE Press, 1999.                                             ral networks: A review. IEEE Transactions on Circuits and Systems
 [3] C. Fan, H. Lin, V. Hosu, Y. Zhang, Q. Jiang, R. Hamzaoui, and                   for Video Technology, PP:1–1, 04 2019.
     D. Saupe. Sur-net: Predicting the satisfied user ratio curve for image   [19]   Rafał Mantiuk, Kil Joong Kim, Allan G. Rempel, and Wolfgang
     compression with deep learning. In 2019 Eleventh International                  Heidrich. HDR-VDP-2: A calibrated visual metric for visibility and
     Conference on Quality of Multimedia Experience (QoMEX), pages                   quality predictions in all luminance conditions. ACM Trans. Graph.,
     1–6, June 2019.                                                                 30(4), July 2011.
 [4] Fei Gao, Yi Wang, Panpeng Li, Min Tan, Jun Yu, and Yani Zhu.             [20]   Aliaksei Mikhailiuk, Maria Perez-Ortiz, Dingcheng Yue, Wilson
     Deepsim: Deep similarity for image quality assessment. Neurocom-                Suen, and Rafal Mantiuk. Consolidated dataset and metrics for high-
     puting, 257:104 – 114, 2017. Machine Learning and Signal Process-               dynamic-range image quality assessment. In Under review for IEEE
     ing for Big Multimedia Analysis.                                                Transactions on Multimedia (TMM), 2020.
 [5] Rolf R. Hainich. Perceptual display calibration. CRC Press, 2016.        [21]   Manish Narwaria, Rafal K. Mantiuk, Mattheiu Perreira Da Silva,
 [6] A.J. Hussain, Ali Al-Fayadh, and Naeem Radi. Image compression                  and Patrick Le Callet. HDR-VDP-2.2: a calibrated method for ob-
     techniques: A survey in lossless and lossy algorithms. Neurocom-                jective quality prediction of high-dynamic range and standard im-
     puting, 300:44 – 69, 2018.                                                      ages. Journal of Electronic Imaging, 24(1):010501, jan 2015.
 [7] ITU-R. Parameter values for the hdtv standards for production            [22]   Manish Narwaria, Matthieu Perreira Da Silva, and Patrick Le Cal-
     and international programme exchange. ITU-R Recommendation                      let. Hdr-vqm: An objective quality measure for high dynamic range
     BT.709-6, Mar 2015.                                                             video. Signal Processing: Image Communication, 35:46 – 60, 2015.
 [8] Frank Jakel and Felix A. Wichmann. Spatial four-alternative forced-      [23]   Nikolay Ponomarenko, Lina Jin, Oleg Ieremeiev, Vladimir Lukin,
     choice method is the preferred psychophysical method for naive ob-              Karen Egiazarian, Jaakko Astola, Benoit Vozel, Kacem Chehdi,
     servers. Journal of Vision, 6(11):13–13, 11 2006.                               Marco Carli, Federica Battisti, and C.-C. Jay Kuo. Image database
 [9] Lina Jin, Joe Yuchieh Lin, Sudeng Hu, Haiqiang Wang, Ping Wang,                 TID2013: Peculiarities, results and perspectives. Signal Processing:
     Ioannis Katsavounidis, Anne Aaron, and C.-C. Jay Kuo. Statistical               Image Communication, 30:57–77, jan 2015.
     study on perceived JPEG image quality via MCL-JCI dataset con-           [24]   Ekta Prashnani, Hong Cai, Yasamin Mostofi, and Pradeep Sen.
     struction and analysis. Electronic Imaging, pages 1–9, 2016.                    Pieapp: Perceptual image-error assessment through pairwise pref-
[10] J. Kim, H. Zeng, D. Ghadiyaram, S. Lee, L. Zhang, and A. C.                     erence. In The IEEE Conference on Computer Vision and Pattern
     Bovik. Deep convolutional neural models for picture-quality pre-                Recognition (CVPR), June 2018.
     diction: Challenges and solutions to data-driven image quality as-       [25]   A. Raid, Wael Khedr, Mohamed El-dosuky, and Wesam Ahmed.
     sessment. IEEE Signal Processing Magazine, 34(6):130–141, Nov                   Jpeg image compression using discrete cosine transform - a survey.
     2017.                                                                           International Journal of Computer Science and Engineering Survey,
[11] Jangyoo Kim and Sanghoon Lee. Deep learning of human visual                     5, 05 2014.
     sensitivity in image quality assessment framework. Computer Vision       [26]   Zhanjun Si and Ke Shen. Research on the WebP Image Format,
     and Pattern Recognition (CVPR), pages 1969–1977, 2017.                          pages 271–277. Springer, 12 2016.
[12] P. Korshunov, P. Hanhart, T. Richter, A. Artusi, R. Mantiuk, and         [27]   Ken Turkowski. Filters for Common Resampling Tasks, page
     T. Ebrahimi. Subjective quality assessment database of HDR images               147–165. Academic Press Professional, Inc., USA, 1990.
     compressed with jpeg xt. In 2015 Seventh International Workshop          [28]   Gregory K. Wallace. The JPEG still picture compression standard.
     on Quality of Multimedia Experience (QoMEX), pages 1–6, May                     Communications of the ACM, pages 30–44, 1991.
     2015.                                                                    [29]   Z. Wang, E. P. Simoncelli, and A. C. Bovik. Multiscale struc-
[13] Pavel Korshunov and Touradj Ebrahimi. Context-dependent JPEG                    tural similarity for image quality assessment. In The Thrity-Seventh
     backward-compatible high-dynamic range image compression. Op-                   Asilomar Conference on Signals, Systems Computers, 2003, vol-
     tical Engineering, 52(10):102006, aug 2013.                                     ume 2, pages 1398–1402 Vol.2, 2003.
[14] Hanhe Lin, Vlad Hosu, Chunling Fan, Yun Zhang, Yuchen Mu,                [30]   Zhou Wang, A. C. Bovik, H. R. Sheikh, and E. P. Simoncelli. Im-
     Raouf Hamzaoui, and Dietmar Saupe. Sur-featnet: Predicting the                  age quality assessment: from error visibility to structural similar-
     satisfied user ratio curve for image compression with deep feature              ity. IEEE Transactions on Image Processing, 13(4):600–612, April
     learning. Quality and User Experience, 5(1), May 2020.                          2004.
[15] H. Liu, Y. Zhang, H. Zhang, C. Fan, S. Kwong, C. . J. Kuo, and           [31]   Zhou Wang, Alan C. Bovik, Hamid R. Sheikh, and Eero P. Simon-

                                                                                                IS&T International Symposium on Electronic Imaging 2021
152-6                                                                                                          Human Vision and Electronic Imaging 2021
celli. Image quality assessment: From error visibility to structural
       similarity. IEEE Transactions on Image Processing, 13(4):600–612,
       2004.
[32]   Andrew B. Watson and Denis G. Pelli. Quest: A Bayesian adaptive
       psychometric method. Perception & Psychophysics, 33(2):113–120,
       Mar 1983.
[33]   K. Wolski, D. Giunchi, S. Kinuwaki, P. Didyk, K. Myszkowski,
       A. Steed, and R. K. Mantiuk. Selecting texture resolution us-
       ing a task-specific visibility metric. Computer Graphics Forum,
       38(7):685–696, 2019.
[34]   Krzysztof Wolski, Daniele Giunchi, Nanyang Ye, Piotr Didyk,
       Karol Myszkowski, Radosław Mantiuk, Hans-Peter Seidel, Anthony
       Steed, and Rafał K. Mantiuk. Dataset and metrics for predicting lo-
       cal visible differences. ACM Trans. Graph., 37(5), November 2018.
[35]   Nanyang Ye, Krzysztof Wolski, and Rafał K. Mantiuk. Predicting
       visible image differences under varying display brightness and view-
       ing distance. In IEEE/CVF Conference on Computer Vision and
       Pattern Recognition 2019 (CVPR 2019), 2019.
[36]   L. Zhang, L. Zhang, X. Mou, and D. Zhang. Fsim: A feature sim-
       ilarity index for image quality assessment. IEEE Transactions on
       Image Processing, 20(8):2378–2386, Aug 2011.
[37]   Lin Zhang, Lei Zhang, Xuanqin Mou, and David Zhang. FSIM: A
       feature similarity index for image quality assessment. IEEE Trans-
       actions on Image Processing, 20(8):2378–2386, Aug 2011.
[38]   Richard Zhang, Phillip Isola, Alexei A Efros, Eli Shechtman, and
       Oliver Wang. The unreasonable effectiveness of deep networks as a
       perceptual metric. In CVPR, 2018.

Author Biography
      Aliaksei Mikhailiuk has recently received his PhD in Computer Sci-
ence under the supervision of Dr. Rafal Mantiuk. Nanyang Ye is currently
an assistant professor at Shanghai Jiao Tong University. He received his
PhD at the University of Cambridge, UK, having previously received his
MA degree from Tsinghua University, China.
      Rafał K. Mantiuk is Reader (Associate Professor) at the Department
of Computer Science and Technology, University of Cambridge (UK). He
received PhD from the Max-Planck-Institute for Computer Science (Ger-
many). His recent interests focus on computational displays, novel dis-
play technologies, rendering and imaging algorithms that adapt to hu-
man visual performance and viewing conditions in order to deliver the
best images given limited resources, such as computation time, band-
width or dynamic range. He contributed to early work on high dynamic
range imaging, including quality metrics (HDR-VDP), video compression
and tone-mapping. Further details: http://www.cl.cam.ac.uk/
˜rkm38/.

IS&T International Symposium on Electronic Imaging 2021
Human Vision and Electronic Imaging 2021                                      152-7
JOIN US AT THE NEXT EI!

 IS&T International Symposium on

 Electronic Imaging
 SCIENCE AND TECHNOLOGY

Imaging across applications . . . Where industry and academia meet!

• SHORT COURSES • EXHIBITS • DEMONSTRATION SESSION • PLENARY TALKS •
• INTERACTIVE PAPER SESSION • SPECIAL EVENTS • TECHNICAL SESSIONS •

                  www.electronicimaging.org
                                                             imaging.org

You can also read