THE EROSITA FINAL EQUATORIAL DEPTH SURVEY (EFEDS): ARXIV
←
→
Page content transcription
If your browser does not render page correctly, please read the page content below
Astronomy & Astrophysics manuscript no. main                                                                                            ©ESO 2022
                                               January 17, 2022

                                                               The eROSITA Final Equatorial Depth Survey (eFEDS):
                                                    X-ray emission around star-forming and quiescent galaxies at 0.05 < z < 0.3
                                                Johan Comparat1? , Nhut Truong2 , Andrea Merloni1 , Annalisa Pillepich2 , Gabriele Ponti3, 1 , Simon Driver4,5 , Sabine
                                                   Bellstedt4 , Joe Liske6 , James Aird7, 8 , Marcus Brüggen6 , Esra Bulbul1 , Luke Davies4 , Justo Antonio González
                                                 Villalba1 , Antonis Georgakakis9 , Frank Haberl1 , Teng Liu1 , Chandreyee Maitra1 , Kirpal Nandra1 , Paola Popesso10 ,
                                                                   Peter Predehl1 , Aaron Robotham4 , Mara Salvato1 , Jessica E. Thorne4 , Yi Zhang1

                                                       1
                                                           Max-Planck-Institut für extraterrestrische Physik (MPE), Gießenbachstraße 1, D-85748 Garching bei München, Germany
                                                       2
                                                           Max-Planck-Institut für Astronomie, Königstuhl 17, D-69117 Heidelberg, Germany
arXiv:2201.05169v1 [astro-ph.GA] 13 Jan 2022

                                                       3
                                                           INAF-Osservatorio Astronomico di Brera, Via E. Bianchi 46, I-23807 Merate (LC), Italy
                                                       4
                                                           International Centre for Radio Astronomy Research (ICRAR), University of Western Australia, Perth, Western Australia, Aus-
                                                           tralia;
                                                       5
                                                           International Space Centre (ISC), University of Western Australia, Perth, Western Australia, Australia
                                                       6
                                                           Hamburger Sternwarte, University of Hamburg, Gojenbergsweg 112, D-21029 Hamburg, Germany
                                                       7
                                                           Institute for Astronomy, Royal Observatory, University of Edinburgh, Edinburgh EH9 3HJ, UK
                                                       8
                                                           School of Physics & Astronomy, University of Leicester, University Road, Leicester LE1 7RJ, UK
                                                       9
                                                           Institute for Astronomy and Astrophysics, National Observatory of Athens, V. Paulou & I. Metaxa, 11532, Greece
                                                      10
                                                           European Southern Observatory, D-85748 Garching bei München, Germany
                                                     January 17, 2022

                                                                                                                   ABSTRACT

                                                     Aims. The circum-galactic medium (CGM) plays an important role in galaxy evolution as the main interface between the star-forming
                                                     body of galaxies and the surrounding cosmic network of in- and out-flowing matter. In this work, we aim at characterizing the hot
                                                     phase of the CGM in a large sample of galaxies using recent soft X-ray observations made by SRG/eROSITA.
                                                     Methods. We stack X-ray events from the ‘eROSITA Final Equatorial Depth Survey’ (eFEDS) around central galaxies in the 9hr field
                                                     of the ‘GAlaxy and Mass Assembly’ (GAMA) survey to construct radially projected X-ray luminosity profiles in the 0.5–2 keV rest
                                                     frame energy band as a function of their stellar mass and specific star formation rate. We consider samples of quiescent (star-forming)
                                                     galaxies in the stellar mass range 2 × 10¹⁰ – 1012 M (3 × 10⁹ – 6 × 10¹¹ M ).
                                                     Results. For quiescent galaxies, the X-ray profiles are clearly extended throughout the available mass range; however, the measured
                                                     profile is likely biased high due to projection effects, as these galaxies tend to live in dense and hot environments. For the most massive
                                                     star forming samples (≥ 1011 M ), there is a hint of detection of extended emission. On the other hand, for star-forming galaxies with
                                                     < 1011 M the X-ray stacked profiles are compatible with unresolved sources and consistent with the expected emission from faint
                                                     active galactic nuclei (AGN) and X-ray binaries. We measure for the first time the mean relation between average X-ray luminosity
                                                     and stellar mass separately for quiescent and star-forming galaxies. We find that the relation is different for the two galaxy populations:
                                                     high-mass (≥ 1011 M ) star-forming or quiescent galaxies follow the expected scaling of virialized hot haloes, while lower mass star-
                                                     forming galaxies show a less prominent luminosity and a weaker dependence on stellar mass, consistent with empirical models of the
                                                     population of weak AGN. When comparing our results with state-of-the art numerical simulations (IllustrisTNG and EAGLE), we
                                                     find an overall consistency on the average emission on large (> 80 kpc) scales at masses ≥ 1011 M , but disagreement on the small
                                                     scales, where brighter than observed compact cores are predicted. The simulations also do not predict the clear differentiation that we
                                                     observe between quiescent and star-forming galaxies in our samples.
                                                     Conclusions. This is a stepping stone towards a more profound understanding of the hot phase of the CGM, which holds a key role in
                                                     the regulation of star formation. Future analysis using eROSITA all-sky survey data, combined with future generation galaxy evolution
                                                     surveys, shall provide much enhanced quantitative measures and mappings of the circum-galactic medium and its hot phase(s).
                                                     Key words. X-ray, galaxies, circum-galactic medium

                                               1. Introduction                                                              40% of the baryons, remains until now vastly unconstrained. In
                                                                                                                            that regard, L∗ galaxies hosted by 1012 M haloes, where most
                                               A precise description of the different phases of the cosmic gas,             of the stars and metals are formed (Moster et al. 2018; Behroozi
                                               from the inter-galactic (IGM) to the circum-galactic medium                  et al. 2019), are of great interest. Soft X-ray observations rep-
                                               (CGM) around galaxies, is the missing piece to establish an ac-              resent a particularly useful tool to investigate the properties of
                                               curate baryon budget in the Universe (Tumlinson et al. 2017;                 the halo gas around galaxies, as the warm-hot phase itself should
                                               Driver 2021). The physical properties of the warm-hot compo-                 reach virial temperatures such that most of the emission emerges
                                               nent of the inter-galactic and halo gas, supposedly comprising               in this band (Fukugita & Peebles 2004, 2006).
                                                ?
                                                    E-mail: comparat@mpe.mpg.de

                                                                                                                                                                        Article number, page 1 of 23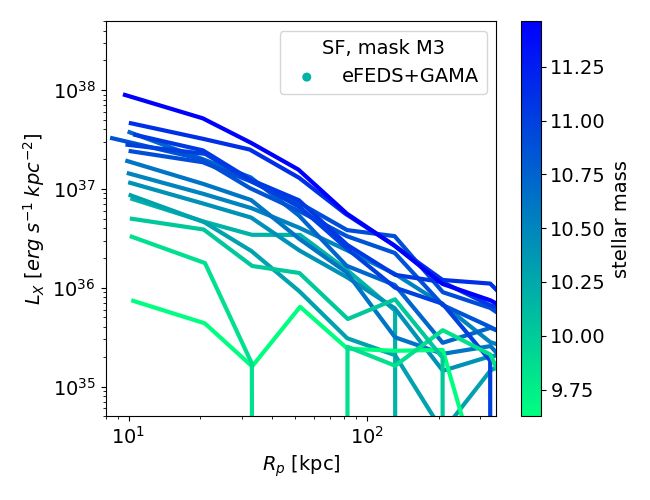
A&A proofs: manuscript no. main

Fig. 1. Figures describing the set of central galaxies used in this work. Top. Sky coverage of eFEDS data (grey points) and GAMA galaxies
(magenta). Bottom panels. The split between star-forming and quiescent galaxies is illustrated on the leftmost panel. It is done via a boundary
at log10 (sS FR) = −11. Stellar mass (log10 (M/M )) vs. redshift for the set of quiescent (middle) and star-forming (right) galaxies available in the
GAMA 9h field.

     In fact, hot and X-ray emitting haloes have been observed                    From a theoretical perspective, the extended, soft X-ray
around individual or small samples of galaxies in the past. This             emission from the gaseous atmospheres of massive haloes has
has been generally achieved for early-type massive galaxies (e.g.            been predicted by galaxy formation models in the full cosmo-
Goulding et al. 2016; Bregman et al. 2018). The detection of X-              logical context since the analytical models of White & Frenk
ray emitting atmospheres around disk, star-forming galaxies is               (1991). This has been confirmed, albeit with overall lower lumi-
rare and limited to small samples of galaxies more massive than              nosity than previously expected, by the results of cosmological
∼ 1011 M (e.g. Bogdán et al. 2013a,b, 2017; Anderson et al.                  hydro-dynamical simulations, also around disk and MW-mass
2016; Li et al. 2016).                                                       galaxies (e.g. Crain et al. 2010; Bogdán et al. 2015; Kelly et al.
     Anderson et al. (2015) stacked X-ray photons from the                   2021, with the GIMIC, Illustris and EAGLE simulations, respec-
ROSAT all-sky survey around 250,000 massive galaxies from                    tively). These works have shown that such X-ray emission is sen-
the Sloan Digital Sky Survey that are central within their dark-             sitive to the unfolding and the interplay of star formation, feed-
matter haloes. They reported a strong correlation between the                back and cooling processes, which simultaneously can remove
mean X-ray luminosity of the volume-filling gas in the CGM                   low-entropy gas by star formation, heat up the halo gas via en-
(i.e. in the range (0.15 − 1) × R500c 1 ) and the galaxy stellar mass,       ergy injections, but can also redistribute the gas via outflows,
in the stellar mass range log M ∗ /M = 10.8 − 12. However,                   making gaseous haloes dilute. Recently, Truong et al. (2020)
due to the limited spatial resolution and the bright flux limit of           and Oppenheimer et al. (2020) have shown that the state-of-
ROSAT, it was not possible to firmly detect an X-ray emission                the-art cosmological galaxy simulations IllustrisTNG and EA-
signal from the CGM of Milky Way-mass (MW) galaxies and                      GLE both predict an X-ray luminosity dichotomy at z ∼ 0: at
below (. 1010.7 M ).                                                         the transitional stellar mass regime of 1010.5−11 M , simulated
                                                                             star-forming galaxies in fact exhibit somewhat higher soft X-
 1
   R500c is the radius at which the density of the dark matter halo is 500   ray luminosity from the volume-filling gas within and around
times the critical density of the Universe at the redshift of the system.

Article number, page 2 of 23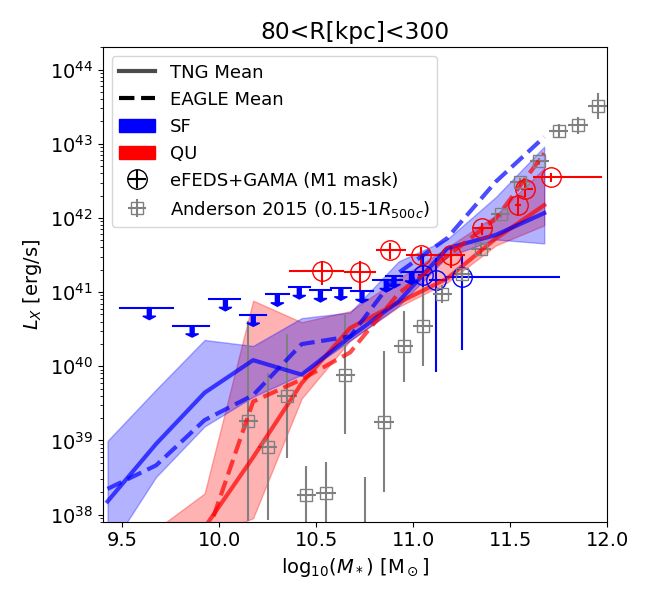
Comparat et al.: X-ray emission around GAMA galaxies in eROSITA/eFEDs

them than quiescent galaxies of the same mass, all the way out to      specific star formation rate in year inverse (yr−1 ). The exact se-
galactocentric distances of ∼200 kpc. Despite the differences in       lection of galaxies is detailed in Sect. 3.1.
feedback processes implemented therein, this has been shown to             We note that the GAMA galaxy sample only covers a frac-
be a direct manifestation of the quenching mechanism in the sim-       tion of the eFEDS area 60 deg2 out of 140 deg2 , see Fig. 1 top
ulations, with the reduction of the gas mass within the haloes due     panel. Necessarily, we limit our X-ray analysis to this 60 deg2
to super massive black hole (SMBH) driven outflows. Clearly,           area.
robust statistical constraints on the properties of the X-ray emit-
ting gas from large samples of galaxies in this transitional mass
                                                                       3. Method
regime may hold the key to further improve our understanding
of the complex physical processes shaping up the gaseous atmo-         By stacking large data sets the noise decreases and features with
sphere of their haloes.                                                weak signal may be unveiled (e.g. Zhu et al. 2015; Comparat
    In this article, we bridge the gap between past studies by         et al. 2020b; Wolf et al. 2020). To do so, we stack X-ray events
attempting to measure the faint, extended X-ray emission, i.e.         around central galaxies with known spectroscopic redshift (Sect.
the so-called hot phase of the CGM, surrounding central galax-         3.1), after masking detected X-ray sources (Sect. 3.2).
ies over a wide stellar mass range (≈ 109.6−11.8 M ) by stacking            We keep track of the angular distance between the detected
SRG/eROSITA data, taking advantage of its high sensitivity in          X-ray event and the galaxy (and its redshift) to build radial pro-
soft X-rays, moderate spatial resolution, large grasp and stable       files. We record the event energies to build X-ray spectra. We
background (Predehl et al. 2021). In order to do that, we use          obtain a data cube where angular coordinates are converted to
data from the eROSITA performance verification eFEDS field             proper distance (angle averaged) radii and the energy (or wave-
(Brunner et al. 2021), a 140 deg2 survey that partly overlaps          length) vector is shifted to the galaxy redshift. The stacking pro-
with a highly complete spectroscopic sample of low redshift            cedure is described in detail in Sect. 3.3.
(0.05 < z < 0.3) galaxies (GAMA, Sloan Digital Sky Survey                   In the measurement process, control on two systematic fea-
(SDSS), Liske et al. 2015; Ahumada et al. 2020). We can hence          tures is key: the emission of the background and the instrumental
stack X-ray data around galaxies in different bins of stellar mass,    signatures. To simplify our analysis, and in light of the expected
and distinguish between star-forming and quiescent ones.               spectral energy distribution of the signal we are interested in,
    A brief description of the data used is presented in Sect. 2.      we focus here on the rest-frame energy range between 0.5 and 2
The method, close to that adopted by Anderson et al. (2015), is        keV. In doing so, we only consider the energy range where the
described in detail in Sect. 3. In Sect. 4, we discuss the measure-    background emission is dominated by the well-understood dif-
ments obtained, while in Sect. 5 we compare the measurements           fuse emission of the Milky Way and by the Cosmic X-ray Back-
with hydro-dynamical simulations. We discuss possible implica-         ground (e.g. Predehl et al. 2021; Liu T et al. 2021, Ponti et al. in
tions of our results for galaxy evolution in Sect. 6.                  preparation), while the contribution of the particle (un-vignetted)
                                                                       background is negligible. Moreover, we avoid the complex re-
                                                                       sponse of the lowest energy range (below ∼0.4 keV in the ob-
2. Data                                                                served frame) where both detector noise and the effects of the
                                                                       light leak on the TM5 and TM7 (see Predehl et al. 2021) could
2.1. eROSITA eFEDS data                                                introduce yet un-calibrated systematic effects. As in Brunner
                                                                       et al. (2021), we select good events from nominal field of view,
We use for this work the public Early Data Release (EDR)               exclude bad pixels, and keep events with PATTERN≤15, which
eROSITA event file of the eFEDS field (Brunner et al. 2021)2 .         includes single, double, triple, and quadruple events. Also, given
It contains about 11 million events (X-ray photons), detected by       the relatively low signal to noise ratio (SNR) achieved from rel-
eROSITA, over the 140 deg2 area of the eFEDS Performance               atively small galaxy samples, we only focus our attention on
Verification survey. Each photon is assigned an exposure time          broad-band photometric measurements. Work is ongoing on the
using the vignetting corrected exposure map. Photons close to          calibration of the low-energy response of eROSITA, and future
detected sources in the source catalogue are flagged (see de-          works will explore the possibility of stacked spectral analysis
tails in Sect. 3.2). These sources are catalogued as point-like        also in the 0.15–0.4 keV observed-frame energy range.
or extended based on their X-ray morphology (Brunner et al.                 We apply a bootstrap procedure to reliably estimate the mean
2021), and they are further classified (e.g. galactic, active galac-   expected background and its variance (Sect. 3.4). Finally, we es-
tic nuclei, individual galaxies at redshift z < 0.05, galaxy group     timate the spatial extent of the point source profile using an em-
and clusters) using multi-wavelength information (Salvato et al.       pirical point spread function (PSF) model based on the detected
2021; Vulic et al. 2021; Liu A et al. 2021; Liu T et al. 2021;         point sources in the same eFEDS field, as we describe in Sect.
Bulbul et al. 2021).                                                   3.5.

2.2. GAMA galaxy catalogue                                             3.1. Selecting galaxies
From the GAMA survey (Liske et al. 2015), we retrieve in the           We select central galaxies, most massive within their host dark
9hr field (SpectCatv27 and NQ> 2), about 40,000 galaxies with          matter halo, similarly to Planck Collaboration et al. (2013). For
a spectroscopic redshift in the range 0.05≤ z ≤0.3 with mea-           each GAMA galaxy, we infer its host halo mass and corre-
sured stellar mass and specific star formation rate (sSFR) from        sponding virial radius with the stellar to halo mass relation from
Bellstedt et al. (2020, 2021). They are derived using spectral en-     Moster et al. (2013). If a galaxy lies within twice the virial ra-
ergy distribution fitting (Robotham et al. 2020). They adopt a         dius of a galaxy of higher stellar mass, it is considered as a satel-
Chabrier initial mass function and SFRs are averaged over 100          lite and removed from the sample. The choice of two times the
Myr. Stellar masses are output in unit of solar mass (M ) and          virial radius is a conservative one, to account for the scatter in
                                                                       the stellar mass to halo mass relation. We treat separately the X-
2
    https://erosita.mpe.mpg.de/edr                                     ray detected eFEDS clusters (Liu A et al. 2021) for which we
                                                                                                                Article number, page 3 of 23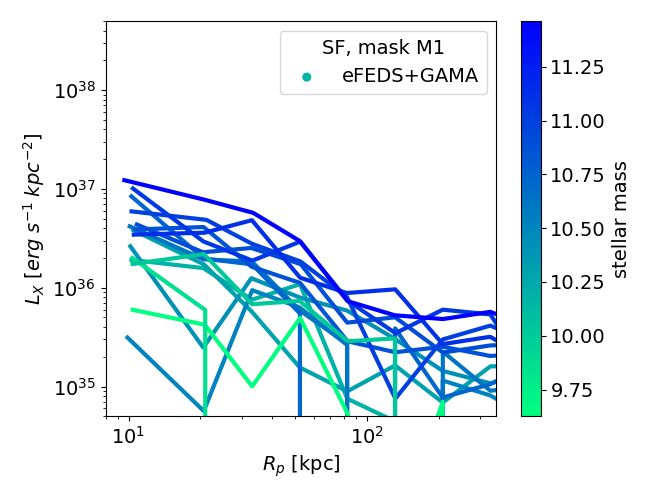
A&A proofs: manuscript no. main

Table 1. Samples considered in the analysis.                                 Each population, star-forming or quiescent, is then split in a
                                                                         number of non-overlapping stellar mass sub-samples (see Table
      Sample           stellar mass         Ng       Average             1). As stellar mass correlates with X-ray luminosity (Anderson
        name        min         max               M̄      z̄             et al. 2015), to obtain a similar signal to noise from the various
   ALL_M10.7        10.4        11.0     16142 10.7       0.22           sub-samples, fewer galaxies are needed at higher mass than at
                        Fixed stellar mass selection                     lower mass. So, we create sub-samples of ∼2000 at the low mass
    QU_M10.7        10.0        11.0      7267 10.72 0.2                 end, then 1000, 400 and finally 50 galaxies at the high mass end.
    SF_M10.7        10.4        11.0      9846 10.66 0.23                Table 1 details the exact number of galaxies present in each sub-
                             Quiescent galaxies                          class. There, we also report the mean redshift and mean stellar
   QU_M11.71        11.616 11.973            50 11.71 0.27               mass for each sub-sample defined in this way.
   QU_M11.58        11.556 11.616            50 11.58 0.27
   QU_M11.54        11.523 11.556            50 11.54 0.26
                                                                         3.2. Masking approaches and possible sources of
   QU_M11.35        11.306 11.41           400 11.35 0.25
                                                                              contamination
    QU_M11.2        11.138 11.269         1002 11.2       0.25
   QU_M11.04        10.961 11.138         2000 11.04 0.24                As we are after faint diffuse emission, it is vital to remove (mask
   QU_M10.88        10.806 10.961         1999 10.88 0.23                out) as much as possible all sources of contamination produced
   QU_M10.73        10.641 10.806         1999 10.73 0.21                by un-resolved emission from compact sources within galaxies.
   QU_M10.53        10.362 10.641         2000 10.53 0.19                In this work, we investigate four possible masking schemes (see
                            star-forming galaxies                        Table 2):
    SF_M11.25       11.17       11.754     400 11.25 0.27
                                                                          (i) ‘ALL’ mask: all detected X-ray sources are masked;
    SF_M11.12       11.079 11.17           400 11.12 0.27
                                                                         (ii) ‘M1’ mask: all detected sources are masked except for those
    SF_M11.05       11.027 11.079          401 11.05 0.26
                                                                              associated with a cluster or a group in the same redshift range
    SF_M10.99       10.943 11.051         1000 10.99 0.26                     as the GAMA galaxies, as identified by Liu A et al. (2021)
     SF_M10.9       10.861 10.943         1001 10.9       0.25                or by Bulbul et al. (2021), taking CLUSTER_CLASS = 4 or 5,
    SF_M10.86       10.795 10.943         2000 10.86 0.25                     (see Salvato et al. 2021);
    SF_M10.74       10.68       10.795    2000 10.74 0.24               (iii) ‘M2’ mask: all detected sources are masked except for point
    SF_M10.63       10.574 10.68          2002 10.63 0.23                     sources in the redshift range of interest associated by Salvato
    SF_M10.52       10.467 10.574         1998 10.52 0.22                     et al. (2021) to a GAMA galaxy;
    SF_M10.41       10.358 10.467         2001 10.41 0.21               (iv) ‘M3’ mask: all detected sources are masked except for those
     SF_M10.3       10.241 10.358         2000 10.3       0.2                 unmasked by the M1 or M2 mask. The signal obtained is to
    SF_M10.18       10.108 10.241         2001 10.18 0.19                     be interpreted as the sum of all emitting entities: active galac-
    SF_M10.03       9.947       10.108    1998 10.03 0.18                     tic nuclei (AGN), X-ray binaries (XRB), hot gas, augmented
     SF_M9.86       9.761       9.947     2000 9.86       0.16                by systematic projection effects.
     SF_M9.64       9.491       9.761     2000 9.64       0.14
                                                                             The masking radius for each detected source (with a detec-
Notes. SF stands for Star-Forming and QU for Quiescent. We report        tion likelihood larger than 6) is its radius of maximum signal
the number of galaxies present in each sample (Ng ) and their average    to noise, as determined while extracting the X-ray spectrum of
properties: stellar mass ( M̄) and redshift (z̄).                        each source (Liu T et al. 2021), augmented by 40 per cent. By
                                                                         doing so, we make sure there is no remaining correlation be-
                                                                         tween the set of events outside of the mask and the source cat-
have individual measurements of R500c (Bahar et al. 2021). For           alogue (Comparat et al. in prep.). The optimal masking radius,
them, we only remove satellites falling within one virial radius,        derived with limited statistics on eFEDS data, suffers from un-
taken as R500c /0.7. After this filtering, ∼ 10% of the galaxies         certainties; augmenting the masking radius by 30% or 50% is
are removed, and we obtain a sample of 35,521 central galaxies.          also reasonable and corresponds to masking 2 per cent less or
Thanks to the high completeness (∼ 98%) of the GAMA sample,              more events, as shown in Table 2. This uncertainty on the to-
the sample of central galaxies should be also highly complete.           tal number of events directly impacts the normalization of the
We discuss limitations due to our sample definition in Sect. 6.2         profiles estimated. To account for this, we add a systematic 2%
                                                                         uncertainty on the background luminosity density (our normal-
    We use the reported stellar masses and specific star for-            ization), see Sect. 3.4.
mation rates to create sub-samples of the galaxy population.                 We use the sensitivity map to generate a catalogue of random
In order to examine trends, we split the population into star-           points following Georgakakis et al. (2008). Armed with this, we
forming and quiescent galaxies assuming a boundary fixed at              estimate that masking all X-ray sources removes 27.13% of the
log10 (sS FR) = −11 (see discussion by Davies et al. 2019;               events (and 6.9% of the area) in the 0.5–2 keV band. The least
Thorne et al. 2021). For this study, in which we stack around            stringent mask, ‘M3’, removes 24.14% of the events (and 6.1%
a large number of galaxies, the exact boundary definition should         of the area; see Table 2).
have a minor impact. Figure 1 shows the distribution of galaxies             The baseline mask used in this study is the M1 mask:
in the redshift range of interest in the mass-sSFR plane.                all sources are masked except for sources identified as galaxy
    To compare the star-forming and quiescent samples at fixed           groups or clusters at 0.05 ≤ z ≤ 0.3. Indeed, masking these ex-
stellar mass, we first adopt a stellar mass selection to obtain two      tended sources would bias low the X-ray profiles of high mass
samples with the same mean stellar mass, different sSFR and a            galaxies. The other masks enable us the investigation of system-
similar total number of galaxies. By taking objects within 10 <          atic effects due to the masking procedure. In particular, we will
log10 M ∗ < 11 for the quiescent and 10.4 < log10 M ∗ < 11 for           present a detailed comparison with the results from the M3 mask,
the star-forming galaxies, we obtain for both a mean stellar mass        which include in addition the emission from all the GAMA
of 5×10¹⁰ M with a set of 7,267 and 9,846 galaxies, respectively.        sources detected by eROSITA as point sources. These galaxies
Article number, page 4 of 23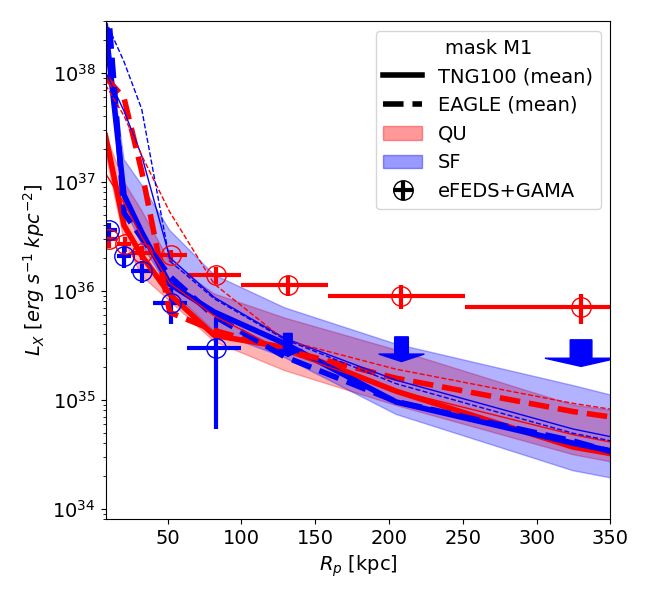
Comparat et al.: X-ray emission around GAMA galaxies in eROSITA/eFEDs

Table 2. Fraction of events masked                                        from the sample as possible. Given the moderate angular resolu-
                                                                          tion of eROSITA, however, this step is far from straightforward.
 mask          fraction of masked events            masked area               In order to assess our ability to remove AGN contaminants,
 name     % augmentation of masking radius           fraction             we discuss first the completeness of GAMA towards X-ray AGN
             40               (30, 50)                 amask              detected by eROSITA.
 ALL      0.2713         (0.2565, 0.2863)             0.069                   Within the eFEDS X-ray point-source source catalogue, con-
 M1        0.259          (0.245, 0.2732)             0.066               sidering all those counterparts in the GAMA 9h field and in the
 M2       0.2542         (0.2394, 0.2696)             0.065               redshift range 0.05 < z < 0.3, using either spectroscopic or
 M3       0.2414          (0.2275, 0.256)             0.061               high-quality photometric redshifts (see Salvato et al. 2021), we
Notes. Fraction of masked events for a radius of maximum signal to
                                                                          obtain 619 X-ray sources. Of these, 474 (76.6%) are matched
noise augmented by 30 to 50%. 40% is the baseline used in the analy-      within 200 to a galaxy present in the GAMA catalogue. When
sis. Masks are ordered by decreasing masked fraction. The percentage      limiting the X-ray catalogue to sources with an LS8 magnitude
of area masked corresponding to the 40% baseline is given in the last     r< 19.8 (19), similar to the magnitude limit used in GAMA,
column.                                                                   88.8% (90.2%) are matched to GAMA galaxies. This implies
                                                                          that, at the magnitude limit of GAMA, the galaxy catalog is
                                                                          nearly complete in terms of the bright X-ray point-source pop-
                                                                          ulation detected in eFEDS. In turn, this is consistent with the
                                                                          known spectroscopic completeness achieved by GAMA at these
                                                                          magnitude limits, and with the GAMA target selection, which
                                                                          uses a combination of criteria to exclude stars, while keeping
                                                                          compact galaxies and Quasar (QSO) (Baldry et al. 2010). The
                                                                          remaining bright unmatched X-ray sources are typically fainter
                                                                          in the optical than the GAMA limit; those are always masked out
                                                                          in the stacks.
                                                                              The point-sources X-ray flux limit of eFEDS; ∼ 6.5 × 10⁻¹⁵
                                                                          erg s−1 cm−2 in the 0.5–2 keV band (Brunner et al. 2021) cor-
                                                                          responds, at the redshift of the GAMA sources we are inter-
                                                                          ested in, to a rest-frame luminosity between about 5×1040 and
                                                                          2×1042 erg s−1 . Removing photons around all detected point-like
                                                                          X-ray sources that are matched to a GAMA galaxy (M1 mask)
                                                                          thus removes all the bright AGN from the sample. However,
                                                                          within the GAMA galaxy catalogues, a fraction of galaxies are
                                                                          expected to host faint AGN, which remain undetected given the
                                                                          eROSITA/eFEDS flux limit. Aird et al. (in preparation) study the
Fig. 2. Color-color diagram of the counterparts to all X-ray point        point source emission emerging from GAMA galaxy stacks (as
sources detected in eFEDS. Type 1 (un-obscured) AGN and Quasar            a function of stellar mass and redshift) to determine the faint end
(QSO) occupy the left part of the plot (pink contours), the stars the     of the AGN X-ray luminosity function. They measure and model
bottom right corner (blue contour) and galaxy-like spectral energy dis-   the average luminosity and the fraction of galaxies hosting an X-
tribution (characteristic of obscured AGN and passive galaxies) are in
between (grey contour); see Salvato et al. (2021) for more details. The
                                                                          ray AGN. For a stellar mass (log10 (M ∗ /[M ])) of 9.75 (10.75,
X-ray detected sources among the GAMA galaxy population are shown         11.75), they find an average luminosity of log10 (LX /[erg s−1 ]) ≈
as empty squares, color-coded by their soft X-ray luminosity. They sam-   40, (41, 42) and an occupation fraction of 0.1% (1%, 10%).
ple well the low-z QSO and the galaxy loci. By using the M3 mask,             We further discuss AGN contamination and compare these
which includes these sources, one clearly adds to the stacks emission     figures with our observations in Sect. 6.1.
coming from luminous and moderately luminous AGN.
                                                                          3.2.2. Expected X-ray binary signal
associated to an X-ray detected point source in the eFEDS cata-           X-ray binaries, end-points of stellar evolution, are known con-
log span the optical – near infra-red color-color plane in a similar      tributors to the total X-ray luminosity of a galaxy (Tauris & van
fashion as the complete X-ray sample in this redshift range, see          den Heuvel 2006). They are typically spatially distributed fol-
Fig. 2. Using the classification based on the broad band spec-            lowing the stellar light, and therefore their emission would be
tral energy distribution fits from Salvato et al. (2021) we note          unresolved by eROSITA at the redshift of interest here.
that GAMA galaxies matched to X-ray sources sample both the                   We evaluate the possible contribution from these (unre-
un-obscured AGN locus and, predominantly, the galaxy locus.               solved) X-ray binaries, by taking advantage of the known scal-
    Below, we discuss in more detail the possible contamination           ing relation between their total X-ray luminosity and their host
due to faint, undetected AGN or XRB, and the relationship with            galaxy properties. In particular, in order to predict the X-ray lu-
the alternative masking approaches.                                       minosity of X-ray binaries (XRB) emitted by each galaxy, we
                                                                          use an analytical model based on Lehmer et al. (2016) and Aird
3.2.1. Expected AGN signal                                                et al. (2017). They measured the dependence of the total XRB
                                                                          luminosity (in the 2–10 keV energy band) on redshift, galaxy
AGN X-ray emission is produced in a very compact (fraction                stellar mass and star formation rate. To make sure our predic-
of a milli-parsec) region close to the central supermassive black         tion is conservative, we use the Aird et al. (2017) model, which
holes in the nuclei of galaxies, and thus represent a contamina-          produces a 10-20% brighter XRB luminosity for a given galaxy
tion to the CGM signal. To ease the interpretation of the stacked         property. We use model 5 with parameters given in their Table 3
profiles, then, we would ideally remove as many active galaxies           to predict the X-ray luminosity in the band 2-10 keV. We prop-
                                                                                                                 Article number, page 5 of 23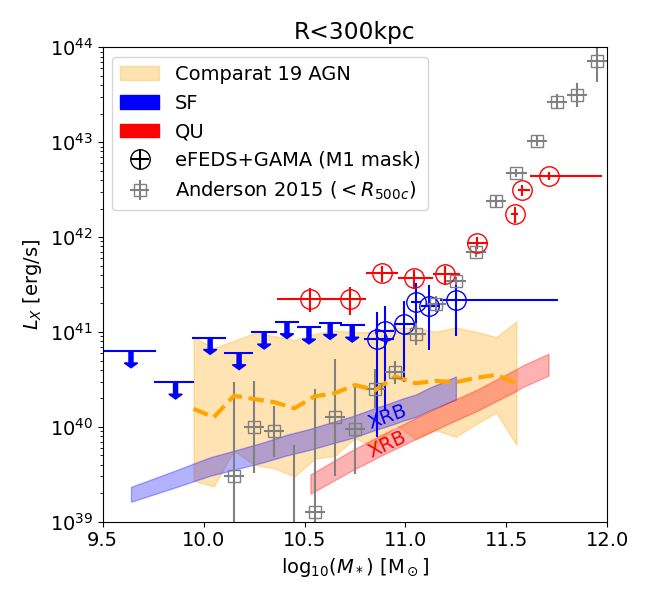
A&A proofs: manuscript no. main

agate the uncertainties from Table 3 to the prediction. We then             where r is the proper projected separation in kpc. For the full
                                                                                                      W (r)
convert (multiplication by 0.56) the luminosity to the 0.5–2 keV            sample, the correction RE
                                                                                                    REG (r) is 0.5% at 100 kpc, 1% at 300 kpc,
band assuming an absorbed (with nH column density set at mean               2.5% at 1000 kpc and 5 % at 2 Mpc. For the M1 mask, amask =
value of the field 4 × 1020 cm−2 ) power-law with a photon index            0.066, for other masks, values are given in Table 2.
of 1.8 (as suggested by Basu-Zych et al. 2020).                                  A surface luminosity projected profile, in erg s−1 kpc−2 , is
                                                                            obtained from the weighted (using wi ) histogram of projected
3.3. Stacking procedure                                                     separations to the galaxies (R p ) divided by the area in kpc2 cov-
                                                                            ered by each histogram bin: π(R11 − R20 )Acorr . Conversely, an X-
We assume a Flat ΛCDM cosmology with H0 = 67.74 km s−1
                                                                            ray spectrum, in erg s−1 keV−1 in a given projected radial aper-
Mpc−1 , Ωm (z = 0) = 0.3089 (Planck Collaboration et al. 2016).
                                                                            ture is obtained with the weighted sum of the energies (Er f ) of
     Each galaxy is characterized by its position on the sky and
                                                                            all events in a given energy bin, divided by the width of that bin
its redshift, as well as properties of its stellar population (mass,
                                                                            (in keV).
specific star formation rate). We denote a galaxy with the vector
G defined as
                                                                            3.4. Background estimation and its uncertainties
G = (GRA , G Dec , Gz , G M , G sS FR ).                              (1)
                                                                            The projected radial profiles and integrated spectra obtained with
    Given a galaxy, we retrieve all the events within the angle             the random cubes represent the null hypothesis of no signal, and
subtended by 3 Mpc at the galaxy redshift. We construct a ‘cube’            are used to assess the robustness of any possible detection from
of event surrounding each galaxy. For each event, we compute                the stacking samples. We repeat this measurement process at ran-
a rest-frame energy by multiplying the energy by one plus the               dom positions twenty times (using different random points each
galaxy redshift: Er f = Eobs × (1 + Gz ). So, each eROSITA event            time). From the outer shells of the radial background profiles
is characterized by the following vector: its position on the sky           (500 kpc to 3000 Mpc) of the 20 realizations, we estimate the
(R.A., Dec.), its rest frame and observed energy, the correspond-           mean background luminosity. It takes values around 1.1×1037
ing galaxy redshift, the exposure time and the on-axis telescope            erg s−1 kpc−2 . For each galaxy sample the background value ob-
effective area as a function of energy (ARF) at the observed en-            tained is different, indeed the total area covered and the masked
ergy, the projected distance (R p ) in proper kpc to the galaxy. We         area both vary from sample to sample.
denote an event with the vector E defined as
                                                                                The uncertainty due to the source masking procedure, see
E = (R.A., Dec., Eobs , Er f , Gz , texp , ARF(Eobs ), R p ).         (2)   Sect. 3.2, suggests that the total number of event is subject at
                                                                            most to a residual 2% systematic uncertainty. So, to be conser-
The exposure times are obtained from the vignetted exposure                 vative, we add a 2% systematic uncertainty to the mean value of
map (Brunner et al. 2021). Using the (angular) projected distance           the background: σBG = 0.02 i.e. at all scales and energies.
induces projection effects which we discuss in Sect. 6.2.                       The uncertainty on the galaxy√stack count rates follow a
    We repeat this procedure with sets of random locations in               Poisson distribution: σGAL = 1/ N GAL . The uncertainty on
the field, replacing the galaxy positions with randomly drawn               the final, background subtracted, measurement (i.e. galaxy mi-
positions in the same area of the sky, taking advantage of the              nus
relatively uniform exposure of the eFEDS field (Brunner et al.              p background) is thepquadratic sum of the two uncertainties:
2021).                                                                        (σGAL )2 + (σBG )2 = 1/N GAL + 0.022 .
    Finally, in order to derive accurate correction to the measured             Additional sources of uncertainties may arise from the use
fluxes for masking and boundary effects (due to the reduction of            of inaccurate redshifts, source positions or photon energies. Un-
projected area), we repeat the above procedure with another two             certainties on centering/positions could artificially cause the PSF
sets of random events. A first set of random events samples uni-            to broaden; uncertainties on energies could cause spectral distor-
formly the area covered in the GAMA field (REG ). A second                  tions; redshift uncertainties would cause both spectral and spatial
set of events samples uniformly the GAMA area and an addi-                  distortions. Since we use spectroscopic redshifts, we consider
tional 1.5 degree wide stripe around (REW ). This will allow us             the uncertainty coming from those to be negligible; however, one
to account for boundary-effects in the area normalization of the            could imagine that a few catastrophically incorrect redshifts are
background counts (see Sect. 3.4).                                          included. If for example, these are additionally located in bright
    We apply each selection defined in Table 1 to the galaxy sam-           clusters (illustrative purpose), we would incorrectly convert arc-
ple and to the random galaxy samples. We concatenate the event              minutes to kpc, which could cause either profiles to be more con-
sets obtained. For each galaxy sample, we obtain five ‘cubes’               centrated (redshift is lower than true redshift) or diluted (redshift
of events: galaxies-events (data cube), random galaxies-events              measured is higher than true redshift). The exact quantification
(random cube), point-source galaxies-events (point source cube,             of a possible systematic arising from catastrophic redshift, incor-
detailed in Sect. 3.5), galaxies-REG cube, galaxies-REW cube.               rect source positions or photon energies is left for future studies.
    Each event in any of the cubes is weighted by the following
function:                                                                   3.5. Empirical point source profile and validation against
     Acorr (r) × 1.602177 × 10⁻¹² Er f 4πdL2 (Gz )                               AGN
wi =                                               ,                  (3)
                 ARF(Eobs )            texp × Ng                            As we are interested in detecting extended CGM X-ray emis-
                                                                            sion around galaxies, a key prerequisite is an accurate charac-
where Ng is the number of galaxies in a sample (given in Ta-                terization of the eROSITA Point Spread Function (PSF) and its
ble 1). Acorr is the area correction term, which accounts for both          convolution with the galaxies’ redshift distribution.
boundary effects and masks:
                                                                                To obtain an empirical point source profile to compare
                  REW (r)                                                   to each galaxy sample, we repeat the procedure described in
Acorr (r) = 1 +           + amask ,                                   (4)   Sect. 3.3 with sets of detected X-ray point sources in eFEDS
                  REG (r)
Article number, page 6 of 23
Comparat et al.: X-ray emission around GAMA galaxies in eROSITA/eFEDs

                                                                            3.6. Validation

                                                                            To validate the stacking procedure, we apply it to known
                                                                            (eFEDS-detected) active galactic nuclei (with measured spectro-
                                                                            scopic redshift). We stack at the spectroscopic AGN redshift.
                                                                            Its integrated luminosity (in erg s−1 ) amounts to log10 (LX ) =
                                                                            42.72 ± 0.08, while the mean luminosity of the same AGN set
                                                                            as determined by Liu T et al. (2021) is log10 (LX ) = 42.75. The
                                                                            background subtracted X-ray spectrum obtained is well fit by a
                                                                            power-law with a photon index of 2.05±0.05, compatible with
                                                                            the mean slope of 2.02 determined on the same sample by Liu T
                                                                            et al. (2021). So the projected luminosity profile and stacked
                                                                            spectra are in very good agreement with the mean of the mea-
                                                                            surements made on individual AGN.

                                                                            4. Results
                                                                            We discuss first the detection in the stacking experiment for the
                                                                            full sample (Sect. 4.1). We consider to have a ‘detection’ when
                                                                            the signal to noise is larger than 3, a ‘hint of detection’ if the
Fig. 3. eROSITA normalized point source profiles as a function of red-
                                                                            signal to noise is between 1 and 3, and an ‘upper limit’ when the
shift in bins of 20kpc. Each curve represents the average point source      signal to noise is smaller than 1.
profile in a redshift bin of width of 0.05: 0.05-0.1, 0.1-0.15, 0.15-0.2,       In Sections 4.2 and 4.3, we discuss the trends obtained when
0.2-0.25, 0.25-0.3. The labelled number gives the mean redshift of the      splitting the sample according to its specific star formation rate
bin. At the mean redshift of the sample (z ∼ 0.2), the half-width-half-     and stellar mass. The comparison with theoretical predictions
maximum of the empirical PSF corresponds to about 60 kpc.                   presented in Sect. 5 is done on the binned samples, where the
                                                                            stellar population is best controlled.
(’point source cube’). We replace the galaxy positions (on sky)
with positions of extra galactic point sources with moderately              4.1. Detection in the complete stack
bright fluxes 10−14 < F0.2−2.3keV /[erg cm−2 s−1 ] < 10−12 and
ERO_DET_LIKE > 20, taken from the Brunner et al. (2021) cata-               We first report the results of our stacking exercise applied to the
logue. All other galaxy quantities are kept, in particular the red-         sample of 16,142 galaxies at a mean redshift 0.22 and a mean
shift.                                                                      stellar mass of 10.7 (named ALL_M10.7). We focus here on the
     In doing so, we convolve the eROSITA PSF with the redshift             results obtained by three possible masking procedures: ‘ALL’,
distribution of the galaxy sample, and we obtain the shape of the           ‘M1’ and ‘M3’ (see definitions in Sect. 3.2).
radial profile expected if all sources were bright and point-like in            When applying the ‘ALL’ mask we obtain a detection above
the eROSITA images. Figure 3 shows how these empirical PSF                  the background, see Fig. 4, top left panel. The signal to noise is
profiles (in kpc) evolve as a function of redshift. The higher the          ∼3 within R p < 80 kpc. At larger radii (> 80 kpc), the signal
redshift, the broader the point source profile is. We do not stack          measured (magenta crosses) is consistent with the background
beyond redshift 0.3 to avoid a too wide PSF in kpc. At the mean             (green dashes). The shape of the profile is marginally more ex-
redshift of the sample (z ∼ 0.2), the half-width-half-maximum               tended than the maximal point source profile (grey step line).
of the empirical PSF corresponds to about 60 kpc.                               The detection significance increases when using the ‘M1’
     We stress here that the purpose of this exercise is not to de-         mask (Fig. 4, top middle panel) i.e. when the galaxy clusters
termine an accurate PSF profile for eROSITA (see e.g. Churazov              and groups detected by eROSITA in the GAMA galaxies’ red-
et al. 2020), but rather to have a term of reference to assess the          shift range are not removed before stacking. The signal to noise
possible extended nature of the profiles measured around galax-             accumulated within R < 80 kpc is about ∼5 (reported in Table
ies. Obviously, the stacked profiles obtained here from the de-             3). Compared to the ‘ALL’ mask profile, the ‘M1’ is brighter and
tected point sources are by construction much brighter than the             significantly deviates from the maximal point source profile.
stacked galaxy profiles (see Sect. 4 below). To ease comparison,                When using the ‘M3’ mask, i.e. when the galaxy clusters,
in each of the galaxy stack we present below, we re-scale the con-          groups and point sources detected by eROSITA among GAMA
volved PSF profile to match the central value of the galaxy pro-            galaxies are not masked, the signal to noise within 80 kpc in-
file, creating a ‘maximal Point Source’ (max PS) term of com-               creases to ∼13, see Fig. 4 (top right panel), and Table 4. The
parison3 .                                                                  overall stacked profile corresponds, qualitatively, to what is ex-
                                                                            pected with the addition of one (or multiple) bright unresolved
3
   PSF profiles could be artificially broadened due to the clustering of    sources.
the galaxies (Popesso et al. 2012). Complete simulations of the galaxy          Finally, to measure the mean projected emission coming
population and its X-ray emission would be needed over cosmologi-
                                                                            from around the galaxies, we subtract the background from each
cal volumes to enable a quantitative assessment. Indeed, we need to
generate a model to populate the full sky with X-ray emitting galaxies      stacked profile, see Fig. 4, bottom panels. There, background-
together with their circum galactic medium (possibly following simu-        subtracted profiles are shown out to 300 kpc. The possible de-
lations of the gas around galaxy clusters from Comparat et al. 2020a),      viation from a point source emission profile is made clearer by
which is beyond the scope of this article. We defer to future studies the   the comparison with the corresponding ‘max PS’ profile. Using
quantification of this effect.                                              the background-subtracted profiles, we measure the integrated
                                                                                                                   Article number, page 7 of 23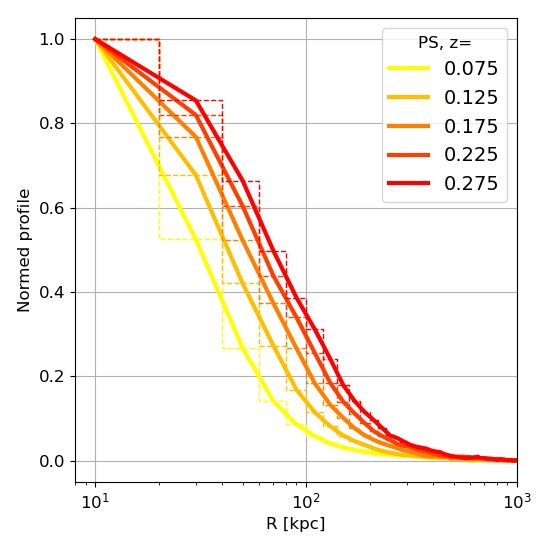
A&A proofs: manuscript no. main

Fig. 4. Measured X-ray radial projected luminosity profiles (0.5–2.0 keV rest-frame) for the ALL_M10.7 GAMA central galaxy sample (‘STACK’,
magenta crosses and shaded area). Each panel shows the result when a different mask is applied to the set of events: ’ALL’ (left), ’M1’ (middle),
’M3’ (right). Note the variation in the y-axis range in different panels. The green dashed line represents the background level, estimated as
discussed in Sect. 3.4. The profile shape expected if all sources stacked were point-like is shown with a grey line labeled ‘max PS’. The bottom
series of panels shows the background-subtracted profiles with a linear radial scale extending to 300 kpc.

projected luminosity in an aperture R p (in kpc) as follows:              et al. 2013), well below the halo mass of groups and clusters.
                                                                          We then search for the lower stellar mass boundary so that both
                r=R p                                                     samples have a mean mass of log10 (M ∗ /M ) ∼ 10.7, around
            Z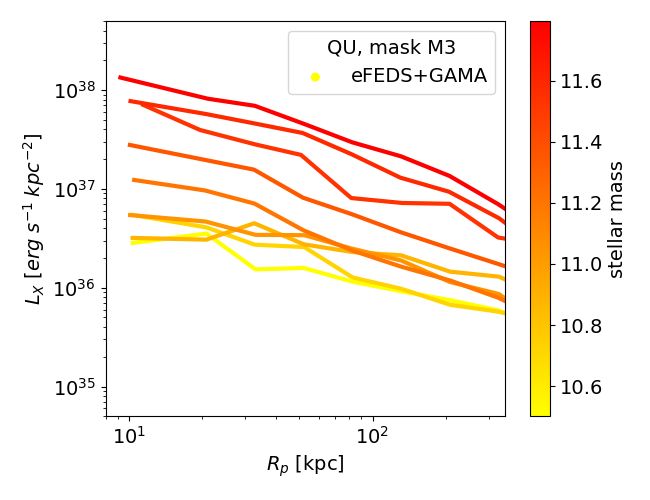
Comparat et al.: X-ray emission around GAMA galaxies in eROSITA/eFEDs

Table 3. Cylindrical projected X-ray luminosity using the M1 mask.

                        sample          log10 (Mvir )       S/N                         LX [1040 erg s−1 ]
                         name              halo          80    300    XRB           max PS R p
A&A proofs: manuscript no. main

Table 4. Cylindrical projected X-ray luminosity as in Table 3, but using the M3 mask.

                       sample         log10 (Mvir )       S/N                        LX [1040 erg s−1 ]
                        name             halo         80     300    XRB          max PS R p
Comparat et al.: X-ray emission around GAMA galaxies in eROSITA/eFEDs
Fig. 6. Measured X-ray radial projected luminosity profiles (0.5–2.0 keV rest-frame) for the quiescent QU_M10.7 (left, red) and star-forming
SF_M10.7 (right, blue) samples of central galaxies, using the M1 mask. Both samples have the same mean stellar mass of ∼ 1010.7 M and
mean redshift of z ∼ 0.2 (but see the underlying distributions in Fig. 5). QU_M10.7 (left) shows a clearly extended profile, while SF_M10.7
(right) has a profile compatible with that of a point source convolved with the eROSITA PSF (grey). The bottom row shows the corresponding
background-subtracted profiles.
within 1σ with that expected from X-ray binaries (1.4+0.4−0.3 × 10
40
we are not able to create lower mass bins. For the star-forming
−1
erg s ). The profile also does not appear extended. We are led samples, we define samples down to stellar masses of 3×10⁹ M .
to conclude that around star-forming galaxies of a mean mass For the M1 mask, we report a detection (S/N> 3 in 80 or 300
of log10 (M ∗ /M ) ∼ 10.7, an extended hot gas component is not kpc) for all quiescent samples and only for a handful of the star-
significantly detected. We refer the reader to Sect. 6.1 for a more forming galaxy samples, see Table 3. For the M3 mask, we report
comprehensive discussion of the AGN contamination. a detection for all samples except for the star-forming samples
With the M3 mask, compared to the M1 mask, the luminosity with a stellar mass lower than 1010 M , see Table 4.
of the QU sample increases by 20% while for the SF, it increases The set of background subtracted projected luminosity pro-
by a almost a factor of 6. There may be a hint of extent emission files obtained in the M1 (M3) mask are shown in Fig. 9, left
in the SF profile measured on the larger scales between 200 and (right) panels. The qualitative trend observed for the quiescent
300 kpc. samples (M1 or M3 mask) is in line with expectations: the higher
the stellar mass (and thus host halo mass), the brighter the emis-
4.3. Trends with stellar mass sion and the higher the signal to noise (Tables 3, 4). For the star-
forming samples, with the M1 mask, all profiles, but those at the
We further investigate trends as a function of stellar mass and highest-mass end, are broadly consistent with one another on
specific star formation rate with the set of samples specified in large scales and are dominated by noise. A difference between
Table 1. For the quiescent samples, we are limited by the total profiles arises in the first radial bins, e.g. the mean brightness
number of galaxies available in the catalogue and unfortunately of the central point source scales with the stellar mass. For the
Article number, page 11 of 23A&A proofs: manuscript no. main
Fig. 7. Comparison of the background-subtracted projected luminosity profiles (0.5–2.0 keV rest-frame) of the star-forming sample SF_M10.7
and the quiescent sample QU_M10.7, i.e. of star-forming vs. quiescent galaxies at similar median stellar mass around the scale of the Milky Way
and Andromeda, albeit in the range 0.05 < z < 0.3. In the left (right) panel, results are given for the M1 (M3) mask and are the same as those of
Fig. 6 (8).
star-forming samples with the M3 mask, the amplitude corre- Still within 80 kpc (bottom left panel), only for the highest
lates with stellar mass at all scales, like for the QU profiles. This stellar mass quiescent galaxy samples, i.e. for stellar mass > 2 ×
follows the expectation that the mean AGN luminosity is cor- 1011 , corresponding to a halo mass & 5 × 10¹³ , we measure a
related with the host stellar mass (Aird et al. 2017; Comparat luminosity that is significantly brighter than the predicted point
et al. 2019; Georgakakis et al. 2019). Possible extended emis- source emission. This is due to the large amount of hot gas in
sion around star-forming galaxies remains to be significantly de- projection present in galaxy groups and galaxy clusters.
tected. Within 300 kpc, the X-ray luminosity measured around
SF samples is consistent with the predicted average point
sources’ emission (combination of AGN plus XRB, dominated
4.4. Scaling between X-ray projected luminosity and stellar by AGN emission). For stellar masses above 1011 , the emission
mass, M1 mask is marginally brighter than the expected point source contribu-
tion.
Figure 10 shows the scaling measured between X-ray luminos- We look at the 80-300 kpc shell show on the bottom right
ity and stellar mass within 300 kpc (main panel), in the inner 80 hand panel of Fig. 10. For the quiescent sample and stellar
kpc (bottom left) and in the shell 80-300 kpc (bottom right), all masses above log M ∗ ∼ 11.2, the measurements are in good
obtained with the M1 mask applied. Overall the signal to noise agreement with Anderson et al. (2015)4 . Below log M ∗ ∼ 11.2,
is highest in the central 80kpc, see Table 3. It decreases when the luminosity measured is significantly above that of Anderson
integrating to 300kpc. Indeed extending the integration to larger et al. (2015). We believe this is due to projection effects for the
scales, the signal increases marginally while the noise increases QU sample that preferentially lives in dense and hot environ-
much more, resulting in lower signal to noise. We find that the ment. We discuss this effect in Sect. 6.2.
X-ray luminosity correlates with the mean stellar mass. The Still in the 80-300 kpc shell, for the star-forming samples, we
trend for star-forming galaxies is different from that of quiescent only measure upper limits to the extended emission, except for
galaxies. However, there appear to be two regimes in the scaling the three highest stellar mass samples, where, however, the error
between X-ray projected luminosity and stellar mass. The inner bars extend to a low luminosity value, meaning only marginal
parts’ emission is dominated by point sources (AGN and XRB). detection, with signal to noise ∼1.3.
The outer parts’ emission is dominated by CGM emission.
In particular, within 80 kpc, the slope of both SF and QU 4.5. Scaling between X-ray projected luminosity and stellar
galaxies is similar to (but offset from) that predicted for XRB, mass, M3 mask
and consistent with the predicted unresolved AGN population The relation obtained with the M3 mask is to be interpreted as
(orange shaded area, Comparat et al. 2019). The AGN popula- the sum of all emitting entities: AGN, XRB, hot gas, augmented
tion is predicted using eROSITA mock catalogues filtered on X- by systematic projection effects. In that regard, there is no need
ray flux and optical magnitude to keep un-detected X-ray AGN to split as a function of projected separation. Figure 11 shows the
that are optically brighter than the magnitude limit of GAMA: scaling measured in the inner 300 kpc with the M3 mask applied.
F X < 6.5 × 10⁻¹⁵ erg cm−2 s−1 and r < 19.8. Those simulated We predict the AGN, the galaxy group and the galaxy cluster
AGN could be hosted by GAMA galaxies but would not have population using the eROSITA mock catalogue methods (Com-
been detected in eFEDS. The simulations used start to be in-
complete at stellar masses of 1010 M at z = 0.22, we thus limit 4
The slight discrepancy at the highest mass is likely due to the differ-
the prediction to above this mass. ence in aperture: 500c is larger than 300 kpc for a 1015 M halo
Article number, page 12 of 23Comparat et al.: X-ray emission around GAMA galaxies in eROSITA/eFEDs
Fig. 8. Same as Fig. 6, with the M3 mask.
parat et al. 2019, 2020a, Seppi et al. in preparation). For the AGN scatter in the model prediction, it is complex to quantitatively
population we select all X-ray AGN that are optically brighter assess the difference between the observation and the models.
than the magnitude limit of GAMA: r < 19.8. These model AGN
could be hosted by GAMA galaxies regardless of the fact that
they are (or not) detected in eFEDS. For the cluster and group 5. Comparison with simulated galaxies
population, no filter is applied. The black dashes represent the We elect the IllustrisTNG (hereafter TNG, Pillepich et al. 2018;
sum of the AGN and cluster contribution to this relation. We find Nelson et al. 2018; Naiman et al. 2018; Marinacci et al. 2018;
that the luminosity – stellar mass relation is in good agreement Springel et al. 2018) and the EAGLE simulations (Schaye
with the models, which demonstrates that the Comparat et al. et al. 2015; Crain et al. 2015) as our reference points for the
(2019, 2020a, Seppi et al. in preparation) are good models of the comparison of the results uncovered by eROSITA with the
large scale structure seen in the X-ray. predictions from current, state-of-the-art cosmological hydro-
dynamical simulations of galaxies. The reasons are multi-fold.
At high mass, above 2 × 10¹¹ M , the measurements are Firstly, both numerical projects provide flagship runs that en-
slightly below the model. This is likely due to the fixed 300 compass large enough volumes, and hence, large enough num-
kpc aperture used, which for these masses is smaller than the bers of galaxies for the construction of samples comparable to
R500c used in the cluster model. For masses below 2 × 10¹⁰ M , the ones inspected in this paper — there are 6,478 and 3,557
measurements are consistent with the AGN model prediction, galaxies with galaxy mass log10 M ∗ > 10 in the TNG100 (TNG)
meaning that a detection of CGM emission is unlikely. For stel- and Ref-L0100N1504 (EAGLE) boxes, respectively, solely at
lar masses between 2 × 10¹⁰ M and 2 × 10¹¹ M , the positive z = 0. This would not be the case with zoom-in projects, which
offset between the observations and models, is likely related to for massive galaxies are limited to examples of a few to a few
emission from the circum galactic medium and to projection ef- tens. Secondly, their outcomes have been contrasted to an ever-
fects. Given the uncertainties on the measurement and the large increasing set of observables, with galaxy populations at low and
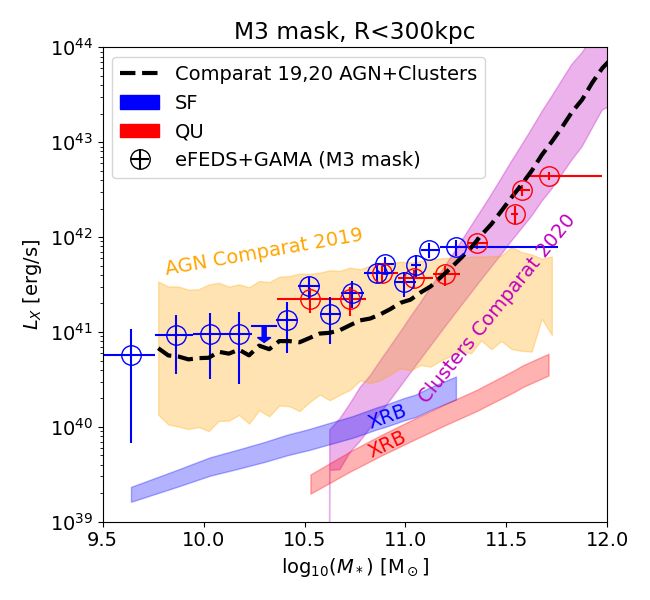
Article number, page 13 of 23A&A proofs: manuscript no. main Fig. 9. Comparison of the background subtracted projected luminosity profiles in the 0.5–2.0 keV rest-frame band (M1 mask, left panels; M3 mask, right panels) for quiescent (top) and star-forming (bottom) samples as a function of galaxy stellar mass. star-forming profiles are compatible with point source emission while quiescent profiles are clearly extended. intermediate redshift that are well in the ball park (
Comparat et al.: X-ray emission around GAMA galaxies in eROSITA/eFEDs

Fig. 10. X-ray 0.5–2 keV projected luminosity around central galaxies as a function of galaxy stellar mass and split into star-forming (blue symbols
and annotations) and quiescent (red) samples, computed using the M1 mask. Each eFEDS+GAMA detection is indicated with circles, upper limits
with downwards arrows. In the Main panel, we show the luminosity integrated within 300 physical projected kpc. In the Bottom Left Panel, we
show the luminosity integrated within 80 physical projected kpc. In the Bottom Right Panel, the relation is shown for the outer shell 80-300
projected kpc. Grey squares are the measurements from Anderson et al. (2015), computed within R500c (main panel) and within 0.15–1 R500c
(bottom right panel). The orange dashed line and shaded area in the main and bottom left panels shows the prediction from the AGN population
synthesis model (after excluding sources with F X > 6.5 × 10⁻¹⁵ erg s−1 cm−2 , as per M1 mask) of Comparat et al. (2019), with its uncertainty.

2001) package. There we assume an optically thin plasma in col-            ploy the table provided by Anders & Grevesse (1989) re-scaled
lisional ionisation equilibrium. For elements abundances we em-            by the overall metallicity of the gas cells6 .
                                                                           6
                                                                             We have checked that, by using the individual abundances of 9 ele-
                                                                           ments tracked by TNG100 instead of theArticle
                                                                                                                   overallnumber,
                                                                                                                           metallicity,
                                                                                                                                   pagethe
                                                                                                                                        15X-ray
                                                                                                                                           of 23
A&A proofs: manuscript no. main
Fig. 11. Same as Fig. 10 for the M3 mask (i.e. including detected point sources). Predictions based on the empirical AGN and cluster models from
Comparat et al. (2019, 2020a) (now including sources with F X > 6.5 × 10⁻¹⁵ erg s−1 cm−2 , as per M3 mask) are shown as orange (AGN) and purple
(groups and clusters) shaded area. The agreement between model and observations is remarkable. For stellar masses between 2 × 10¹⁰ M and
2 × 10¹¹ M , the positive offset between the observations and models, is likely related to a combination of emission from the CGM and projection
effects.
For each TNG100 and EAGLE galaxy matched to the eFEDS+GAMA results7 . Moreover, we defer to a future, dedi-
GAMA sample, we sum up the contribution to the total X-ray cated paper the task of simulating eROSITA photons as e.g. done
luminosity along the line of sight in a given projection by ac- for the tailored predictions of Oppenheimer et al. (2020). With
counting for all the gas cells or particles within the Friends-of- such a full forward-modeling into the observational space, we
Friends selection. To obtain projected X-ray profiles, we take the will then also be in the position of replicating, with the simu-
minimum of the potential as the galaxy center and we determine, lation data, exactly the stacking procedure adopted here for the
for each individual galaxy, the X-ray luminosity as a function of eFEDS+GAMA data. This would help in particular to quantify
radius in a random projection. We mimic the stacking signal of a the extent of projection effects along the line of sight.
specific galaxy sub sample, by taking the average (mean) of the
radially-binned X-ray luminosity values from all the simulated
galaxies in the matched sub sample. As the eFEDS stacking pro- 5.2. Results from IllustrisTNG and EAGLE
files are de facto weighted by the photon counts in each radial Results for the TNG100 and EAGLE galaxies in comparison to
bin, we believe that the mean profiles across individual simulated eFEDS+GAMA inferences are shown in Figs. 12 and 13, where
ones is the closest approximation to observed stacked signals. we focus, respectively, on the projected radial profiles at the tran-
We convolve the mean simulation profiles with the eROSITA sitional mass regime of 5 × 10¹⁰ M and on the integrated signal
PSF, but we do not remove from the simulation data those unre- from the CGM as a function of galaxy stellar mass, i.e. inte-
solved sources that are in fact detected and masked (M1) in the grating the X-ray luminosity between 80 and 300 projected kpc.
In both figures, shaded areas around TNG100 results quantify
the systematic uncertainties in the sample-matching procedure.
profiles of 5 × 10¹⁰ M galaxies vary by about 0.1 dex and overall by 7
The latter task requires modelling the X-ray emission not only from
negligible amounts in comparison to other systematic uncertainties (as the gaseous component but also from AGN and X-ray binaries, which
described in Sect. 5.2). is beyond the scope of the current paper.
Article number, page 16 of 23Comparat et al.: X-ray emission around GAMA galaxies in eROSITA/eFEDs
Fig. 12. Left: X-ray luminosity projected radial profiles (0.5–2.0 keV rest-frame) for the quiescent QU_M10.7 and the star-forming SF_M10.7
samples (as in Fig. 7 left panel), i.e. for central galaxies with median galaxy stellar mass of about 5 × 10¹⁰ M and median redshift 0.20. Their mass
and redshift distributions is shown in Fig. 5. They are compared to the results from the TNG100 (solid) and the EAGLE (dashed) simulations,
consistently matched in stellar mass, sSFR and redshift. Observed stacking results are compared to the mean simulated profiles (thick curves). We
convolve the simulated profiles with the PSF and obtain the thin curves. Right: complete set of profiles predicted by the simulation: mean (thick),
median (thin). The median profiles show where the majority of the simulated profiles are located, it is significantly lower than the mean. Shaded
areas represent the systematic uncertainties associated to the extraction of the mocked observable from the simulations (specifically for TNG100)
– see text for details.
These are obtained by encompassing the 5th–95th percentile re- tended emission around star-forming galaxies, but significantly
sults when: (i) marginalizing over the 20 Monte-Carlo sampling lower than the observed luminosity of the quiescent galaxies. To
realizations of the GAMA samples; (ii) using the total galaxy note, the simulations predict luminosities possibly larger than
stellar masses from the simulations vs. those within smaller aper- that observed by Anderson et al. (2015). The difference between
tures: twice half stellar mass radius; (iii) using from the simula- the simulated curves and the observations give a sense of the
tions the instantaneous and inner SFR values vs. those averaged maximal amount of luminosity that could be imputed to projec-
over the last 100 Myr. In the profiles of Fig. 12, for example, tion effects for quiescent galaxies.
these systematic choices can amount to X-ray luminosity uncer-
tainties of about 0.5–0.7 dex at 200–300 kpc projected radii.
Comparison below 80 projected kpc
It is manifest from Fig. 12 that both TNG100 and EAGLE pre-
Comparison between 80 and 300 projected kpc
dict much brighter atmospheres at small galactocentric distances
Focusing on the CGM, at galactocentric distances & 80 kpc, than what found with eFEDS+GAMA: up to two orders of mag-
the mean X-ray profiles of MW- and M31-mass galaxies pre- nitude brighter profiles at < 50 kpc. This is particularly interest-
dicted by TNG100 (solid) and EAGLE (dashed curves) are very ing because the simulation signals only come from the volume-
similar to one another, despite the different underlying galaxy filling gas, while in the observations, a part (if not all) of the
physics models: they both fall within approximately 1 dex from signal comes from unresolved point sources. This result calls for
the observational results. In fact, the profiles of the simulated further investigation.
star-forming vs. quiescent galaxies are not significantly different
from one another in the simulations, with the simulated X-ray
atmospheres around quiescent 1010.7 M galaxies being less lu- 6. Discussion
minous than what the observations imply in Fig. 12. The combination of eROSITA’s stable background and good sen-
Figure 13 shows a comparison between the observed ex- sitivity at moderate spatial resolution with the availability of a
tended (between 80 and 300 projected kpc) X-ray luminosity as highly complete spectroscopic galaxy sample from GAMA al-
a function of stellar mass and the simulations’ predictions for the lowed us to detect the faint X-ray emission around galaxies as
sample matched in redshift, mass and sSFR to the GAMA sam- a function of their measured stellar masses and specific star for-
ple. As for the case of the radial profiles, the CGM luminosity in mation rates.
the soft X-ray band as a function of galaxy stellar mass is not too The work presented here shows a clear dichotomy in the
dissimilar between TNG100 and EAGLE, with similar emission average X-ray emission of star-forming and quiescent galaxies.
for quiescent and star-forming galaxies at fixed stellar mass in While the former are only significantly detected on small scales,
both models. with a projected luminosity profile consistent with the eROSITA
For the quiescent massive galaxies, TNG100 and EAGLE are PSF and an intensity compatible with the faint end of the AGN
in good agreement with the observations, specifically at & 2 × population (with a possible contribution from XRB), the latter
1011 M . For . 1011 M galaxies, simulations predict a lower lu- show clearly extended projected emission, with increasing in-
minosity than observed, consistent with the non-detection of ex- tensity for larger stellar masses (at least for log10 M ∗ > 11.2).
Article number, page 17 of 23You can also read