Characterization of steady-state fluorescence properties of polystyrene latex spheres using off- and online spectroscopic methods - Atmos. Meas. Tech
←
→
Page content transcription
If your browser does not render page correctly, please read the page content below
Atmos. Meas. Tech., 11, 3987–4003, 2018
https://doi.org/10.5194/amt-11-3987-2018
© Author(s) 2018. This work is distributed under
the Creative Commons Attribution 4.0 License.

Characterization of steady-state fluorescence properties of
polystyrene latex spheres using off- and online
spectroscopic methods
Tobias Könemann1 , Nicole J. Savage2,a , J. Alex Huffman2 , and Christopher Pöhlker1
1 Max Planck Institute for Chemistry, Multiphase Chemistry Department,
P.O. Box 3060, 55020 Mainz, Germany
2 University of Denver, Department of Chemistry and Biochemistry, 2190 E. Iliff Ave., Denver, Colorado 80208, USA
a now at: Aerosol Devices Inc., 430 North College Avenue, Fort Collins, Colorado 80524, USA

Correspondence: Christopher Pöhlker (c.pohlker@mpic.de) and Tobias Könemann (tobias.konemann@mpic.de)

Received: 9 November 2017 – Discussion started: 8 February 2018
Revised: 8 June 2018 – Accepted: 12 June 2018 – Published: 6 July 2018

Abstract. Fluorescent dyed polystyrene latex spheres (PSLs)       sion spectra from bulk solutions are not immediately obvi-
are commonly used for characterization and calibration of in-     ous. On a single-particle scale, however, fluorescence inten-
struments detecting fluorescence signals from particles sus-      sity values increase with increasing particle size. No signif-
pended in the air and other fluids. Instruments like the Ultra-   icant effect in the fluorescence signatures was detectable by
violet Aerodynamic Particle Sizer (UV-APS) and the Wave-          comparing PSLs in dry vs. wet states, indicating that solvent
band Integrated Bioaerosol Sensor (WIBS) are widely used          water may only play a minor role as a fluorescence quencher.
for bioaerosol research, but these instruments present sig-          Because information provided by manufacturers of com-
nificant technical and physical challenges requiring careful      mercially available PSLs is generally very limited, we pro-
characterization with standard particles. Many other research     vide the steady-state excitation–emission matrices (EEMs)
communities use flow cytometry and other instruments that         of PSLs as open-access data within the Supplement. Deter-
interrogate fluorescence from individual particles, and these     gent and solvent effects are also discussed in order to pro-
also frequently rely on fluorescent PSLs as standards. Nev-       vide information not available elsewhere to researchers in
ertheless, information about physical properties of commer-       the bioaerosol and other research communities. These data
cially available PSLs provided by each manufacturer is gen-       are not meant to serve as a fundamental library of PSL prop-
erally proprietary and rarely available, making their use in      erties because of the variability of fluorescent properties be-
fluorescence validation and calibration very difficult.           tween batches and as a function of particle aging and ag-
   This technical note presents an overview of steady-state       glomeration. The data presented, however, provide a sum-
fluorescence properties of fluorescent and non-fluorescent        mary of spectral features which are consistent across these
PSLs, as well as of polystyrene-divinylbenzene (PS-DVB)           widely used fluorescent standards. Using these concepts, fur-
particles, by using on- and offline spectroscopic techniques.     ther checks will likely be required by individual researchers
We show that the “fluorescence landscape” of PSLs is more         using specific lots of standards.
complex than the information typically provided by manu-
facturers may imply, especially revealing multimodal emis-
sion patterns. Furthermore, non-fluorescent PSLs also exhibit
defined patterns of fluorescent emission originating from a
mixture of polystyrene and detergents, which becomes a cru-
cial point for fluorescence threshold calibrations and qualita-
tive comparison between instruments. By comparing PSLs of
different sizes, but doped with the same dye, changes in emis-

Published by Copernicus Publications on behalf of the European Geosciences Union.
3988                                             T. Könemann et al.: Characterization of steady-state fluorescence properties

1   Introduction                                                      In order to provide a solid foundation for the use and inter-
                                                                      comparison of instrumentation that relies on commercial flu-
Commercially available microspheres are widely used as                orescent PSLs, we performed measurements on fluorescent
tools in numerous scientific research disciplines (e.g., DNA          and non-fluorescent PSLs using both on- and offline spec-
hybridization probes, as tracers for blood flow and neuronal          troscopic techniques. Here we present a thorough character-
pathways), diagnostics (e.g., immunoassays), and size cal-            ization of the steady-state fluorescence properties of com-
ibrations (e.g., flow cytometry and microscope calibration)           mercially available PSLs that cover a fluorescence emission
(e.g., Härmä et al., 2000; Hiesinger et al., 2001; Katz and           range spanning UV (ultraviolet), vis (visible light), and near-
Iarovici, 1990; Luchtel et al., 1998; Schwartz et al., 1998;          IR (infrared) wavelengths. Information about the fluorescent
Spiro et al., 2000). Fluorescent polystyrene latex spheres            molecules used to dope commercial PSLs is typically propri-
(PSLs) play a particularly important role in the character-           etary and not publically accessible. As a result, steady-state
ization and calibration of instruments that rely on particle          excitation–emission matrices (EEMs) of PSLs are not pub-
autofluorescence (also called intrinsic fluorescence) detec-          lished by the manufacturer and can take even well-equipped
tion. For example, PSLs are commonly used for testing and             researchers significant time to investigate individually. We
calibration of instruments such as flow cytometers and light-         therefore provide fluorescence spectra of PSLs varied by flu-
induced fluorescent (LIF) instruments (e.g., Hasegawa, 2013;          orescent dye, manufacturer, and particle size as open-access
Healy et al., 2012; Jung et al., 2012; Kanaani et al., 2008;          data, revealing a more complete picture of the “fluorescence
Robinson et al., 2017; Toprak and Schnaiter, 2013).                   landscape” of PSLs as tools, which bioaerosol and other re-
   LIF techniques can be utilized for rapid characterization          search communities may utilize.
of bioaerosols, also referred to as primary biological aerosol           Since the size dependence of fluorescence intensity on
particles (PBAP). As a result, a number of real-time and com-         single-particle scale is crucially important for LIF-based
mercial instruments including the Ultraviolet Aerodynamic             PBAP detection (Hill et al., 2015; Sivaprakasam et al., 2011;
Particle Sizer (UV-APS; TSI Inc., Shoreview, MN, USA) and             Swanson and Huffman, 2018), we further address selected
the Waveband Integrated Bioaerosol Sensor (WIBS; Droplet              aspects of the PSL size–intensity relationship. However, it is
Measurement Technologies, Longmont, CO, USA) are being                important to note that a comparison of fluorescence inten-
commonly used in bioaerosol research communities (e.g.,               sities from different instruments (e.g., offline spectroscopy
Agranovski et al., 2003; Bhangar et al., 2014; Brosseau et            and microscopy as well as online WIBS-4A measurements)
al., 2000; Foot et al., 2008; Huffman et al., 2010; Perring et        is not trivial, as it depends on the properties of the fluores-
al., 2015; Stanley et al., 2011; Toprak and Schnaiter, 2013).         cent particles, on one hand, and on the optical design and
The main principle common to these techniques is the de-              detector settings of the instruments, on the other hand. There-
tection of intrinsic fluorescence from fluorophores such as           fore, we discuss certain intensity-related aspects here semi-
amino acids, coenzymes, vitamins, and pigments that ubiq-             quantitatively, whereas an in-depth analysis of single-particle
uitously occur in aerosols of biological origin (e.g., Hill et al.,   fluorescence intensities is beyond the scope of this work.
2009; Li et al., 1991; Pan et al., 2010; Pöhlker et al., 2012,           In this study, PSLs have been prepared in different ways
2013). These PBAP represent a diverse and dynamic subset              (e.g., directly from the vendor bottle and washed with ul-
of airborne particles, consisting of whole organisms like bac-        trapure water) to analyze and explain polystyrene-specific
teria, viruses, archaea, algae, fungi, and related reproductive       fluorescence patterns and effects from additives (e.g., de-
units (e.g., pollen, bacterial and fungal spores), as well as de-     tergents). Furthermore, because PSLs are usually stored in
caying biomass and fragments from plants or insects (e.g.,            aqueous suspension, we compared measurements in both dry
Deepak and Vali, 1991; Després et al., 2012; Jaenicke, 2005;          and wet states to distinguish the effect of water as a fluores-
Madelin, 1994; Pöschl, 2005). They are ubiquitous in the              cence quencher. These results will provide researchers fun-
Earth’s atmosphere, where they affect many environmental              damental information regarding fluorescent PSLs as key cal-
mechanisms and, therefore, represent an important link be-            ibrant particles on which they can base their instrument op-
tween ecosystem activities and atmospheric processes (e.g.,           eration, thus enabling results based on a more coherent set of
Andreae and Crutzen, 1997; Després et al., 2012; Fröhlich-            fluorescent properties.
Nowoisky et al., 2016; Fuzzi et al., 2006; Huffman et al.,
2013; Möhler et al., 2007; Morris et al., 2014).
   Because commercially available fluorescent PSLs are so             2   Materials and methods
critical to the underlying operation of many instruments,
their use forms indispensable and often unseen foundations            A list of acronyms and abbreviations used in this study can
onto which much of the UV-LIF instrumentation and liter-              be found in Appendix A. A summary of the sizes, properties,
ature are built. The information content provided by each             and commercial sources of all PSLs used in this study can
PSL manufacturer about fluorescent properties, composition,           be found in Table 1. Furthermore, Table 1 specifies which
and potential additives is limited, making their use in fluores-      of the subsequently outlined measurements have been con-
cence validation and calibration of LIF techniques difficult.         ducted for the individual PSL samples. PSLs from the fol-

Atmos. Meas. Tech., 11, 3987–4003, 2018                                                 www.atmos-meas-tech.net/11/3987/2018/
T. Könemann et al.: Characterization of steady-state fluorescence properties 3989
Table 1. Polystyrene latex spheres (PSLs) and polystyrene-divinylbenzene particles (PS-DVB) used in this study. Excitation wavelength
(λex ) and emission wavelength (λem ) are peak values reported by the manufacturer. FS is fluorescence spectroscopy and FM is fluorescence
microscopy. As a conventional expression (e.g., Hill et al., 2009, Pöhlker et al., 2012, Thermo Scientific Particle Technology-Product Catalog
and Technical Reference Guide printing CT6000.1_1/119), we use a backslash to separate excitation and emission wavelengths (λex / λem,
not to be confused with “divided by”).
Techniques and preparation
Diameter Material Color1 /dye λex /λem (nm) Provider Catalog Mixing ratio2 FS FM WIBS
(µm) code (µL)/(mL) wet dry wash filter
0.53 PSL Plum purple/proprietary 360/420 Bangs Laboratories Inc. FS03F 1/3.5 X X X X
0.96 PSL Plum purple/proprietary 360/420 Bangs Laboratories Inc. FS03F 3/3.5 X X
0.96 PSL Dragon green/proprietary 480/520 Bangs Laboratories Inc. FS03F 3/3.5 X X
1 PSL Blue/Firefli™ fluorescent blue 368, 388, 412/445, Thermo Fisher B0100 3/3.5 X
445, 473
1.9 PSL Dragon green/proprietary 480/520 Bangs Laboratories Inc. FS04F 6/3.5 X
1.93 PSL Non-fluorescent Non-fluorescent Polysciences, Inc. 19814 X
2 PSL Non-fluorescent Non-fluorescent Duke Scientific Corp. 5200A 6/3.5 X X X X
2 PSL Red/Firefli™ fluorescent red 542/612 Thermo Fisher R0200 1.5/3.5 X X
2 PSL Green/Firefli™ fluorescent green 468/508 Thermo Fisher G0200 6/3.5 X X X
2.1 PSL Blue/Firefli™ fluorescent blue 368, 388, 412/445, Thermo Fisher B0200 6/3.5 X X X X X X
445, 473
2.07 PSL Plum purple/proprietary 360/420 Bangs Laboratories Inc. FS05F 6/3.5 X
3.1 PSL Yellow green/proprietary 441/486 Polysciences, Inc. 17155 6/3.5 X X
4.52 PSL Non-fluorescent Non-fluorescent Polysciences, Inc. 17135 X
4.8 PSL Green/Firefli™ fluorescent green 468/508 Thermo Fisher G0500 6/3.5 X X X X
5 PS-DVB Non-fluorescent Non-fluorescent Thermo Fisher DC-05 X
10 PSL Yellow green/proprietary 441/486 Polysciences, Inc. 18140 9/3.5 X
25 PS-DVB Non-fluorescent Non-fluorescent Thermo Fisher DC-25 X
50 PS-DVB Non-fluorescent Non-fluorescent Thermo Fisher DC-50 X
1 Color terminology taken from manufacturer information. 2 The mixing ratio describes the amount of PSL stock solution (µL) diluted in ultrapure water (mL).
lowing four manufacturers were used in this study, with rel- via the “dye diffusion and entrapment” procedure (for de-
evant product information of the manufacturer’s websites: tails see Bangs Laboratories website). Accordingly, the flu-
orophores are distributed homogenously within the particles
– Thermo Fisher (Waltham, MA, USA, https: and are not covalently bound to the outside surface of poly-
//www.thermofisher.com/de/de/home/life-science/ mer matrix. This implies that the majority of fluorophores
cell-analysis/qdots-microspheres-nanospheres/ incorporated into the polymeric particles are not in contact
fluorescent-microspheres.html, last access: 31 Oc- with the water in aqueous PSL suspensions, reducing solva-
tober 2017); tochromism influences (e.g., polarity of the solvent), which
can result in shifts in absorption and emission spectra (Pel-
– Bangs Laboratories Inc. (Fishers, IN, USA, http://www.
lach et al., 2012).
bangslabs.com/products/fluorescent-microspheres, last
access: 31 October 2017), referring specifically to the 2.1 Fluorescence spectroscopy on PSLs in aqueous
TechNotes provided on the website, which summarize suspension
helpful peripheral information;
The EEMs of the PSL samples were recorded by using
– Polysciences Inc. (Warrington, PA, USA,
a LS-45 Luminescence Spectrometer (Perkin Elmer, Inc.;
http://www.polysciences.com/default/catalog-products/
Waltham, MA, USA) and the software FL WinLab (Perkin
microspheres-particles/polymer-microspheres/
Elmer, Inc.). Spectra were recorded at a photomultiplier tube
fluoresbrite-sup-r-sup-fluorescent-microspheres,
(PMT) voltage of 650 V and an emission scan speed of
last access: 31 October 2017);
1500 nm min−1 . Excitation wavelengths λex = 200–650 nm
– Duke Scientific Corp. (Palo Alto, CA, USA), whose (5 nm increments) and emission wavelengths λem = 200–
PSLs are now licensed by Thermo Fisher Particle Tech- 800 nm (0.5 nm increments) were used for the recording of
nology group. EEMs. Data were analyzed using Igor Pro (Wavemetrics,
Lake Oswego, OR, USA). Due to a subsequently detected,
In addition to PSLs, polystyrene-divinylbenzene (PS-DVB) wavelength-dependent spectral shift within the near-IR emis-
particles were also used in this study. The main chem- sion range of the LS-45 Luminescence Spectrometer, 2.0 µm
ical difference between PS-DVB particles and PSLs is red PSLs were measured with a Dual-FL Fluorescence Spec-
the polystyrene-divinylbenzene crosslinks to the styrene trometer (HORIBA Instruments Inc., Kyoto, Japan) and the
monomer, which polystyrene does not include. To our knowl- software Aqualog V3.6 (HORIBA Instruments Inc.). Emis-
edge, all fluorescent PSLs used here were internally labeled sions derived from other fluorescent PSLs are not affected by
www.atmos-meas-tech.net/11/3987/2018/ Atmos. Meas. Tech., 11, 3987–4003, 2018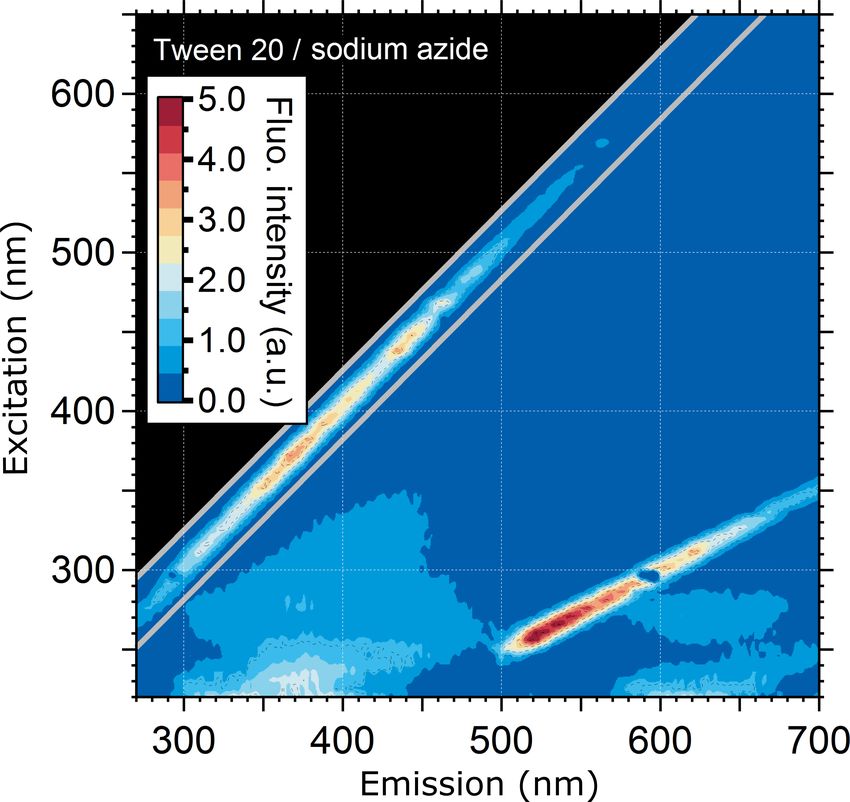
3990                                          T. Könemann et al.: Characterization of steady-state fluorescence properties

this artifact. The Dual-FL Fluorescence Spectrometer uses         2.2   Fluorescence spectroscopy on PSLs in dry state
a CCD as the emission detector. The EEM of red PSLs
was measured at excitation wavelengths between λex = 240          In addition to the FS analysis of suspended PSL samples, dry
and 650 nm (1 nm increments), an emission range between           PSLs were analyzed using a front surface accessory (Perkin
λem = 250 and 700 nm (0.58 nm increments) at a low detec-         Elmer, Inc.). The PS-DVB particles, which were purchased
tor gain setting (2.25 e− per count) and a exposure time of       in a dry state, were measured by placing the sample directly
2 s. Data were also analyzed using Igor Pro. It is important to   onto a synthetic fused silica window inside the surface holder
note that fluorescence intensity values of red PSLs measured      in a quantity such that the plane was fully covered. As de-
with the Dual-FL cannot be directly associated to fluores-        scribed by Pöhlker et al. (2012), fluorescent emissions from
cence intensities of PSLs measured with the LS-45 due to dif-     weakly fluorescent solids are qualitatively superimposed by
ferent instrument properties and settings. Further details on     light leakage and/or absorption effects contributing to high
the fluorescence spectroscopy (FS) measurements and anal-         background signals. We therefore normalized each fluores-
ysis can be found in Pöhlker et al. (2012).                       cence matrix by the intensity of light leakage (normaliza-
   Before preparing an aliquot, each PSL solution was vor-        tion factor, NF) to make fluorescence intensities compara-
texed for 30 s to break up possible agglomerates. The PSL         ble along all solid samples without altering or losing actual
solutions were diluted in 3.5 mL ultrapure water (MilliQ,         fluorescence features. Each solid sample matrix was divided
18 M) with a pH of 7 in a 10 × 10 × 40 mm UV quartz              by this NF. For further details regarding this normalization
cuvette (Hellma Analytics, Müllheim, Germany) (see Ta-            method, we refer to Pöhlker et al. (2012).
ble 1). To avoid sedimentation of PSLs in the cuvette dur-           PSL samples in dried state were analyzed by comparison
ing the measurements, a magnetic stirrer was used to con-         with aqueous PSL suspensions to investigate the influence of
stantly stir the sample. Measurements were taken directly af-     water as a potential fluorescence quencher (Lakowicz, 1999).
ter sample preparation. The background signal (ultrapure wa-      Here, several drops of PSL stock suspensions were dried by
ter) was measured under the same conditions and subtracted        placing them directly onto the synthetic fused silica window
from each sample. This procedure is called “wet preparation”      of the front surface accessory. In this state, the silica win-
throughout the paper.                                             dow was placed inside a clean laboratory fume hood under-
   The aqueous mass mixing ratio (mass PSL in mass wa-            neath an empty petri dish to prevent the sample from being
ter) of PSL particles in the stock suspensions is stated by       contaminated with airborne particles that could exhibit fluo-
the manufacturer as ∼ 1 % (see corresponding information          rescence. After the water evaporated from the droplets, the
from manufacturer websites). Accordingly, for PSLs of dif-        procedure was repeated by adding additional droplets until
ferent sizes, the number concentration of suspended PSL par-      the surface was completely covered with a solid PSL layer,
ticles decreases steeply with increasing diameter (N ∼ 1/d 3      which was then used for FS analysis. This procedure is called
based on the relationship between diameter and volume of          “dry preparation” throughout the paper.
an individual spherical particle). For the FS measurements,
diluted PSL suspensions were used to avoid self-quenching         2.3   Additional measurements and PSL preparation
of fluorescence and inner-filtration effects (Sinski and Exner,
2007). However, it is important to note that highly diluted       PSLs purchased in aqueous suspension are mixed by the
suspensions reduce the signal strength and counting statis-       manufacturer with additives such as detergents for the pre-
tics. Table 1 specifies the adjusted mixing ratios (volume of     vention of agglomeration. To determine the contribution
PSL stock suspension in volume of ultrapure water) for the        these additives make to resulting fluorescence emission,
individual PSL samples. Larger quantities (6 and 9 µL) of         PSLs were prepared in multiple ways as described in the fol-
the PSL stock suspension were used for particles with larger      lowing paragraphs.
diameters (≥ 1.9 µm) to partially compensate for decreasing          To remove PSL additives from the aqueous phase, small
PSL particle number concentrations. Because of the higher         volumes of PSL stock suspensions (see Table 1) were di-
sensitivity of the Dual-FL in comparison to the LS-45, only       luted into 1.5 mL ultrapure water and centrifuged for 5 min
1.5 µL of red PSL stock solution was diluted into 3.5 mL ul-      at 5.0 relative centrifugal force. The aqueous supernatant
trapure water. Otherwise, red PSLs were prepared identically      was discarded and the solid PSL pellet was resuspended in
to other PSLs measurements in aqueous solutions as stated in      1.5 mL ultrapure water. The procedure was repeated three
this paragraph. Note that independent of the size vs. number      times for thorough cleaning, though the last resuspension
concentration relationship, some uncertainty remains regard-      was performed in 3.5 mL ultrapure water. The resulting sus-
ing the PSL mixing ratio since agglomeration could occur          pensions of washed PSLs were analyzed by FS as outlined
upon aging of the suspensions.                                    in Sect. 2.1. This procedure is called “washed preparation”
                                                                  throughout the paper.
                                                                     FS was also performed on filtered PSL suspensions, i.e.,
                                                                  in the absence of solid PSL material. PSL stock suspensions
                                                                  were diluted into 3.5 mL ultrapure water and forced through

Atmos. Meas. Tech., 11, 3987–4003, 2018                                            www.atmos-meas-tech.net/11/3987/2018/
T. Könemann et al.: Characterization of steady-state fluorescence properties 3991
a syringe filter with a pore size of 200 nm (Macherey-Nagel, (e.g., Huffman and Santarpia, 2017). The WIBS-4A, in par-
Chromafil PET-20/15 MS) to filter out PSLs and other solid ticular, has been used for the purposes of both laboratory val-
fragments. The particle-free aqueous phase was measured in idations and longer-term ambient measurements (e.g., Healy
the absence of PSLs for soluble additives and/or detergents. et al., 2012; Hernandez et al., 2016; Huffman et al., 2013;
This procedure is called “filtered preparation” throughout the O’Connor et al., 2013; Perring et al., 2015; Robinson et al.,
paper. 2013; Savage et al., 2017; Toprak and Schnaiter, 2013). The
According to publicly available manufacturer informa- WIBS-4A provides information about particle size, a light
tion, one additive in aqueous PSL suspensions is the Tween scattering asymmetry factor (AF, broadly related to particle
20 buffer (polyethylene glycol sorbitan monolaurate) in com- shape), and fluorescence properties for individual particles
bination with sodium azide (registered trademark of Croda in real time. Single particles first cross a continuous wave
International PLC). Here it serves as a detergent to prevent diode laser (635 nm, 15 mW), which is used for particle de-
the coagulation of particles. The exact concentration of this tection, sizing (side scattering light), and scattering asymme-
detergent depends on the manufacturer. For comparison, we try (forward scattering light). After passing the diode laser,
used 6 µL of a Tween 20–sodium azide solution (Emd Milli- two xenon flash lamps are triggered to illuminate the parti-
pore Corp., 5037) in 3.5 mL ultrapure water for FS. cle at λex = 280 and 370 nm, respectively. The fluorescence
emission derived from each excited particle is collected by
2.4 Fluorescence microscopy on selected PSL samples two chamber mirrors and reflected onto two separate PMTs.
Each particle is excited separately by the two lamps, fired in
Microscopy analysis of selected PSL samples (i.e., 2.1 µm sequence, and thus a total of three channels of fluorescence
blue and 2.0 µm green) was conducted with fluorescence mi- emission intensity are acquired for each particle, referred to
croscopes (i.e., a BZ-9000 from Keyence, Inc., Osaka, Japan, as FL1, FL2, and FL3. The FL1 channel measures emit-
and an Eclipse Ti2 from Nikon, Tokyo, Japan). For the anal- ted light between λem = 310 and 400 nm (at λex = 280 nm),
ysis of the blue PSLs, an OP-66834 DAPI-BP (λex = 360/20, the FL2 channel measures between λem = 420 and 650 nm
λDichroic = 400, λem = 460/25 nm) fluorescence filter was (at λex = 280 nm), and the FL3 channel measures between
used. For the analysis of the green PSLs, an GFP-4050B- λem = 420 and 650 nm (at λex = 370 nm). Emission detected
000 (λex = 466/40, λDichroic = 495, λem = 525/50 nm) fluo- in the 310 to 400 nm band from the 370 nm excitation is not
rescence filter was used. detected because of PMT saturation. A detailed technical de-
A fraction of one drop of PSL stock suspension was mixed scription of the WIBS series can be found elsewhere (e.g.,
into one drop of glycerol gelatin (Sigma Aldrich) and placed Foot et al., 2008; Kaye et al., 2000, 2005; Savage et al., 2017;
between a specimen holder and a cover slip. The sample Stanley et al., 2011). The voltage settings used for all data
was used immediately after the glycerol gelatin had dried presented here are PMT1 (AF) 400 V, PMT2 (particle sizing
completely (< 5 min). Microscope settings were adjusted to and FL1 emission) 450 mV, and PMT3 (FL2, FL3 emission)
record images with fluorescence intensities just below the 732 mV.
detector saturation. The size and fluorescence intensity de- PSLs in aqueous solution were aerosolized by using the
termination of individual PSLs within the image was per- portable aerosol generator AG-100 (Droplet Measurement
formed by using ImageJ (Schneider et al., 2012). Fluores- Technologies, Longmont, CO, USA). For measurements of
cence images were converted to gray scale, a binary image both fluorescent and non-fluorescent PSLs by the WIBS-4A,
was obtained after conducting a thresholding, and then the one drop of the suspension was diluted into 10 mL ultrapure
mean gray scale intensity values were used as a relative mea- water. For the aerosolization setup, an additional diffusion
sure for the mean fluorescence intensity values. For a de- dryer was not utilized. This is because the major portion of
tailed description of the BZ-9000 fluorescence microscope water vapor from the aerosolization process evaporates inside
performance and related image analyses, we refer to Pöhlker the mixing chamber of the aerosol generator and distributions
et al. (2013). of particles were observed to match reported PSL diameters.
Thus, the outlet of the aerosol generator was directly con-
2.5 Online PSL analysis using the WIBS-4A nected to the inlet of the WIBS-4A. Data were analyzed by
using Igor Pro.
As already discussed, fluorescent PSLs are used by a wide For the determination of the median fluorescence intensity
variety of scientific fields to calibrate and test instruments. values recorded by the WIBS-4A, a histogram of the emis-
While it is beyond the scope here to present a wide variety sion signal in each of the detection channels was fitted with a
of technical examples, we found it instructive to choose one Gaussian function. The fluorescence intensity observed from
instrument and to include how factors relating to fluorescent individual particles is a function of both particle size and
PSLs can impact its application. Many LIF instruments de- the fluorescent quantum yield of the mixture of fluorophores
ployed for the rapid detection of bioaerosol particles have be- within the particle. Because the particles interrogated here
come commonly used within the bioaerosol community, and are relatively monodisperse PSLs, the particle size distribu-
a growing number of instruments are commercially available tion is assumed to be Gaussian. Thus, within a distribution of
www.atmos-meas-tech.net/11/3987/2018/ Atmos. Meas. Tech., 11, 3987–4003, 20183992 T. Könemann et al.: Characterization of steady-state fluorescence properties
particles of a single composition, the fluorescence intensity of blue PSLs (Thermo Fisher, Waltham, MA, USA) reports
is expected also to be Gaussian in nature. This assumption three fluorescence modes. Additional spectral information is
breaks down when observed fluorescence intensity saturates not available (Robin Pyzik-Shuler (Thermo Fisher) and Ben
the detector but can still be instructive for comparison of par- Nelson (Bangs Laboratories Inc.), personal communication,
ticles, as was discussed by Savage et al. (2017). 2017). The unspecified minor modes, unrelated to the dye
fluorescence, can be a crucial factor for the calibration of LIF
instruments. This is because many LIF instruments detect
3 Results and discussion fluorescence in broad emission bands that conflate emission
from the dye and polystyrene into a single detection channel,
3.1 Fluorescence signatures of PSLs in suspension which could be erroneously interpreted to correlate with dye
fluorescence. The excitation range λex = < 300 nm is particu-
Figure 1 shows EEMs from six different PSL suspensions,
larly susceptible to this issue because it can promote fluores-
each containing a different fluorophore. This figure high-
cence from the pronounced minor modes (see also Sect. 3.4).
lights the characteristic differences in the steady-state fluo-
In comparison to the fluorescence information stated by
rescence signatures of fluorescent dyes in particles nominally
each manufacturer in Table 1, FS measurements reveal
between 2 and 3 µm in diameter (see also Table 2). Additional
slightly different spectral locations of the mode maxima.
EEMs can be found in the Supplement Fig. S1. The six pre-
In general, the excitation wavelengths stated by manufac-
sented fluorophore types in Fig. 1 represent dyes covering a
turer’s specifications (Table 1) rather intersect the shoulders
spectral range of λem = ∼ 400 to 600 nm.
of the emission signal and do not match signal maxima as
Generally, the fluorescence modes of all PSLs are com-
we measured (Table 2). For example, red PSLs are stated
paratively broad, spanning emission bands of ∼ 100 nm or
to have a signal maximum at λex /λem = 542/612 nm (Ta-
more. In several cases, the fluorescence modes reveal a
ble 1), while the signal measured reveals a signal maximum
fine structure, with two emission peaks at the same ex-
at λex /λem = 525/579 nm (Table 2). PSL spectral information
citation wavelength, e.g., as a main mode1 with a shoul-
provided by each manufacturer should thus be seen as ap-
der (e.g., Fig. 1c and d; 2.0 µm green and 3.10 µm yel-
proximate values, while spectral properties may vary slightly
low green, respectively) or as two clearly separated main
depending on measurement conditions (e.g., pH of aqueous
modes (e.g., Fig. 1b; 2.1 µm blue). As a further general
medium). Nevertheless, the methods and conditions used by
feature, all fluorescent PSL samples measured within this
PSL manufacturers to determine fluorescence data are un-
study reveal a multimodal fluorescence signal, in which
known.
main and minor modes occur in the same emission band,
One similarity that fluorescent, non-fluorescent, and also
but being spectrally separated due to different excita-
PS-DVB particles show is a consistent signal in the approxi-
tion wavelengths. As an example, yellow green PSLs in
mate region of λex /λem = 220–260/290–350 nm, which is un-
Fig. 1d show a main mode at λex = 450 nm/λem = 483 nm
related to the emission signal derived from the embedded flu-
and minor modes at λex = 255 nm/λem = 483 nm as well as
orophores. The origin of this particular emission signal is de-
λex = 225 nm/λem = 482 nm. Note here that the specified ex-
scribed in detail in the following section.
citation and emission maxima in Table 2 for those modes that
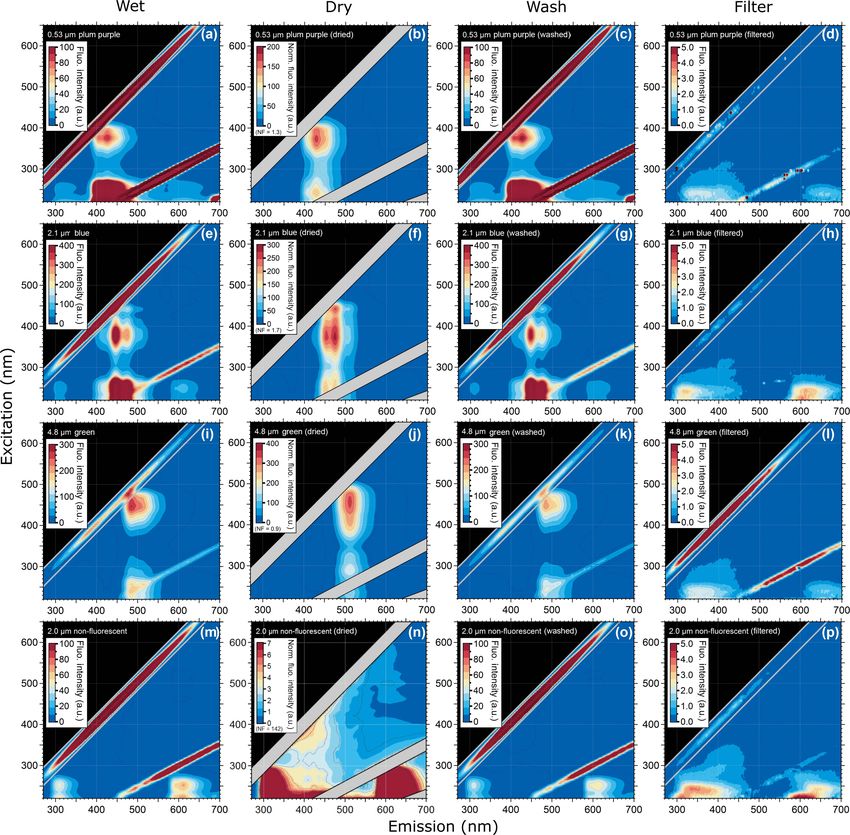
Figure 2 verifies that PSLs of different sizes, but with con-
overlap with the first- and second-order scattering bands (di-
sistent fluorophore, show the same spectral fluorescence sig-
agonal lines within EEMs) are approximate values with some
natures. Generally, fluorescence emission spectra are qualita-
uncertainty. The main mode for Fig. 1d (1λStokes = λem −
tively consistent between the two sizes analyzed for each par-
λex = 33 nm) represents the signal from fluorophore dye.
ticle dye. Note that for PSL bulk measurements, the fluores-
The minor modes (1λStokes = 228 and 257 nm) can probably
cence mode intensities are a function of the excited amounts
be explained by light absorption of the polystyrene matrix,
of fluorophore in the light path inside the cuvette, which
which is known to show pronounced UV absorption (Li et al.,
in turn depends on the size of the PSLs and their num-
1991), followed by energy transfer to the fluorophore which
ber concentration in suspension. Accordingly, slightly dif-
induces fluorescence emission. Note that energy transfer or
ferent mode intensities between 0.53 and 2.07 µm plum pur-
migration is a commonly observed phenomenon in fluores-
ple PSLs (Fig. 2a, b) and between 3.10 and 10.0 µm yellow
cence applications (e.g., Charreyre et al., 1995, 1997; Hennig
green PSLs (Fig. 2c, d) originate from different concentra-
et al., 2013).
tions of solids in aqueous solution as described above. Due
As can be seen in Table 1, PSL manufacturers only re-
to the uncertainty of the PSL number concentrations, the ab-
port fluorescence modes derived from a single excitation
solute intensities in the EEMs in Fig. 2 are not particularly
wavelength, which exclusively refers to the main mode. The
informative here. For non-fluorescent PS-DVB particles in
one exception to this observation is that the manufacturer
dry state, the signal pattern for 50.0 µm (Fig. 2e) reveals a
1 Subsequently, the term “main mode” will be used describing sharper signal peak at λex /λem = 287/337 nm compared to
the emission signals with a small Stokes shift and the term “minor 5.0 µm PS-DVB particles (Fig. 2f). This effect is likely based
mode” the emission signals with a large Stokes shift. on size-dependent surface structure of the dry PS-DVB sam-
Atmos. Meas. Tech., 11, 3987–4003, 2018 www.atmos-meas-tech.net/11/3987/2018/T. Könemann et al.: Characterization of steady-state fluorescence properties 3993 Figure 1. Excitation–emission matrix of selected PSLs showing multimodal steady-state fluorescence signatures. Fluorescence intensity values shown as arbitrary units (a.u.). Diagonal lines show first- and second-order elastic scattering (Zepp et al., 2004). The first-order elastic scattering occurs when the incident wavelength is equal to the emitted wavelength (λex = λem ) and the second-order elastic scattering is a diffraction grating effect where incident photons can also appear in an emission range doubled to the incident wavelength (2λex = λem ). Note that 2.0 µm red PSLs (F) were measured with the Dual-FL Fluorescence Spectrometer between λex = 240–650 nm and λem = 250 and 700 nm. The first- and second-order elastic scattering were subtracted automatically by the Aqualog V3.6 software. www.atmos-meas-tech.net/11/3987/2018/ Atmos. Meas. Tech., 11, 3987–4003, 2018
3994 T. Könemann et al.: Characterization of steady-state fluorescence properties
Table 2. Steady-state fluorescence signatures of PSL solutions. Excitation wavelength (λex ) and emission wavelength (λem ) are peak values
measured with the LS-45 Luminescence Spectrometer and the Dual-FL Fluorescence Spectrometer. Note that the lower emission detection
range of the Dual-FL is set to 250 nm for which the second minor mode for 2.0 µm red PSLs cannot be detected.
Diameter (µm) Material Color/dye λex /λem (nm) main mode λex /λem (nm) minor mode
0.53 PSL Plum purple/proprietary 376/425 250/425, 220/425
0.96 PSL Plum purple/proprietary 376/425 250/425, 220/425
0.96 PSL Dragon green/proprietary 500/520 303/513, 356/513
1.0 PSL Blue/Firefli™ fluorescent blue 377/447, 377/474, 442/475 250/447, 224/447
1.9 PSL Dragon green/proprietary 500/520 303/513, 356/513
2.0 PSL Red/Firefli™ fluorescent red 525/579 263/576
2.0 PSL Green/Firefli™ fluorescent green 445/481 255/481, 220/481
2.1 PSL Blue/Firefli™ fluorescent blue 377/447, 377/474, 442/475 250/447, 224/447
2.07 PSL Plum purple/proprietary 376/425 250/425, 220/425
3.1 PSL Yellow green/proprietary 445/483 255/483, 225/482
4.8 PSL Green/Firefli™ fluorescent green 445/485 255/486, 240/486
10.0 PSL Yellow green/proprietary 445/483 240/484
ples measured with the front surface accessory. The surface
configuration of a layer of large 50.0 µm PS-DVB particles
on the silica window may provide more surface structures
for light scattering and reabsorption than a layer of smaller
5.0 µm PS-DVB particles. Therefore, the subtle shift in signal
patterns may be interpreted as light refraction and scattering
artifacts.
It is important to note that physical properties of PSLs un-
derlie production processes, for which their quality cannot be
considered to be consistent and, therefore, might shift even
within the same production batch (Robinson et al., 2017).
Additionally, PSLs also undergo aging processes (e.g., via re-
actions with radical species and destruction of aromaticity),
which can result in, for example, decreasing fluorescence in-
tensities or size inaccuracies due to particle agglomeration
over time (Pellach et al., 2012).
3.2 Fluorescence emission variations after PSL
preparation
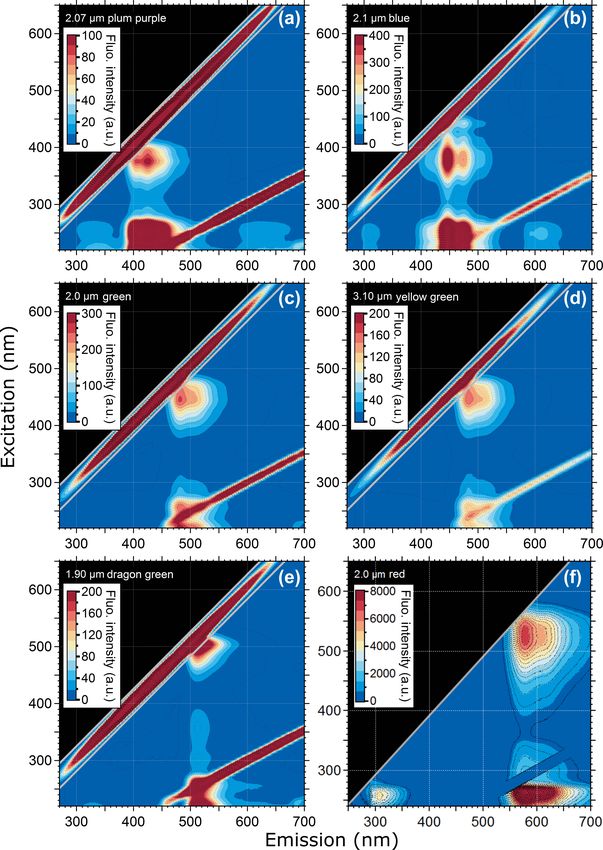
The EEMs of wet PSLs and after being dried, washed, and
filtered are shown in Fig. 3. In comparison to wet PSLs
(Fig. 3a, e, i, m), the EEMs of dried PSLs (Fig. 3b, f, j,
n) showed a higher fluorescence intensity and so a block-
ing filter (Perkin Elmer, Inc.) was used to decrease incoming
light by 99 % to prevent the PMT from being saturated. Note
that the blocking filter was used for all dry samples (fluo-
rescent and non-fluorescent PSLs, as well as PS-DVB par-
ticles), while all wet PSLs were measured without a block-
ing filter. The increased intensity for dry samples is due to Figure 2. Excitation–emission matrix of selected PSLs showing
the high concentration of particles on the silica window. Ad- multimodal steady-state fluorescence signatures in relation to PSL
ditionally, the water content for wet PSLs could act as a size. Compared are PSLs containing the same fluorophore but hav-
quencher decreasing fluorescence intensity values (Lakow- ing different sizes (except e and f, where no fluorophore is present).
icz, 1999). Even if the water background were subtracted PS-DVB particles in panels (e) and (f) are measured in dry state.
from the sample, a water layer on the PSL surface might af-
fect fluorescence properties due to water–fluorophore inter-
Atmos. Meas. Tech., 11, 3987–4003, 2018 www.atmos-meas-tech.net/11/3987/2018/T. Könemann et al.: Characterization of steady-state fluorescence properties 3995 Figure 3. Excitation–emission matrix of selected PSLs showing multimodal steady-state fluorescence signatures for different ways of PSL preparation. Shown are EEMs of wet PSL, similar to Figs. 1 and 2 (a, e, i, m), EEMs after PSLs were dried (b, f, j, n), washed (c, g, k, o), and filtered (d, h, l, p). actions. Overall, dried PSLs generally exhibit fluorescence ment of the sample. The 4.8 µm green PSLs are an excep- emission modes that are broader and more intense than wet tion to this statement, because the particles show a red shift PSLs. In contrast, signals near the second-order elastic scat- of the signal. While wet green PSLs show a main mode at tering lines, which are usually merged into a saturation mode λex /λem = 445/485 nm (Fig. 3i, Table 2), the main mode for for wet PSLs, are more distinct for dry samples. The peaks dry PSLs shifts to λex /λem = 454/510 nm (Fig. 3j). The red in the EEM are generally not affected by wetness state, only shift of the spectra may be a result of water–fluorophore in- showing minor variations (< 5 nm), which are related to in- teractions or light scattering and reabsorption effects, as de- strument performance, concentrations, and physical environ- scribed for 5.0 and 50.0 µm PS-DVB particles. On one hand, www.atmos-meas-tech.net/11/3987/2018/ Atmos. Meas. Tech., 11, 3987–4003, 2018
3996                                            T. Könemann et al.: Characterization of steady-state fluorescence properties

because of the high concentration of dried particles on the
silica window, inner filter effects, as described above, might
promote a spectral shift. On the other hand, dry PSLs with
smaller sizes (e.g., plum purple and blue PSLs; Fig. 3b, f) do
not show a recognizable shift for which this effect seems to
be rather size-dependent than based on inner filtering.
    To explain the potential polystyrene–detergent signal for
λex /λem = 220–260/290–350 nm occurring across all mea-
sured PSLs, particles were washed with ultrapure water to
remove any soluble additives (Fig. 3c, g, k, o). Neither emis-
sion pattern nor the fluorescence intensity values are af-
fected by removing additives from the aqueous phase, and the
spectra remain qualitatively unchanged. Nevertheless, spec-
tra of the filtered aqueous phase (Fig. 3d, h, l, p) reveal
a broad, but weak signal, which occurs for approximately
λex /λem =≤ 220–260/300–450 nm. This signal is likely to be
caused by a Tween 20 and sodium azide additive which is
a known detergent used by all four manufacturers to pre-
vent PSLs from agglomerating. To explore this hypothesis,
Fig. 4 shows the emission signal of Tween 20–sodium azide,
which exhibits a similar pattern to the spectral patterns of the     Figure 4. Fluorescence emission from a Tween 20–sodium azide
filtered PSL solutions (i.e., washing water including deter-         solution.
gents; Fig. 3d, h, l, and p). The results presented in Figs. 2, 3,
and 4 indicate that the signal consistent among all measured
PSLs and PS-DVB particles is likely to arise from a mix-             be especially aware of emission properties of PSLs in this
ture of polystyrene and/or detergent emissions. Differences          particular spectral range. Figure S2 highlights the EEM of
in signal patterns caused by the crosslinked divinylbenzene          2.0 µm non-fluorescent PSLs displayed with a lower fluores-
in PS-DVB particles are not obvious by direct comparison to          cence intensity scale (compare Fig. 3m), showing that the
PSLs. According to manufacturer information, dry PS-DVB              emission signal is not present above λex = ∼ 300 nm. Thus,
particles may contain trace amounts of dispersants, which are        instruments using excitation wavelengths in a UVA (320–
not further specified. The contribution of those specific dis-       400 nm) or vis range (400–700 nm) are not affected by the
persants to the emission signal can therefore not be explored        mixed polystyrene–detergent signal derived from PSLs.
independently. PS-DVB particles did not undergo washing
tests in this study, and so dispersants are still present in cur-    3.3   Fluorescence microscopy of PSLs
rent fluorescence measurements of these particles. Due to po-
tentially small amounts of dispersants, however, the emission        Results discussed above are based on bulk spectra averaged
signal for 5.0 and 50.0 µm particles (Fig. 2e, f) most likely        from several hundreds of particles per spectrum and may not
originates from polystyrene, while the filtered aqueous solu-        represent fluorescence properties of single particles. There-
tions (Fig. 3d, h, l, p) reveal emission signals from detergents.    fore, we performed fluorescence microscopy of 2.1 µm blue
Additional detergents beyond Tween 20 and sodium azide are           and 2.0 µm green PSLs. Figure 5b shows the size distribution
stated as proprietary by each manufacturer, for which the ex-        of PSLs observed between 1.7 and 3.0 µm, while the major-
act components for PSLs in aqueous solution are unknown.             ity of particles occur in a size range between 2.0 and 2.3 µm.
The detergent signals measured within this study can, there-         Only very few PSLs (3 out of 80 particles, Fig. 5a, b) re-
fore, include additional components affecting emission pat-          veal sizes which are far off from their nominal diameter (e.g.,
terns.                                                               2.9–3.0 µm, as marked by red arrows in Fig. 5a). According
    Even if the strength of the mixed polystyrene–detergent          to manufacturer information, the standard deviation of the
signal is considered to be low compared to fluorophore emis-         size of fluorescent PSLs is in general broader than those of
sions, it can still affect the calibration of LIF instruments us-    non-fluorescent PSLs for which they are not intended for size
ing excitation wavelengths in a UVB (280–315 nm) or UVC              calibrations.
(200–280 nm) range with simultaneously high detection sen-              The fluorescence intensity increases with increasing PSL
sitivity. In this context it is important to note that PSLs la-      size (Fig. 5b) due to the increasing amount of fluorophore
beled as “non-fluorescent” by the manufacturer show flu-             being excited. The relationship of the measured intensity, I ,
orescence emission when excited at λex < 300 nm. Thus, if            and particle diameter, D, can be described by a power law
non-fluorescent PSLs are used for the determination of flu-          fit I = A + BD y , typically with 2 ≤ y ≤ 3 (e.g., Hill et
orescent detection thresholds, the instrument operator must          al., 2015; Sivaprakasam et al., 2011; Swanson and Huffman,

Atmos. Meas. Tech., 11, 3987–4003, 2018                                                www.atmos-meas-tech.net/11/3987/2018/
T. Könemann et al.: Characterization of steady-state fluorescence properties 3997
Summarizing the fluorescence distributions in this way
can enable a comparison of similar PSL fluorophores to be
compared across instruments as a very rough intensity check.
These data may be used not only by WIBS users but also by
users of other UV-LIF instrumentation who may use such
data for fluorescence calibration, instrument alignment, and
excitation pulsing. Nevertheless, comparing the specifics of
the intensity values (e.g., Table 3) across different studies
should be treated with extreme caution. A number of in-
strumental factors, including gain settings of detectors used
for fluorescence detection, can significantly influence ob-
served fluorescence intensities, making direct comparisons,
even within similar instrumentation, challenging at best. In
this context it is worth noting that the data reported here
were recorded with the same WIBS unit used by Savage et
al. (2017). Moreover, Savage et al. (2017) measured three
PSL samples (2.0 µm green, 2.0 µm red, and 2.1 µm blue –
same type and manufacturer, but different batches as those
used in present work) and the obtained results agree with the
results in Table 3. This suggests that the WIBS-derived PSL
fluorescence intensities in Table 3 can be compared to the
fluorescence intensities of the extent library of fluorescent
materials and standard organisms in Savage et al. (2017).
As outlined in Sect. 3.3, the single-particle fluorescence
intensity increases steeply with particle size. Accordingly,
Figure 5. Fluorescence microscopy of 2.1 µm blue PSLs. Panel comparatively large PSLs saturate the WIBS detector at some
(a) shows the microscopy image of 80 particles in total, while panel point depending on the detector gain settings. For the WIBS
(b) contrasts PSL size vs. fluorescence intensity (left axis) and PSL settings used here, saturation occurs for PSL sizes > 2 µm.
size vs. particle counts (right axis). Red arrows in panel (a) mark Specifically, the main mode of 2.1 µm blue PSLs saturates
PSLs with sizes between 2.9 and 3 µm. channel FL3, the minor mode of 3.1 µm yellow green PSLs
saturates FL2, and 4.52 µm non-fluorescent PSLs saturate
FL1. Obviously, PSLs that tend to saturate the WIBS detec-
tor are inappropriate for fluorescence intensity checks and
2018). Hill et al. (2015) reported that small and/or slightly
spectral validations. For routine performance checks using
absorbing particles typically show y approaching 3 (i.e., vol-
the WIBS settings outlined in Sect. 2.5, we recommend the
ume dependence), whereas rather large and/or absorbing par-
use of 1.0 µm blue, 2.0 µm green, and 2.0 µm red PSLs. Cru-
ticles show y approaching 2 (i.e., surface dependence). The
cially important for LIF users is the observation that nomi-
microscopy-based results obtained here agree well with this
nally non-fluorescent PSLs indeed show fluorescence emis-
y range: For 2.1 µm blue PSLs we observed y = 2.6 ± 0.5 and
sion in the UV range that can be strong enough to even sat-
for 2.0 µm green PSLs we observed y = 2.9 ± 0.2 (Fig. S3).
urate LIF instrument detectors (i.e., the WIBS FL1 chan-
nel). Although weak in comparison to the PSL fluorophore
3.4 PSL measurements with the WIBS-4A modes (Fig. 3), the responsible polystyrene–detergent signal
becomes dominant for large PSL sizes due to the steep inten-
The use of commercially available fluorescent PSLs is crit- sity increase with particle size. The issue of fluorescence in-
ical for the accurate operation of a number of atmospheric tensity calibration within UV-LIF instruments is sufficiently
instruments, including the WIBS and other UV-LIF instru- important and problematic that it has been discussed by a
ments for bioaerosol detection. As a perspective of the im- number of authors. In particular, Robinson et al. (2017) de-
portance of understanding PSL properties, eight PSL types veloped a fluorescence calibration strategy for WIBS chan-
were analyzed using the WIBS-4A. A summary of data pa- nels FL1 and FL2. The issue requires continued attention,
rameters for each collection of PSLs analyzed is summarized however, from the UV-LIF community. It is also important
in Table 3. The purpose of the analysis is to show how the to mention that previous works using the WIBS-4 utilized
variability of fluorescence properties may be interrogated on detector gain switching, which allowed detection of highly
a single-particle basis and how the WIBS-4A may be uti- fluorescent or large (low gain) particles along with weakly
lized to differentiate between the particles as a resource for fluorescent or small (high gain) particles (Healy et al., 2012).
UV-LIF users. This feature is not present in the WIBS-4A commercialized
www.atmos-meas-tech.net/11/3987/2018/ Atmos. Meas. Tech., 11, 3987–4003, 20183998 T. Könemann et al.: Characterization of steady-state fluorescence properties
Table 3. PSLs measured with the WIBS-4A. Median fluorescence intensity observed (± 1 standard deviation) shown for each fluorescence
channel, in arbitrary units (a.u.). At 2046 arbitrary units, emissions are marked as “saturation”. Excitation wavelength (λex ) and emission
wavelength (λem ) are peak values reported by the manufacturer.
Diameter Material Color/dye λex /λem (nm) FL1 (a.u.) FL2 (a.u.) FL3 (a.u.)
(µm)
0.96 PSL Plum purple/proprietary 360/420 19 ± 13 28 ± 13 69 ± 14
0.96 PSL Dragon green/proprietary 480/520 16 ± 10 32 ± 10 43 ± 11
1.93 PSL Non-fluorescent Non-fluorescent 94 ± 26 7±3 34 ± 6
2.0 PSL Red/Firefli™ fluorescent red 542/612 36 ± 17 128 ± 17 45 ± 12
2.0 PSL Green/Firefli™ fluorescent green 468/508 71 ± 19 1052 ± 72 188 ± 25
2.1 PSL Blue/Firefli™ fluorescent blue 368, 388, 412/445, 445, 473 379 ± 79 1765 ± 105 Saturation
3.1 PSL Yellow green/proprietary 441/486 727 ± 109 Saturation 577 ± 64
4.52 PSL Non-fluorescent Non-fluorescent Saturation 19 ± 10 36 ± 8
by DMT, Inc., but is being explored by more recent genera- orescence response most likely originates from the polymer
tions of various UV-LIF instruments. matrix. For PSLs in solution, the emission pattern is likely
Most UV-LIF instrument users rely on fluorescent PSLs to result from a mixture of polystyrene and detergents (e.g.,
for some aspect of their studies. Ultimately, more work will Tween 20–sodium azide). Changes in emission spectra were
be required to develop more stable and generally accepted not detected as a function of increasing particle size.
particle fluorescence calibration standards that can be ap- Dried PSLs did not reveal significant EEM changes com-
plied reliably across instruments, time, and geography. One pared to PSLs in the wet state. Even if a potential water
such example is the recent work presented by Robinson et layer on PSLs may act as a fluorescence quencher, the inter-
al. (2017), who used a mixture of tryptophan and ammonium ference on measurements appears insignificant. By washing
sulfate to calibrate one fluorescence channel and pure quinine PSL solutions with ultrapure water to remove additives, flu-
to calibrate a second channel. The authors of this paper did orescence emission patterns were shown not to be affected.
not, however, present a strategy to calibrate the third WIBS The filtered aqueous phase (soluble surface coatings of PSLs
channel (FL3). in the absence of particles) showed an emission signal similar
to the fluorescence response of Tween 20–sodium azide solu-
tions, which is commonly used as a detergent to prevent PSLs
4 Conclusions from agglomerating. Since further additives are proprietary,
it is unknown in how far these additives might contribute to
This study presents an overview of relevant physical prop- the overall emission signal. Because of the partially spec-
erties of fluorescent and non-fluorescent PSLs utilizing on- tral overlap of the polystyrene and Tween 20–sodium azide
and offline techniques (fluorescence spectroscopy, fluores- signal, we were not able to distinguish both emissions from
cence microscopy, and WIBS-4A detection). We analyzed 18 each other with the techniques used in this study. Addition-
different particle standards (PSL and PS-DVB particles) that ally, the signal strength of Tween 20–sodium azide is rather
are commonly used for the characterization and validation of low compared to the emission of polystyrene, making a dif-
LIF instruments. ferentiation challenging.
The steady-state fluorescence emission spectra of PSLs On a single-particle scale, PSLs from one production batch
shown here are slightly different than values reported by each were shown to be uniform, only deviating slightly in size
manufacturer, likely due to the method used for fluorescence (±0.3 µm). Furthermore, the fluorescence intensity of single
determination, instrument performance, and particle concen- particles was shown to increase with increasing particle size
trations. Other conditions such as particle age, agglomera- which can be described by power law relationship with ex-
tion, and storage conditions could contribute to spectral dif- ponents between 2 and 3.
ferences. Moreover, in addition to the dominant fluorescence Many instruments utilize fluorescent PSLs for spectral cal-
modes, we observed an additional set of fluorescence modes ibration. This can be challenging for a number of reasons
at shorter excitation wavelengths (λex = < 300 nm), revealing that are important to discuss here. First, fluorescent modes
the multimodal fluorescence signature of fluorescent PSLs. are rather broad and their spectral location is influenced by
We also detected a further emission signal at approximately the chemical environment and molecular interactions of the
λex /λem = 220–260/290–350 nm, which does not originate fluorophore (i.e., hydration state, pH, temperature, matrix or
from embedded fluorophores. This specific fluorescence sig- solvent molecules present). This can lead to slight red- and
nal occurs for both fluorescent and non-fluorescent PSLs, as blue-shifted emission compared to observations shown here.
well as for PS-DVB particles. For PS-DVB particles the flu- This means that by using an instrument with a given optical
Atmos. Meas. Tech., 11, 3987–4003, 2018 www.atmos-meas-tech.net/11/3987/2018/T. Könemann et al.: Characterization of steady-state fluorescence properties 3999
filter cut-off, PSLs under one set of conditions may or may While the specifics of emission spectra shown here are not
not appear within a given detection channel. likely to repeat in specific detail, the trends are expected to
It is also important to note that the particle size and/or flu- be broadly consistent. Nevertheless, even if PSLs serve as a
orescence intensity of PSLs used as calibrants can vary as a simple and easy to apply approach for routinely sizing, spec-
function of production quality, which cannot be assumed to tral, and rough fluorescence intensity validations of LIF in-
be consistent between manufacturers or even between pro- struments, they cannot be compared to the complex nature
duction lots from the same provider. Additionally, PSLs un- of spectral information derived from bioaerosols in environ-
dergo aging processes, even when stored properly (i.e., at mental systems. By comparing bioaerosol data from Hernan-
4 ◦ C). According to Robinson et al. (2017), the shelf sta- dez et al. (2016) and Savage et al. (2017), fluorescence inten-
bility of PSLs is widely considered to be poor. However, to sity values of PSLs, fully doped with fluorescent dyes, will
our knowledge there have been no published studies that ad- very likely exceed the emission intensity of bioaerosols of
dress qualitative variances due to shelf degradation and so equal sizes in most cases.
these issues cannot be predicted in detail. Nevertheless, the We introduce these topics as important for many research
degradation of the fluorophore embedded in the sphere due communities to consider. By understanding general features,
to reactions with, for example, radicals and a resulting loss such as the inclusion of fluorescent modes from polystyrene
of aromaticity, will most likely lead to decreasing fluores- polymers and included surfactants or detergents, individual
cence intensities over time. Another likely age-dependent ef- researchers may probe specific spectral features important to
fect can occur when the detergent, used to prevent PSLs in the operation of their own instruments. We provide spectrally
aqueous solution from agglomeration, degrades with age and resolved steady-state EEMs of the measured lots of PSLs as
thus facilitates the aggregation of (i) PSLs with each other or open-access data as a community resource for better inter-
(ii) PSLs with the surfactant itself. Both possibilities would pretation of fluorescence responses of LIF and related instru-
likely lead to sizing inaccuracies (caused by PSL clusters or mentation.
shifting refractive indices due to the accumulation of surfac-
tant material on the PSL surface) and changing fluorescent
intensity values (increased fluorescence intensities derived Data availability. The data of EEMs presented here have been de-
from PSL clusters). Faster accumulation of surfactant ma- posited as Supplement files (tab-delimited text *.txt) for use in
terial on the PSL surface could, in some circumstances, also follow-up studies. For specific data requests or detailed information
alter derived fluorescence emission patterns by either diffract on the deposited data, please refer to the corresponding author.
excitation–emission wavelengths or contributing to the fluo-
rophore signal itself. The time period and the degree of PSL
aging are dependent on storage conditions and the quality of
the production lot individually and are, therefore, not pre-
dictable.
www.atmos-meas-tech.net/11/3987/2018/ Atmos. Meas. Tech., 11, 3987–4003, 2018You can also read