Measurement report: The chemical composition of and temporal variability in aerosol particles at Tuktoyaktuk, Canada, during the Year of Polar ...
←
→
Page content transcription
If your browser does not render page correctly, please read the page content below
Atmos. Chem. Phys., 21, 14199–14213, 2021
https://doi.org/10.5194/acp-21-14199-2021
© Author(s) 2021. This work is distributed under
the Creative Commons Attribution 4.0 License.

Measurement report: The chemical composition of and temporal
variability in aerosol particles at Tuktoyaktuk, Canada, during
the Year of Polar Prediction Second Special Observing Period
John MacInnis1 , Jai Prakash Chaubey1 , Crystal Weagle1,2 , David Atkinson3 , and Rachel Ying-Wen Chang1
1 Department of Physics and Atmospheric Science, Dalhousie University, Halifax, B3H 4R2, Canada
2 Department of Energy, Environmental and Chemical Engineering, Washington University in St. Louis,
St Louis, Missouri 63130-4899, United States of America
3 Department of Geography, University of Victoria, Victoria, V8P 5C2, Canada

Correspondence: Rachel Ying-Wen Chang (rachel.chang@dal.ca)

Received: 25 March 2021 – Discussion started: 26 April 2021
Revised: 4 August 2021 – Accepted: 27 August 2021 – Published: 24 September 2021

Abstract. The chemical composition, sources, and concen-         1   Introduction
trations of aerosol particles vary on a seasonal basis in the
Arctic. While existing research has focused on understanding     Aerosols are suspensions of liquid and solid particles in the
the occurrence of aerosol particles during the Arctic winter     atmosphere resulting from direct emissions from natural and
and spring, less is known of their occurrence during the Arc-    anthropogenic sources and physical transformations, such as
tic summer. In this study, atmospheric aerosol particle chem-    condensation and nucleation (Finlayson-Pitts and Pitts, 2000;
ical composition and concentration were determined during        Seinfeld and Pandis, 2016). The concentration, size distribu-
July–September 2018 at Tuktoyaktuk, NT, Canada (69.4◦ N,         tion, and chemical composition of aerosol particles vary sig-
133.0◦ W), to coincide with the Year of Polar Prediction’s       nificantly in the atmosphere because their sources are diverse
Second Special Observing Period in the Arctic. The chemical      and ephemeral in nature (Finlayson-Pitts and Pitts, 2000; Se-
composition of fine (PM2.5 ) and coarse (PM10–2.5 ) aerosol      infeld and Pandis, 2016). The role of aerosol particles in
filter samples suggests the ocean, mineral and/or road dust,     the atmosphere is complex: they serve as short-lived climate
and combustion were sources of the sampled aerosol parti-        forcers (Willis et al., 2018); provide reactive surfaces for het-
cles. Mass concentrations of PM2 and PM10 , estimated from       erogeneous chemistry (Newberg et al., 2005); and are vectors
optical particle counter measurements, remained within a         for the atmospheric transport (Wong et al., 2018) and post-
similar range during the study. However, elevated mass con-      depositional fate (MacInnis et al., 2019) of anthropogenic
centrations coincided with a festival in the community of        contaminants to and within remote Arctic environments, re-
Tuktoyaktuk, suggesting local human activity was an impor-       spectively.
tant source of aerosol particles. Mass concentrations of PM2 ,      In recent years, efforts have focused on understanding
which promote negative health effects in humans, were sig-       the source and chemical composition of aerosol particles in
nificantly lower at Tuktoyaktuk than the national air qual-      the Arctic, particularly within the context of climate change
ity standard recommended by the government of Canada.            (Willis et al., 2018; Boy et al., 2019). Aerosol particle pro-
These measurements provide an important baseline to com-         files vary on a seasonal basis near the surface in the Arc-
pare with future measurements associated with the assess-        tic. For example, the winter–spring period is characterized
ment of aerosol chemistry and air quality in the Arctic.         by high mass concentrations of accumulation mode aerosol
                                                                 particles primarily from anthropogenic sources (i.e., Arctic
                                                                 haze), with a chemical composition dominated by sulfate
                                                                 (SO2−4 ) and black carbon (Sharma et al., 2017, 2019). How-
                                                                 ever, natural sources of aerosol particles, such as mineral

Published by Copernicus Publications on behalf of the European Geosciences Union.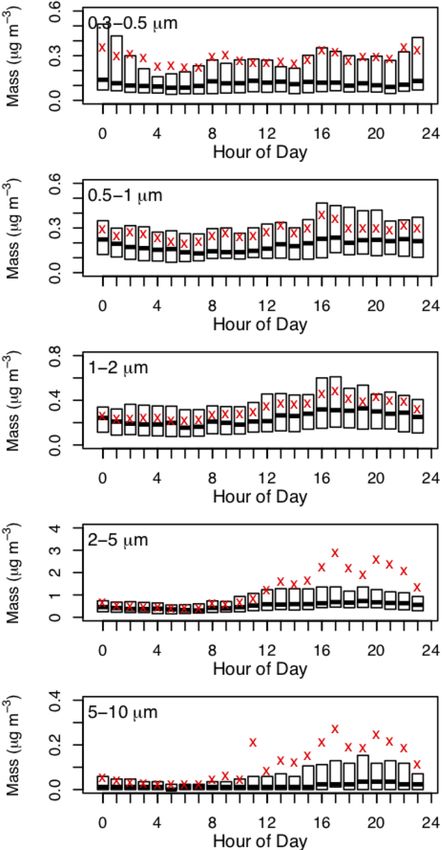
14200      J. MacInnis et al.: The chemical composition of and temporal variability in aerosol particles at Tuktoyaktuk

dust, have been identified in the Arctic during the winter–         to various ions and metals in PM2.5 , including SO2−  4 , nitrate
spring period (Dagsson-Waldhauserova et al., 2014, 2019;            (NO− 3 ), potassium  (K), iron (Fe), zinc (Zn), and silicon (Si),
Bullard et al., 2016; Mackay and Burn, 2005). The sum-              is associated with annual ischemic heart disease mortality in
mer is a period characterized by low mass concentrations of         humans (Ostro et al., 2010).
aerosol particles primarily associated with the Aitken mode            Currently, the Arctic atmosphere is characterized by low
and natural sources (Chang et al., 2011; Willis et al., 2018).      concentrations of aerosol particles in the summer (Willis et
Indeed, aerosol particles emitted from natural sources are          al., 2018); however, it has been predicted that the chemical
important during the Arctic summer; however, it is antic-           composition and magnitude of aerosol particle concentra-
ipated that emissions from anthropogenic sources will in-           tions will change in the future as a result of climate change
crease as the Arctic responds to climate warming (Willis et         (Browse et al., 2013; Gilgen et al., 2018; Willis et al., 2018;
al., 2018). An important consequence of climate warming is          Abbatt et al., 2019), which may have important implications
decreasing sea ice coverage, which promotes local warming           for aerosol–radiation and aerosol–cloud interactions in the
through positive-feedback albedo interactions, cloud and fog        Arctic (Croft et al., 2019; Murray et al., 2021; Sanchez-
formation, the ocean–atmosphere exchange of aerosol par-            Marroquin et al., 2020). In this study, the chemical com-
ticles and nucleation gases, and anthropogenic activities re-       position and concentration of aerosol particles were deter-
lated to shipping and the exploration of minerals and fos-          mined in the western Canadian Arctic during the Year of
sil fuels (Willis et al., 2018; Abbatt et al., 2019; Boy et         Polar Prediction (YOPP) Second Special Observing Period
al., 2019). Enhancements in summertime pollution promoted           in 2018. The YOPP was an international collaboration led
by anthropogenic activity may have an effect on the role of         by the World Meteorological Organization designed to im-
aerosol particles as climate forcers in the Arctic. For exam-       prove weather and sea ice forecasting and environmental pre-
ple, while it has been suggested that cooling is an ultimate        diction through the implementation of intensive and model-
effect of aerosol particles in the Arctic atmosphere, increas-      ing campaigns in polar regions (https://www.polarprediction.
ing emissions of black carbon from anthropogenic activities         net/, last access: 21 September 2021). This work is a contri-
may contribute to Arctic warming through aerosol–radiation          bution to the YOPP, as the measurement of aerosol properties
interactions (Willis et al., 2018). Changes in the chemical         in the Canadian Arctic provides a baseline for future pre-
composition of aerosol particles may also affect their hygro-       dictions of aerosol particle concentration and composition in
scopicity and atmospheric fate as cloud condensation nuclei,        this region.
contributing to heating and cooling effects through aerosol–
cloud interactions (Willis et al., 2018). The overall net impact
of aerosol particles as short-lived climate forcers in the Arc-     2     Methods and data analysis
tic is unknown; however, increasing aerosol particle emis-
sions are expected to have an impact on local air quality in        2.1    Study area and sample collection
the Arctic.
   The size and chemical composition of aerosol particles           Tuktoyaktuk, NT, Canada (69.45◦ N, 133.04◦ W), located at
have important implications for human health. In particular,        5 m above sea level, is a hamlet bordering the Amundsen
aerosol particles with diameters less than or equal to 2.5 µm       Gulf region of the eastern Beaufort Sea, and the latter is gen-
(referred to as PM2.5 ) can accumulate in human lungs. These        erally ice-covered during October–June (Herenz et al., 2018).
particles have been associated with a number of diseases in         The hamlet has a population of 982 (2018) and is accessi-
humans, such as bronchitis, asthma, and cardiovascular dis-         ble primarily via Inuvik–Tuktoyaktuk Highway (an unpaved,
ease (Dominici et al., 2006; Wu et al., 2018). In response to       gravel road) or the local airport (Fig. 1). Tuktoyaktuk expe-
these concerns, the World Health Organization established           riences a subarctic climate (Köppen climate classification)
a guideline for PM2.5 of 25 µg m−3 (24 h average), which is         characterized by long, cold winters and brief, mild summers.
suggested to be a level that minimizes risks to human health        The average annual temperature and total annual precipita-
(World Health Organization, 2018). A similar guideline was          tion are less than 0 ◦ C and 300 mm, respectively (Herenz et
established for PM2.5 by the federal government of Canada           al., 2018).
(Canadian Ambient Air Quality Standard of 27 µg m−3 ) (En-             Fine (PM2.5 ) and coarse (PM10–2.5 ) aerosol filter sam-
vironment and Climate Change Canada, 2018), although cur-           ples were collected from Tuktoyaktuk using an AirPho-
rent research is exploring the effects of aerosol particle expo-    ton SS4i air sampler (AirPhoton, Baltimore, USA, https:
sure at lower concentrations (Brauer et al., 2019; Christidis       //www.airphoton.com/, last access: 21 September 2021), as
et al., 2019; Pappin et al., 2019). For instance, several studies   described previously (Snider et al., 2015), from 18 July to
have noted that lower PM2.5 mass concentrations (5 µg m−3 )         12 September 2018. Briefly, air is drawn into the inlet of
have been associated with non-accidental death (Brauer et           this assembly system by a vacuum pump, and large parti-
al., 2019; Pappin et al., 2019). Furthermore, the chemical          cles (i.e., greater than 10 µm) are collected on a greased im-
components associated with PM2.5 may be deleterious to hu-          paction plate. The sampled air then passes through a porous
man health, as it has been suggested that long-term exposure        membrane (Nuclepore® , Whatman, 8 µm pore size) for the

Atmos. Chem. Phys., 21, 14199–14213, 2021                                           https://doi.org/10.5194/acp-21-14199-2021
J. MacInnis et al.: The chemical composition of and temporal variability in aerosol particles at Tuktoyaktuk                      14201

Figure 1. Location of the sampling site at the Aurora College Community Centre and the local airport in Tuktoyaktuk. Inset map shows
the locations of Tuktoyaktuk and potential regional sources of aerosol particles, including the Smoking Hills and Banks Island in Canada,
Prudhoe Bay Oil Field in Alaska, and the Arctic and Pacific oceans. Map source: Toporama (Natural Resources Canada). Note the geographic
assignment of locations shown in the inset map is approximate.

collection of PM10–2.5 , followed by a polytetrafluoroethylene         aerosol mass distribution to be characterized. Sample collec-
(2 µm pore size) filter for the collection of PM2.5 . This assem-      tion was performed every 10 min at a flow rate of 2.8 L min−1
bly can accommodate eight filter units, which were gravimet-           during the study period.
rically weighed before and after the sampling period using a              The instruments in this study were collocated and mounted
Sartorius ultramicro balance in a cleanroom with controlled            approximately 3.5 m above ground level (m a.g.l.) at the Au-
relative humidity (32±12 %) and temperature (20.9–21.0 ◦ C)            rora College Community Centre (ACCC) in Tuktoyaktuk.
at Dalhousie University. Due to a file-writing error during            The ACCC is located near residential and institutional build-
the study, the sample volume could not be determined, and              ings, a beach, and an unpaved road (all < 100 m from the
only the absolute mass collected on the filters is provided.           site). Potential local sources of aerosol particles at the site
We acknowledge this is a limitation of our study; however,             may include dust (e.g., beach sand, road and mineral par-
the chemical composition of these samples remains of inter-            ticles), as well as marine and combustion aerosol particles
est, as it is relevant to our understanding of the atmospheric         resulting from natural and anthropogenic activities (e.g., sea
fate of aerosol particles, particularly during the Arctic sum-         spray and vehicle traffic). The ACCC could also be influ-
mer in which existing measurements are scarce (Chang et al.,           enced by regional sources in northern Canada and the United
2011; Sierau et al., 2014; Tremblay et al., 2019).                     States. For example, emissions from the ignition of lignite
   Aerosol particles were sampled in situ using a GT-526S              in the Smoking Hills and a migratory bird colony on Banks
Handheld Particle Counter (Met One Instruments, Inc., Ore-             Island are possible sources of natural aerosol particles and
gon, USA) from 24 July to 13 September 2018. The instru-               gases, whereas emissions from the Prudhoe Bay Oil Field
ment was calibrated by the manufacturer before the study               could be an anthropogenic source of aerosol particles and
and sampled ambient air through an inlet line that was less            gases (Fig. 1). This site was selected for this study to repre-
than 1 m in length. This unit contains six channels that si-           sent a northern coastal community that was undergoing in-
multaneously measure aerosol particles binned by diameter              creased human activities (due to recent road access via the
with lower limits of 0.3, 0.5, 1, 2, 5, and 10 µm, allowing the        Trans-Canada Highway).

https://doi.org/10.5194/acp-21-14199-2021                                             Atmos. Chem. Phys., 21, 14199–14213, 2021
14202      J. MacInnis et al.: The chemical composition of and temporal variability in aerosol particles at Tuktoyaktuk

2.2   Laboratory analysis                                          or (3) if the analyte is not detected in the blanks, then the de-
                                                                   tection limit is assigned to the IDL. The reported mass of ions
Aerosol filter samples were extracted and analyzed for ions        and metals in filter samples is not blank subtracted (Supple-
and metals (Snider et al., 2015) at Dalhousie University in        ment, Table S1). Although the magnitude of chemical mass
2019. Before extraction, a ceramic blade was used to cut fil-      reported in this study may carry uncertainty, the intention of
ters in half. One-half of the filter was used for the analy-       this dataset is to provide a first assessment of the summer-
sis of water-soluble ions, including fluoride (F− ), chloride      time chemical composition of aerosol particles in a relatively
                                                      2−
(Cl− ), bromide (Br− ), nitrite (NO−           −
                                      2 ), NO3 , SO4 , phos-       underreported region of the Canadian Arctic.
phate (PO3−                 +               +    +
            4 ), lithium (Li ), sodium (Na ), K , ammonium
     +
(NH4 ), calcium (Ca ), and magnesium (Mg2+ ), which
                        2+

were extracted using 3 mL of distilled water/isopropyl alco-       2.4   Data analysis
hol (4 %) and ultrasonication. Water-soluble ions were sepa-
rated by a Dionex ICS-1000 ion chromatograph and analyzed
by conductivity detection. The other half of the filter was        The absolute mass of ions and metals on filters was cal-
subjected to acid digestion using 3 mL of 10 % nitric acid         culated by multiplying extract concentrations (µg mL−1 or
(HNO3 ) to extract metals, including Li, Mg, aluminum (Al),        n mL−1 ) by the extraction volume (3 mL) and a factor of 2
Fe, uranium (U), silver (Ag), barium (Ba), arsenic (As), Si,       to determine the mass of ions and metals on the entire fil-
vanadium (V), chromium (Cr), manganese (Mn), cadmium               ter. A mass reconstruction analysis was performed to esti-
(Cd), nickel (Ni), copper (Cu), Zn, antimony (Sb), cerium          mate contributions by ions, metals, and particle-bound water
(Ce), lead (Pb), cobalt (Co), titanium (Ti), phosphorous (P),      to the total gravimetric mass, as described in the Supplement
                                                                                                                    2−
and selenium (Se). Metals were analyzed by inductively cou-        (Table S2). It was assumed that NO−    3 and SO4 were neu-
                                                                                    +
pled plasma mass spectrometry (ICP-MS, Thermo Scientific           tralized by NH4 ; however, we recognize that it is possible
                                                                                  2−
X-Series 2). Further details related to the extraction and anal-   NO−  3 and SO4 were associated with other species, depend-
ysis of filters can be found elsewhere (Snider et al., 2015).      ing on their source and atmospheric fate (e.g., NaNO3 pro-
                                                                   duced from the acid displacement reaction with NaCl and
2.3   Quality assurance and quality control                        HNO3 ). Similarly, there is uncertainty related to the hypoth-
                                                                   esis that the source of Cl− in aerosol filter samples is limited
Field blanks were used to investigate contamination intro-         to the ocean (i.e., NaCl component in Table S2), particularly
duced during the sampling and transport of filters in this         due to the analytical challenges associated with the quan-
study. Field blanks in this study were filters that were trans-    tification of Na+ in our samples. Nevertheless, we assumed
ported to the field site but were not deployed and were re-        that all Cl− in aerosol filter samples originated from marine
turned to the laboratory for analysis concurrently with sam-       aerosol particles for the purpose of this mass reconstruction
ples. Procedural blanks were used to investigate contamina-        estimate. Data from 27 August were not included in the cal-
tion introduced during extraction. These blanks consisted of       culation determining the average mass reconstruction profile
the same analytical reagents used to extract filter samples        for PM2.5 because the chemical mass sampled was larger
but without the aerosol filter matrix. Due to the brief sam-       than the gravimetric mass. Discrepancies between the total
pling period in this study (i.e., estimated at 3 h for each fil-   gravimetric mass and measured chemical mass of aerosol fil-
ter), the chemical mass of ions and metals in aerosol particle     ter samples could be attributed to untargeted species (e.g.,
filter sample extracts was low and often estimated through         organics, other ions and metals), analytical uncertainties,
extrapolation. We fully acknowledge that this practice intro-      and/or losses of volatile species from filters during transport
duces uncertainty into the quantitative assessment of ions in      and laboratory analysis.
metals in aerosol particle filter samples and related analy-           Air mass back trajectories were calculated using HYS-
ses (Sect. 3.2). However, all reported masses are above the        PLIT (National Oceanic and Atmospheric Administration,
instrument detection limit (IDL). In addition, the chemical        https://www.ready.noaa.gov/HYSPLIT_traj.php, last access:
masses of ions and metals reported in this study were sub-         21 September 2021) to understand the source of ions and
jected to screening to account for their presence in procedu-      metals in aerosol filter samples. Air mass back trajecto-
ral and field blanks (United States Environmental Protection       ries were calculated over 120 h using Global Data Assimila-
Agency, 2016), pursuant to protocols implemented by the US         tion System (GDAS) meteorology, setting the heights at the
Environmental Protection Agency (EPA): (1) if the analyte          same location (end of parcel trajectory) to be 50, 200, and
is detected in all field and procedural blanks (i.e., at masses    400 m a.g.l. (Figs. S1 and S2). Available instrument log files
equal to or greater than the IDL), then the detection limit is     suggest that sampling occurred once every 8 d from 06:00 to
defined as the mean mass of analyte in blanks plus 3 times         09:00 local time. Therefore, 09:00 was used as an end point
the standard deviation (SD) of masses in the blanks; (2) if        for air mass back trajectory analysis.
some, but not all, blanks contain analyte, then the detection          Aerosol particle mass concentrations were estimated from
limit is assigned to the highest mass observed in the blanks;      measured aerosol particle number concentrations according

Atmos. Chem. Phys., 21, 14199–14213, 2021                                          https://doi.org/10.5194/acp-21-14199-2021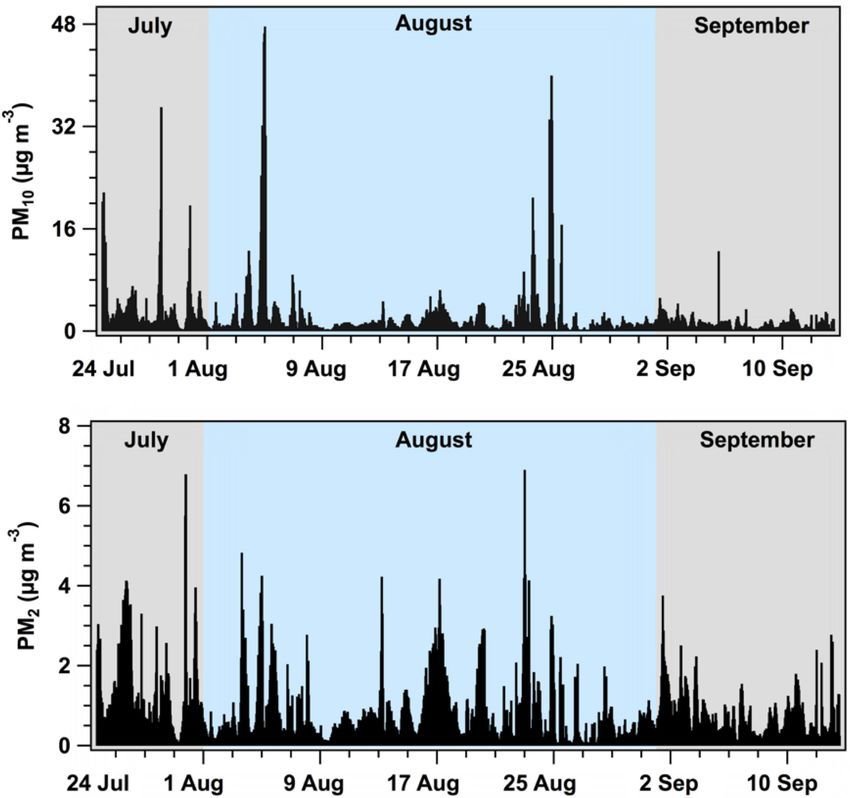
J. MacInnis et al.: The chemical composition of and temporal variability in aerosol particles at Tuktoyaktuk                14203

to Eq. (1):                                                       loads through the action of scavenging aerosol particles and
                                                                  gases.
CMass = CNum · dp3 · ρp · π/6,                             (1)
                                                                  3.2   Chemical composition of aerosol filters
where CMass is aerosol particle mass concentration (µg m−3 );
CNum is the aerosol particle number concentration measured        The detection frequencies for metals in aerosol filter samples
by the particle counter (cm−3 ); dp is the geometric mean di-     were often low and/or variable, such as those observed for
ameter of aerosol particles in a given size bin (cm); and ρp is   Ag, Ba, Cu, Sb, Ti, and Zn (Table S1). In contrast, Al was
aerosol particle density, which was assumed to be 1.8 g cm−3      detected in 100 % and 75 % of PM2.5 and PM10–2.5 samples,
(Sharma et al., 2017). PM2 and PM10 mass concentrations           respectively. Interestingly, some metals were detected only
were calculated as the sum of mass concentrations in 0.3–2        in PM2.5 , while others were detected only in PM10–2.5 . For
and 0.3–10 µm size bins, respectively.                            example, Ti was detected only in PM2.5 , whereas Cu, Ag,
  Meteorological data, including temperature, wind speed          and Ba were detected only in PM10–2.5 , suggesting the latter
and direction, atmospheric pressure, and relative humidity,       metals may have been from local sources given their shorter
were retrieved from historical climate archives (Environment      atmospheric lifetime due to gravitational settling. Al and Fe
and Climate Change Canada, 2020) for the Tuktoyaktuk air-         were the metals measured in the highest quantities in aerosol
port during the study (Fig. S3).                                  filter samples (Fig. 2).
                                                                      The detection frequencies for water-soluble ions in aerosol
3     Results and discussion                                      filter samples were generally low and variable (Fig. 2). SO2− 4
                                                                  and Cl− were found in most PM2.5 samples, with detection
3.1    Aerosol filter masses                                      frequencies of 87 % and 62 %, respectively, whereas NO−         3
                                                                  was detected only in 25 % of PM2.5 samples. Similarly to
The fine (PM2.5 , mean ± SD 15 ± 9 µg, median 15 µg),             metals, several water-soluble ions were detected only in se-
coarse only (PM10–2.5 , 14 ± 4 µg, median 14 µg), and to-         lect aerosol filter samples. For example, F− , NO−   2 , and Br
                                                                                                                                  −

tal coarse (PM10 , 29 ± 10 µg, median 26 µg) aerosol filter       were detected only in PM10–2.5 , suggesting a local source,
masses were similar during the study period, with notable         whereas Cl− , SO2−         +
                                                                                      4 , NH4 , and Ca
                                                                                                        2+ were detected only in

variability (Fig. 2). For instance, the masses range from 2.6–    PM2.5 . The highest quantities of water-soluble ions in aerosol
31, 7.3–22, and 17–44 µg in PM2.5 , PM10–2.5 , and PM10 , re-     filter samples were observed for F− , Ca2+ , PO3−   4 , and Cl
                                                                                                                                  −

spectively. Snider et al. (2016) also reported that masses of     (Fig. 2).
PM2.5 (median 72 µg, lower–upper quintiles 42–131 µg) and             Similarly to other Arctic regions (Fig. 3), Al and Fe, which
PM10–2.5 (median 90 µg, lower–upper quintiles 44–154 µg)          have been linked to mineral dust emissions (Liberda et al.,
were comparable in filter samples collected across a global       2015; Ferrero et al., 2019), dominated aerosol filter samples
network of sites (i.e., Surface Particulate Matter Network,       at Tuktoyaktuk. In contrast, contributions from Ba and Sb
SPARTAN) using an AirPhoton sampler, although the ex-             to the total quantity of metals at Tuktoyaktuk were greater
act distribution is site-specific. For instance, comparable       than in other Arctic regions, whereas Ti contributions from
masses of PM2.5 and PM10–2.5 are not unexpected, consid-          other Arctic regions were greater than those at Tuktoyaktuk
ering coarse aerosol particle emissions are likely transient      (Landsberger et al., 1990; Kadko et al., 2016; Conca et al.,
in nature (i.e., from local sources), and they may not have       2019). It is important to note that metal profiles in Lands-
been sampled during the brief sampling period in this study.      berger et al. (1990) and Conca et al. (2019) are based on
This is further supported by the mass distribution of fine and    data collected during winter–spring periods; therefore sea-
coarse aerosol particles measured by the particle counter,        sonal differences in aerosol particle sources in those studies
where the mass fraction of fine aerosol particles was occa-       may account for differences in composition profiles in com-
sionally higher than the mass fraction of coarse aerosol par-     parison to Tuktoyaktuk (e.g., Arctic haze versus summertime
ticles (Fig. S4). However, PM10 masses in this study were         sources). In addition, the studies compared in Fig. 3 do not
always greater than PM2.5 masses, as expected.                    always target the same ions and metals and/or face analyti-
   It was expected that the size distribution of aerosol parti-   cal challenges, preventing accurate reporting of data, which
cles (e.g., coarse mineral dust vs. fine combustion aerosol       collectively could also contribute to chemical composition
particles) and local meteorology could have affected the          differences across sites. Ion composition profiles for aerosol
magnitude of filter masses during the study. For example, it      filter samples at Tuktoyaktuk were notably different than
is possible that warmer temperatures on 26 July (Fig. S3)         in other Arctic regions (Leaitch et al., 2018; Ferrero et al.,
may have enhanced local emissions of coarse aerosol parti-        2019), with the exception of the SO2−   4 in PM2.5 at Tuktoy-
cles through heating and convection, contributing to a high       aktuk, whose composition profile was comparable to those
PM10–2.5 mass, while precipitation (i.e., drizzle, rain, and      found in aerosol particles from the Arctic Ocean and Ny-
snow), which was observed at the airport before and during        Ålesund (Fig. 3) (Ferrero et al., 2019). The ion composition
sampling events (Fig. S5), could have reduced atmospheric         profiles were dominated by Na+ and Cl− at Ny-Ålesund and

https://doi.org/10.5194/acp-21-14199-2021                                       Atmos. Chem. Phys., 21, 14199–14213, 2021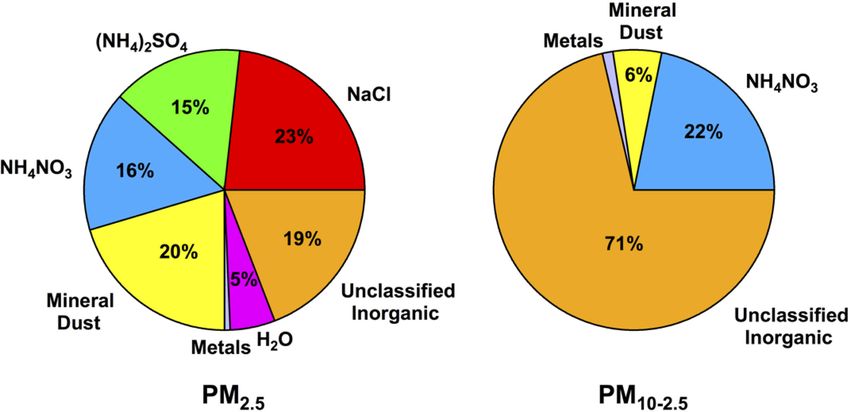
14204 J. MacInnis et al.: The chemical composition of and temporal variability in aerosol particles at Tuktoyaktuk
Figure 2. A summary of the gravimetric mass (a, d) and chemical mass of ions (b, e) and metals (c, f) in fine (PM2.5 ) and coarse (PM10–2.5 )
aerosol filter samples (a–c and d–f, respectively) from Tuktoyaktuk during July–September 2018.
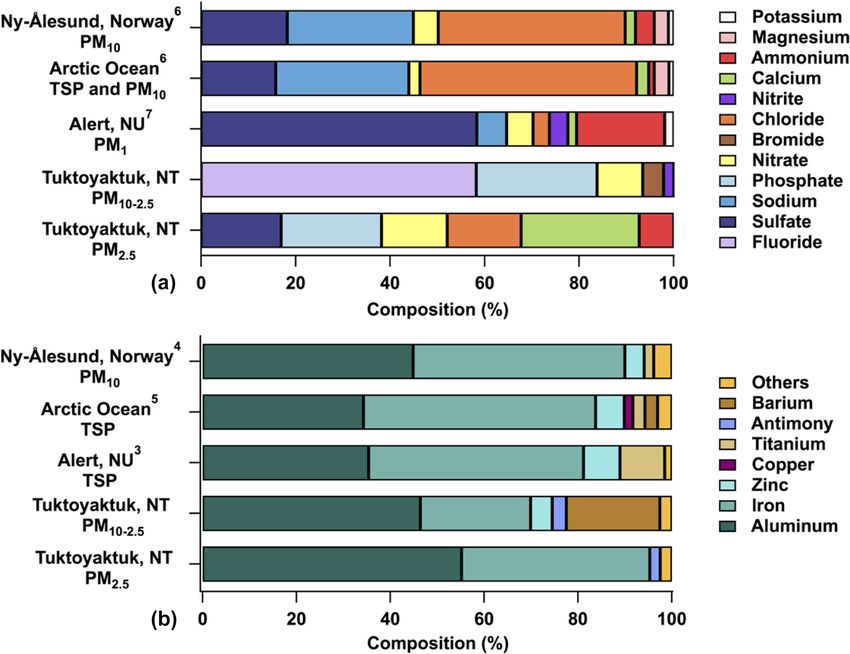
the Arctic Ocean and by SO2− 4 at Alert (Leaitch et al., 2018; It is noteworthy that other metals characteristic of mineral
Ferrero et al., 2019). Na+ and Cl− have been linked to ma- dust, such as Fe and Ti, were detected less frequently in fil-
rine aerosol particle emissions, while SO2− 4 has been linked ter samples (Table S1), suggesting they had different sources.
to anthropogenic combustion and natural sources (Leaitch et Interestingly, the highest mass of Al, Ti, Fe, and Zn in PM2.5
al., 2018; Ferrero et al., 2019). filter samples was observed on 4 September, and air masses
High detection frequencies of Al in PM2.5 and PM10–2.5 during this period originated from the north and traveled in
filter samples suggest that mineral dust was a consistent northwesterly directions, over the ocean. Other air mass tra-
source of aerosol particles at Tuktoyaktuk. It is possible that jectories originating from west and northwesterly directions
local mineral and/or road dust emissions were sources of (i.e., Alaska and Russia) were observed on 18 and 26 July
aerosol particles in this region, although the mass of Al was and 19 August (Figs. S1 and S2), and filter samples dur-
comparable in PM2.5 and PM10–2.5 filter samples, which may ing these periods contained Ba, Ag, and Sb. It is possible
not be an outcome expected from local dust emissions if the that these air masses were influenced by emissions from the
size distribution of precursor particles (beach sand, soil, road Prudhoe Bay Oil Field and mining activities in Alaska, Rus-
dust) is coarse (i.e., higher mass expected in PM10–2.5 ). Fur- sia, and Canada during these periods (Alaska Miners Asso-
thermore, it has been suggested that giant mode (dp > 40 µm) ciation, 2020; Government of Canada, 2018; European En-
and saltation mode (3 ≤ dp ≤ 6 µm) mineral dust aerosol par- vironment Agency, 2017). However, local emissions from
ticles are primarily produced from soils (Saltzman, 2009). combustion and natural or anthropogenic dust (e.g., road
This could suggest that in addition to local sources, the dust containing tire wear and mineral and/or soil particles)
presence of Al in filter samples was attributable to mineral (Snider et al., 2016; Crocchianti et al., 2021; Mackay and
dust emissions and atmospheric transport from other, high- Burn, 2005) cannot be precluded as sources of Al, Fe, Ti, Zn,
latitude regions within the Arctic (Crocchianti et al., 2021; Ba, Ag, and Sb in filter samples.
Mackay and Burn, 2005). For example, it is possible that It is interesting that Cl− was detected only in PM2.5 while
aerosol filter samples on 18 and 26 July (Fig. S1) were Br− was detected only in PM10–2.5 filter samples since Cl−
influenced by active dust sources near the North Slope of and Br− have been measured in seawater from the Canadian
Alaska (https://maps.unccd.int/sds/, last access: 21 Septem- Arctic Archipelago (Xu et al., 2016). Although the ACCC
ber 2021). is a coastal site, surface meteorology records from the air-
port (Fig. S3) indicated that local wind speeds were often
Atmos. Chem. Phys., 21, 14199–14213, 2021 https://doi.org/10.5194/acp-21-14199-2021J. MacInnis et al.: The chemical composition of and temporal variability in aerosol particles at Tuktoyaktuk 14205 Figure 3. Composition profiles of ions (a) and metals (b) in aerosol filter samples at Tuktoyaktuk and other Arctic regions. Average com- position profiles are shown for aerosol filter samples at Tuktoyaktuk. Only ions and metals that are equal to or greater than the detection limit in this study are included in this figure. Several elements in Landsberger et al. (1990, denoted with superscript 3 in the figure) (Ca, Cl, Na), Conca et al. (2019, superscript 4) (Mg, K, Na, Ca), and Kadko et al. (2016, superscript 5) (Na, Mg) were detected in aerosol par- ticles; however, they are not included in this figure to enable comparisons with trace metal composition profiles. Data shown for Leaitch et al. (2018, superscript 7), Kadko et al. (2016, superscript 5), Ferrero et al. (2019, superscript 6), Landsberger et al. (1990, superscript 3), and Conca et al. (2019, superscript 4) correspond to sampling periods during 8 August 2014, 14 August 2011, 20 June to 12 August 2011–2012, 7–18 March 1985, and March to September 2010–2013, respectively. below 4 m s−1 (e.g., 26 July, 19 and 27 August, 12 Septem- sources, Cl− and Br− can originate from biomass burning. ber), which has been suggested as a threshold wind speed for Keene et al. (2006) identified hydrochloric acid (HCl), chlo- whitecap formation (O’Dowd and de Leeuw, 2007). How- rine (Cl2 ), hypochlorous acid (HOCl), bromine (Br2 ), and ever, a marine influence was expected on 3 and 11 Au- hypobromous acid (HOBr) as products of biomass burning, gust and 4 September, since wind speeds were greater than which could have been the source of either Cl− measured 4 m s−1 and originated from northwesterly and easterly di- in the fine mode or Br− measured in the coarse mode at rections (Fig. S3). If the presence of Br− in PM10–2.5 filter Tuktoyaktuk. While we are unable to confirm this source in samples was attributed to marine aerosol particles, then Cl− our study, it is conceivable that biomass burning in northern should have also been present based on the molar compo- Canada was a possible source of aerosol particles at Tuktoy- sition of Cl− and Br− in seawater from the Canadian Arc- aktuk (e.g., 27 August, Fig. S2). tic Archipelago (Xu et al., 2016). On the other hand, it is It is challenging to identify sources of ions and metals in important to consider that the absence of Br− in PM2.5 fil- aerosol filter samples, especially when they are emitted from ter samples could be related to analytical challenges because various sources in the environment (Jayarathne et al., 2014; the mass of Br− expected in PM2.5 filter samples, based on Leaitch et al., 2018; Willis et al., 2018). For instance, it is the molar composition of Cl− and Br− in seawater from the likely that ions and metals originated from continental and Canadian Arctic Archipelago (Xu et al., 2016), is below the marine sources in this study, pursuant to air mass back trajec- detection limit in this study. It is unlikely that the absence of tory analysis during the study period (Figs. S1 and S2). One Cl− in PM10–2.5 filter samples can be explained by acid dis- strategy that can be used to better constrain continental and placement reactions, considering it has been suggested that marine sources is to compare known ratios of ions and metals Cl− depletion decreases with increasing aerosol particle size in soils and seawater to those found in aerosol filter samples. (Yao et al., 2003). Thus, these observations suggest that Cl− As an example, the molar ratios of Fe / Al and Cl− / SO2− 4 and Br− were from different sources. In addition to marine in PM2.5 from Tuktoyaktuk are compared to those found in https://doi.org/10.5194/acp-21-14199-2021 Atmos. Chem. Phys., 21, 14199–14213, 2021
14206       J. MacInnis et al.: The chemical composition of and temporal variability in aerosol particles at Tuktoyaktuk

Icelandic soils (Ðord̄ević et al., 2019) and seawater from the      and NH4 NO3 collectively accounted for 31 % of the known
Canadian Arctic Archipelago (Xu et al., 2016), respectively.         chemical mass (Fig. 4). Lower contributions were observed
The molar ratio of Fe / Al in Icelandic soils is 0.9, and this       for metals and particle-bound water, collectively account-
ratio is within the range of those observed in aerosol filter        ing for 6 % of the total known mass in PM2.5 filter sam-
samples from Tuktoyaktuk (0.4–1.4). This result further sup-         ples. In contrast, the average mass reconstruction profile for
ports the hypothesis that Fe and Al could originate from min-        PM10–2.5 was dominated by NH4 NO3 and unclassified inor-
eral dust. In contrast, the molar ratio of Cl− / SO2− 4 in Arc-      ganic ions (i.e., combined masses of F− , Br− , PO3−      4 , and
tic seawater is 27, which is higher than those in PM2.5 from         NO−  2 ; Table S2),  which  collectively accounted   for 93 % of
Tuktoyaktuk (0.7–6.8). Lower molar ratios of Cl− / SO2−        4     the total chemical mass. This analysis suggests that marine,
in aerosol filter samples could be attributed to non-oceanic         mineral dust, and combustion sources were important in this
sources of SO2−  4 (i.e., natural and anthropogenic combus-          region; however, the source of PO3−              −
                                                                                                            4 and F , which were
tion sources). For example, SO2−    4 in PM2.5 at Tuktoyaktuk
                                                                     major components of the unclassified inorganic fraction of
may have originated from natural sources, such as the bio-           aerosol particle filter samples, could not be identified. The
genic emission and subsequent oxidation of dimethyl sul-             sources of these ions are interesting because PO3−    4 and F
                                                                                                                                      −

fide from the ocean (Bates et al., 1987). In addition, sulfur        have not been previously identified in aerosol particles from
emissions from the Prudhoe Bay Oil Field and the ignition            the Arctic (Fig. 3). We acknowledge that it is possible that
of lignite in the Smoking Hills (Radke and Hobbs, 1989)              the detection of F− could be related to laboratory contami-
were likely sources of SO2−   4 in PM2.5 at Tuktoyaktuk, ac-
                                                                     nation; however, the reported masses in this study are equal
cording to air mass back trajectories (Figs. S1 and S2). An-         to or greater than the detection limit (i.e., mean + 3 SD of
other source of SO2−                                                 blank masses). It is challenging to assign sources to PO3−
                     4 in PM2.5 at Tuktoyaktuk may include                                                                          4
anthropogenic emissions from the combustion of fossil fuels          and F− because they are released from multiple sources in
(e.g., vehicles, aircraft, boats) (Leaitch et al., 2018; Willis et   the environment, such as emissions from volcanos, mineral
al., 2018). Other ions characteristic of combustion were also        dust, combustion, and marine aerosol particles (Jayarathne et
identified in aerosol filter samples from Tuktoyaktuk, such          al., 2014; Vet et al., 2014). It is also challenging to assign
as NO−            +                                                  sources to F− because one of its gas-phase precursors (i.e.,
        3 and NH4 , possibly from the emission and oxidation
of nitrogen oxides (NOx ) and emissions of ammonia dur-              hydrofluoric acid, HF), emitted during smelting activity, coal
ing fossil fuel combustion from local, regional (e.g., Prudhoe       combustion, and volcanic activity (Jayarathne et al., 2014),
Bay Oil Field), and long-range sources. However, ammonia             may partition into aerosol particles in the Arctic atmosphere.
emissions in the Arctic have also been associated with natu-         While there is uncertainty associated with the source of PO3−  4
ral sources, such as soil (Wentworth et al., 2016) and guano         and F− in aerosol filter samples, the back trajectories suggest
(Croft et al., 2016a; Wentworth et al., 2016), which could           that air masses containing PO3−   4 traveled primarily over the
account for NH+                                                      ocean, whereas air masses containing F− traveled over the
                  4 in aerosol filter samples at Tuktoyaktuk,
particularly on 3 August because NH+      4 was detected in air
                                                                     ocean and land (Figs. S1 and S2). These observations sug-
masses that traveled near a bird colony on Banks Island be-          gest that marine, mineral, and combustion aerosol particles
fore arriving at the ACCC (Fig. S1). It is important to con-         are possible sources of PO3−           −
                                                                                                   4 and F at Tuktoyaktuk.
sider that lower molar ratios of Cl− / SO2−   4 in PM2.5 filter
                                                                         In addition to uncertainties associated with the unclassified
samples from Tuktoyaktuk could also be attributed to Cl−             inorganic fraction, a substantial fraction of mass on aerosol
depletion from marine aerosols via acid displacement (New-           filter samples could not be identified. For instance, the av-
berg et al., 2005). For example, it is possible that HNO3 and        erage chemical mass accounted for only 10 % and 12 % of
sulfuric acid (H2 SO4 ) displaced Cl− in PM2.5 from Tuktoy-          the total gravimetric mass in PM2.5 and PM10–2.5 filter sam-
                                                               2−
aktuk (Laskin et al., 2012), particularly since NO−  3 and SO4
                                                                     ples, respectively (Fig. S6). Discrepancies between the total
were detected in aerosol filter samples that were devoid of          gravimetric mass and chemical mass of aerosol filter sam-
Cl− (i.e., 26 July–11 August). Although the organic compo-           ples could be attributed to analytical uncertainties, the loss
sition of aerosol filter samples was not characterized in this       or gain of volatile species from filters after sampling (Saltz-
work, it is important to consider that organic acids (Laskin         man, 2009), and/or contributions from untargeted chemical
et al., 2012) may have also contributed to Cl− depletion in          components. For example, it is possible that other inorganic
aerosol filter samples.                                              ions and metals, organic material, and black carbon were
   A mass reconstruction analysis was conducted to estimate          components of aerosol particles at Tuktoyaktuk, pursuant to
contributions from ions and metals to the total gravimetric          the chemical composition of aerosol particles in other Arctic
mass (Bari and Kindzierski, 2017). The average mass recon-           regions (Kadko et al., 2016; Leaitch et al., 2018; Conca et
struction profile for PM2.5 indicates that contributions from        al., 2019; Ferrero et al., 2019; Sharma et al., 2019). Despite
marine and mineral dust sources collectively accounted for           these uncertainties, our results indicate that there are substan-
43 % of the total known chemical mass (i.e., NaCl and min-           tial, uncharacterized chemical components that could not be
eral dust components), while contributions from (NH4 )2 SO4          identified in aerosol filter samples at Tuktoyaktuk.

Atmos. Chem. Phys., 21, 14199–14213, 2021                                             https://doi.org/10.5194/acp-21-14199-2021
J. MacInnis et al.: The chemical composition of and temporal variability in aerosol particles at Tuktoyaktuk 14207
Figure 4. Average mass reconstruction profiles of fine and coarse aerosol filter samples at Tuktoyaktuk during July–September 2018. Several
ions measured in this study (F− , Br− , PO3− −
4 , NO2 ) are collectively included here as unclassified inorganic components due to uncertainties
associated with their sources in the environment.
The summertime composition profiles at Tuktoyaktuk may Total aerosol particle number concentrations of particles
provide insights into the future chemical composition of larger than 0.3 µm (Nd ) in this study were low (1 h average,
aerosol particles in the Arctic. Our analysis indicates that mean ± SD 6 ± 8 cm−3 , median 3 cm−3 ). These relatively
mineral dust, marine, and combustion sources are important low concentrations are consistent with other observations
during the Arctic summer, particularly in the absence of snow during the Arctic summer (Willis et al., 2018) and may have
cover and sea ice coverage. It is expected that emissions of been attributable to enhanced aerosol particle and nucleation
these aerosol particles will increase as the Arctic responds gas scavenging by precipitation (Croft et al., 2016b). Aerosol
to climate warming in the future. For example, it is expected particle mass concentrations for PM2.5 and PM10 were sim-
that climate warming will enhance the melting of snowpacks ilar in regions of the Northwest Territories, Yukon Territory,
and sea ice within the Arctic, promoting exposed landscapes and Nunavut (Canadian Council of Ministers of the Environ-
and oceans and ship traffic (Willis et al., 2018). Our anal- ment, 2019) but were higher than those observed for PM2
ysis also indicates that there are significant, unknown com- and PM10 at Tuktoyaktuk during July–September 2018 (Ta-
ponents of aerosol filter samples during the summer of 2018 ble 1). Although some measurements at Tuktoyaktuk are not
at Tuktoyaktuk, which may influence the chemical proper- directly comparable to those of other regions in Canada (i.e.,
ties of aerosol particles and their role in the Arctic tropo- PM2 vs. PM2.5 ), it is possible that the difference in the mag-
sphere (e.g., cloud condensation nuclei, radiative properties) nitude of aerosol particle mass concentrations could be at-
(Martin et al., 2011; Herenz et al., 2018; Willis et al., 2018; tributed to differences in regional climate (i.e., precipitation)
Abbatt et al., 2019). For example, the unidentified compo- and aerosol particle sources. For instance, it is likely that
nents (e.g., organic components) are likely less hygroscopic Tuktoyaktuk is influenced by marine air masses to a greater
than the soluble inorganics identified and would reduce the extent than other sites listed in Table 1, which are generally
cloud condensation nuclei activity of the aerosol particles. located inland. Differences in regional populations/human
This highlights the importance of improving understanding activities could further promote differences in aerosol par-
of the chemical composition of aerosol particles in the Arc- ticle concentrations (e.g., enhanced vehicle traffic). It is in-
tic. It is important to emphasize that these results provide teresting to note in Table 1 that relatively high aerosol par-
only a snapshot of the aerosol particles at Tuktoyaktuk and ticle mass concentrations were observed at Norman Wells
their representativeness is unknown. despite its low population; however, this may be attributed
to major crude oil and natural gas production in that region
3.3 Size distribution, temporal variability, and health (Canada Energy Sector, 2020). The difference in the magni-
implications of aerosol particles tude of aerosol particle mass concentrations may also be re-
lated to differences in sampling techniques. For example, one
The average number size distributions of particles larger than method used by the National Air Pollution Surveillance pro-
0.3 µm were similar throughout the study, with particle num- gram to determine mass concentrations is filtration and beta
ber concentrations highest in the 0.3–0.5 µm bin (Fig. S7). attenuation (Canadian Council of Ministers of the Environ-
The mass size distributions also remained similar throughout ment, 2019), whereas the method used here relies on aerosol
the study, with mass concentrations dominated by the 2–5 µm particle number concentrations and estimations of aerosol
aerosol particles (Fig. S7).
https://doi.org/10.5194/acp-21-14199-2021 Atmos. Chem. Phys., 21, 14199–14213, 202114208 J. MacInnis et al.: The chemical composition of and temporal variability in aerosol particles at Tuktoyaktuk
Table 1. An overview of mass concentrations for PM2 , PM2.5 , and PM10 at Tuktoyaktuk and other regions in Canada (Canadian Council
of Ministers of the Environment, 2019) from 26 July to 13 September 2018. Population data for 2018 were retrieved from the Northwest
Territories Bureau of Statistics (NWT Bureau of Statistics, 2020), the government of Nunavut (Government of Nunavut, 2019), and the
Yukon Bureau of Statistics (Yukon Bureau of Statistics, 2019).
Location Tuktoyaktuk, NT Inuvik, NT Norman Wells, NT Iqaluit, NU Yellowknife, NT Whitehorse, YT
69◦ N 68◦ N 65◦ N 64◦ N 62◦ N 61◦ N
Population 982 3536 818 38 139 20 607 40 643
µg m−3 PM2 PM10 PM2.5 PM10 PM2.5 PM10 PM2.5 PM2.5 PM10 PM2.5
Mean 0.9 2.3 2.6 13 3.7 11 4.3 2.6 16 2.4
Median 0.6 1.3 2.0 6 3.0 7 4.0 0.0 13 2.0
Max 6.9 48 19 133 22 122 15 58 97 48
Figure 5. Mass concentration profiles for PM2 and PM10 at Tuk-
toyaktuk during July–September 2018. The data are presented as
1 h averages (mountain daylight time), and each monthly period is
demarcated by color.
particle density (Eq. 1). Despite these differences, these data
indicate that aerosol particle concentrations were lower dur-
ing the summer of 2018 at Tuktoyaktuk than in other regions
in northern Canada.
A summary of the continuous aerosol particle mass con-
centrations during July–September 2018, calculated from the
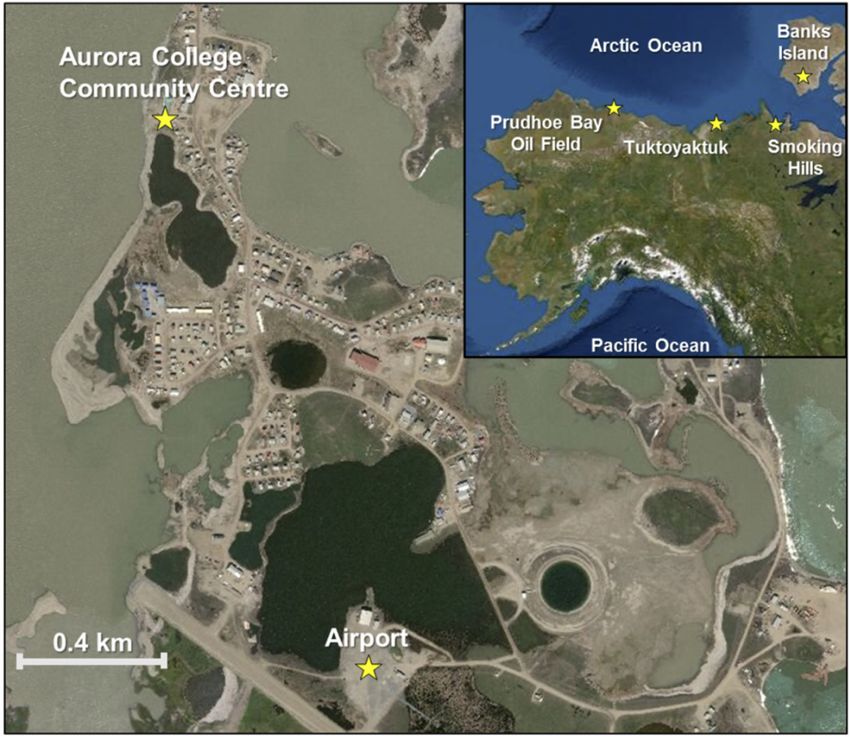
Figure 6. Box plot of diurnal aerosol particle mass concentra-
particle counter, is presented in Figs. 5 and 6. In general,
tions (µg m−3 ) at Tuktoyaktuk during 24 July to 13 Septem-
the magnitude of mass concentrations remained within a ber 2018 (mountain daylight time). Average concentrations are de-
similar range during July–September 2018, although there noted by red markers; median concentrations correspond to black
were notable increases in mass concentrations during 28– lines within each box; and the lower and upper bounds of each box
30 July, 3–6 August, and 22–24 August (Fig. 5). For ex- are the 25th and 75th percentiles, respectively.
ample, the average PM10 concentration was 2.3 µg m−3 over
the study period, whereas higher PM10 concentrations oc-
curred on 28 July (35 µg m−3 ), 4 August (48 µg m−3 ), and
Atmos. Chem. Phys., 21, 14199–14213, 2021 https://doi.org/10.5194/acp-21-14199-2021J. MacInnis et al.: The chemical composition of and temporal variability in aerosol particles at Tuktoyaktuk 14209
24 August (40 µg m−3 ). Although we are unable to confirm ing the summer of 2018 at Tuktoyaktuk, which may have in-
the source of aerosol particle emissions during these periods, fluenced the atmospheric fate of aerosol particles in the Arc-
it is conceivable that elevated mass concentrations could be tic troposphere. While the mass concentrations of PM2 were
attributed to local aerosol particle emissions from human ac- found to be significantly lower at Tuktoyaktuk compared to
tivities at Tuktoyaktuk. For instance, elevated PM10 concen- the Canadian Ambient Air Quality Standard, it is likely that
trations on 28 July may have been related to human activities their concentrations will increase in the future due to cli-
that proceeded during the annual Land of the Pingos Musical mate change, which is expected to promote increases in ship
Festival (e.g., barbecuing, increased vehicle traffic), which and air traffic in the Arctic as well as the number of ice-free
occurred during 27–29 July at Tuktoyaktuk. Similar human days and natural emissions from open waters. Although these
activities could also provide an explanation for elevated mass measurements represent only a snapshot of the aerosol par-
concentrations on 3–6 August, considering this period coin- ticles at Tuktoyaktuk, they can nevertheless provide insights
cided with an extended civic holiday weekend. into the chemistry and concentration of aerosol particle sam-
Aerosol particle mass concentrations did not exhibit no- ples, which can be used in the future to assess aerosol particle
table diurnality during the study (Fig. 6). Average mass con- chemistry and air quality in the Canadian Arctic. Future work
centrations were typically higher than median mass concen- should focus on constraining possible sources of aerosol par-
trations and exhibited notable variability in the 2–5 and 5– ticles, such as acquiring time-resolved chemical mass spec-
10 µm size bins, which was likely driven by enhanced aerosol tra data and performing factor analysis (e.g., positive matrix
particle emissions from local human activities at Tuktoyak- factorization) and/or analyzing the chemical composition of
tuk, as discussed previously (i.e., festival and weekend activ- local soils.
ities).
To assess the impact of fine aerosol particle emissions on
local air quality, the mass concentration of PM2 at Tuktoy- Data availability. Quality-controlled aerosol filter chem-
aktuk was compared to the Canadian Ambient Air Quality istry and aerosol particle number concentrations are
Standard. The concentration of PM2 was low at Tuktoyak- available through the Federated Research Data Reposi-
tuk during July–September 2018, with 24 h average concen- tory (https://doi.org/10.20383/101.0269, Chang, 2021a and
https://doi.org/10.20383/101.0278, Chang, 2021b).
trations ranging from 0.2–3 µg m−3 . These mass concentra-
tions were very low in Tuktoyaktuk compared to the national
PM2.5 standard (27 µg m−3 ).
Supplement. The supplement related to this article is available on-
line at: https://doi.org/10.5194/acp-21-14199-2021-supplement.
4 Conclusions
Author contributions. RCYW and DA were responsible for fund-
The chemical composition of aerosol filter samples and con- ing acquisition and conceptualized the research. JC and DA were
centration of aerosol particles from Tuktoyaktuk were de- responsible for data acquisition. JC and CW contributed to data cu-
termined during July–September 2018. Although our anal- ration. The formal analysis and visualization of data was performed
ysis could not identify distinct sources, the results suggest by JM. JM and RYWC wrote the manuscript, with editorial feed-
that this moderately sized community in the Canadian north back from all co-authors.
was influenced by a wide range of aerosol particle sources
with complex processes. The observed aerosol particles were
likely derived from local natural sources like marine and Competing interests. The authors declare that they have no conflict
mineral dust and anthropogenic sources like the combus- of interest.
tion of fossil fuels and road dust, while emissions from the
Prudhoe Bay Oil Field; the Smoking Hills; bird colonies on
Banks Island; mining activities in northern Canada, Russia, Disclaimer. Publisher’s note: Copernicus Publications remains
neutral with regard to jurisdictional claims in published maps and
and Alaska; and mineral dust from active source regions in
institutional affiliations.
the Arctic are possible regional sources of aerosol particles,
pursuant to air mass back trajectory analysis (Figs. S1 and
S2). We hypothesize that precipitation reduced atmospheric Acknowledgements. The authors thank George Hibbs for providing
loads of aerosol particles and gases during the study, which access to the sampling site, Nicole Chisholm for weighing filters,
is expected to have affected the magnitude of the gravimetric Brenna Walsh for helpful discussions, and Randall Martin and Jong
mass and chemical composition of aerosol filters at Tuktoy- Sung Kim for providing resources during deployment. This work
aktuk, and air temperature may have enhanced local emis- was funded by the Marine Environmental Observation, Prediction
sions of coarse aerosol particles through daytime heating and and Response Network (MEOPAR); Polar Knowledge Canada; and
convection. Our analysis indicates that there were significant, the Canada Research Chairs Program. This is a contribution to the
unknown components identified in aerosol filter samples dur- Year of Polar Prediction (YOPP), a flagship activity of the Polar
https://doi.org/10.5194/acp-21-14199-2021 Atmos. Chem. Phys., 21, 14199–14213, 202114210 J. MacInnis et al.: The chemical composition of and temporal variability in aerosol particles at Tuktoyaktuk
Prediction Project (PPP), initiated by the World Weather Research son, T., Virkkula, A., Weyhenmeyer, G. A., Wu, Y., Zieger,
Programme (WWRP) of the World Meteorological Organization P., and Kulmala, M.: Interactions between the atmosphere,
(WMO). We acknowledge the WMO WWRP for its role in coor- cryosphere, and ecosystems at northern high latitudes, Atmos.
dinating this international research activity. Chem. Phys., 19, 2015–2061, https://doi.org/10.5194/acp-19-
2015-2019, 2019.
Brauer, M., Brook, J. R., Christidis, T., Chu, Y., Crouse, D. L., Er-
Financial support. This research has been supported by Polar ickson, A., Hystad, P., Li, C., Martin, R. V., Meng, J., Pappin, A.
Knowledge Canada (grant no. NST-1718-0001) and Canada Re- J., Pinault, L. L., Tjepkema, M., Van Donkelaar, A., Weichenthal,
search Chairs (grant no. CRC-2013-00056). S., and Burnett, R. T.: Mortality-Air Pollution Associations in
Low-Exposure Environments (MAPLE): Phase 1, Res. Reports
Heal. Eff. Inst., 203, 2019.
Review statement. This paper was edited by Drew Gentner and re- Browse, J., Carslaw, K. S., Schmidt, A., and Corbett, J.
viewed by Pavla Dagsson Waldhauserova and one anonymous ref- J.: Impact of future Arctic shipping on high-latitude black
eree. carbon deposition, Geophys. Res. Lett., 40, 4459–4463,
https://doi.org/10.1002/grl.50876, 2013.
Bullard J. E., Baddock, M., Bradwell, T., Crusius, J., Darling-
ton, E., Gaiero, D., Gassó, S., Gisladottir, G., Hodgkins,
References R., McCulloch, R., McKenna-Neuman, C., Mockford,
T., Stewart, H., and Thorsteinsson, T.: High latitude
Abbatt, J. P. D., Leaitch, W. R., Aliabadi, A. A., Bertram, A. K., dust in the Earth system, Rev. Geophys., 54, 447–485,
Blanchet, J.-P., Boivin-Rioux, A., Bozem, H., Burkart, J., Chang, https://doi.org/10.1002/2016RG000518, 2016.
R. Y. W., Charette, J., Chaubey, J. P., Christensen, R. J., Cirisan, Canada Energy Sector: Provincial and Territorial
A., Collins, D. B., Croft, B., Dionne, J., Evans, G. J., Fletcher, Energy Profiles – Northwest Territories, avail-
C. G., Galí, M., Ghahremaninezhad, R., Girard, E., Gong, W., able at: https://www.cer-rec.gc.ca/en/data-analysis/
Gosselin, M., Gourdal, M., Hanna, S. J., Hayashida, H., Herber, energy-markets/provincial-territorial-energy-profiles/
A. B., Hesaraki, S., Hoor, P., Huang, L., Hussherr, R., Irish, V. provincial-territorial-energy-profiles-northwest-territories.html
E., Keita, S. A., Kodros, J. K., Köllner, F., Kolonjari, F., Kunkel, (last access: 16 March 2021), 2020.
D., Ladino, L. A., Law, K., Levasseur, M., Libois, Q., Liggio, J., Canadian Council of Ministers of the Environment: Ambient Air
Lizotte, M., Macdonald, K. M., Mahmood, R., Martin, R. V., Ma- Monitoring and Quality Assurance/Quality Control Guidelines,
son, R. H., Miller, L. A., Moravek, A., Mortenson, E., Mungall, National Air Pollution Surveillance Program, Canadian Council
E. L., Murphy, J. G., Namazi, M., Norman, A.-L., O’Neill, N. T., of Ministers of the Environment, 117 pp., ISBN 978-1-77202-
Pierce, J. R., Russell, L. M., Schneider, J., Schulz, H., Sharma, S., 056-4, 2019.
Si, M., Staebler, R. M., Steiner, N. S., Thomas, J. L., von Salzen, Chang, R.: Aerosol Particle Mass and Chemical Composition Anal-
K., Wentzell, J. J. B., Willis, M. D., Wentworth, G. R., Xu, J.- ysis Tuktoyaktuk 2018, Federated Research Data Repository
W., and Yakobi-Hancock, J. D.: Overview paper: New insights [data set], https://doi.org/10.20383/101.0269, 2021a.
into aerosol and climate in the Arctic, Atmos. Chem. Phys., 19, Chang, R.: Aerosol Particle Number Size Distributions Tuktoyak-
2527–2560, https://doi.org/10.5194/acp-19-2527-2019, 2019. tuk, NWT 2018, Federated Research Data Repository [data set],
Alaska Miners Association: Major Mines in Alaska, avail- https://doi.org/10.20383/101.0278, 2021b.
able at: http://www.alaskaminers.org/major-mines (last access: Chang, R. Y.-W., Leck, C., Graus, M., Müller, M., Paatero, J.,
16 March 2021), 2020. Burkhart, J. F., Stohl, A., Orr, L. H., Hayden, K., Li, S.-M.,
Bari, M. A. and Kindzierski, W. B.: Ambient fine particulate matter Hansel, A., Tjernström, M., Leaitch, W. R., and Abbatt, J.
(PM2.5 ) in Canadian oil sands communities: Levels, sources and P. D.: Aerosol composition and sources in the central Arctic
potential human health risk, Sci. Total Environ., 595, 828–838, Ocean during ASCOS, Atmos. Chem. Phys., 11, 10619–10636,
https://doi.org/10.1016/j.scitotenv.2017.04.023, 2017. https://doi.org/10.5194/acp-11-10619-2011, 2011.
Bates, T. S., Charlson, R. J., and Gammon, R. H.: Evidence for the Christidis, T., Erickson, A. C., Pappin, A. J., Crouse, D. L., Pinault,
climatic role of marine biogenic sulphur, Nature, 329, 319–321, L. L., Weichenthal, S. A., Brook, J. R., Van Donkelaar, A., Hys-
https://doi.org/10.1038/329319a0, 1987. tad, P., Martin, R. V., Tjepkema, M., Burnett, R. T., and Brauer,
Boy, M., Thomson, E. S., Acosta Navarro, J.-C., Arnalds, O., M.: Low concentrations of fine particle air pollution and mor-
Batchvarova, E., Bäck, J., Berninger, F., Bilde, M., Brasseur, tality in the Canadian Community Health Survey cohort, Envi-
Z., Dagsson-Waldhauserova, P., Castarède, D., Dalirian, M., de ron. Health, 18, 84, https://doi.org/10.1186/s12940-019-0518-y,
Leeuw, G., Dragosics, M., Duplissy, E.-M., Duplissy, J., Ek- 2019.
man, A. M. L., Fang, K., Gallet, J.-C., Glasius, M., Gryning, Conca, E., Abollino, O., Giacomino, A., Buoso, S., Traversi, R.,
S.-E., Grythe, H., Hansson, H.-C., Hansson, M., Isaksson, E., Becagli, S., Grotti, M., and Malandrino, M.: Source identification
Iversen, T., Jonsdottir, I., Kasurinen, V., Kirkevåg, A., Korhola, and temporal evolution of trace elements in PM10 collected near
A., Krejci, R., Kristjansson, J. E., Lappalainen, H. K., Lauri, A., to Ny-Ålesund (Norwegian Arctic), Atmos. Environ., 203, 153–
Leppäranta, M., Lihavainen, H., Makkonen, R., Massling, A., 165, https://doi.org/10.1016/j.atmosenv.2019.02.001, 2019.
Meinander, O., Nilsson, E. D., Olafsson, H., Pettersson, J. B. Crocchianti, S., Moroni, B., Dagsson-Waldhauserova, P., Becagli,
C., Prisle, N. L., Riipinen, I., Roldin, P., Ruppel, M., Salter, M., S., Severi, M., Traversi, R., and Cappelletti, D.: Potential source
Sand, M., Seland, Ø., Seppä, H., Skov, H., Soares, J., Stohl, A., contribution function analysis of high latitude dust sources over
Ström, J., Svensson, J., Swietlicki, E., Tabakova, K., Thorsteins-
Atmos. Chem. Phys., 21, 14199–14213, 2021 https://doi.org/10.5194/acp-21-14199-2021You can also read