Evaluation of femtosecond laser induced breakdown spectroscopy system as an offline coal analyzer
←
→
Page content transcription
If your browser does not render page correctly, please read the page content below
www.nature.com/scientificreports
OPEN Evaluation of femtosecond
laser‑induced breakdown
spectroscopy system as an offline
coal analyzer
Sahar Sheta1*, Zongyu Hou1, Yun Wang2 & Zhe Wang1*
Developments in femtosecond laser induced breakdown spectroscopy (fs-LIBS) applications during
the last two decades have further centered on innovative métier tie-in to the advantageous properties
of femtosecond laser ablation (fs-LA) introduced into LIBS. Yet, for industrially-oriented application
like coal analysis, no research has exposed to view the analytical capabilities of fs-LA in enhancing the
physical processes of coal ablation and the impact into quantitative correlation of spectra and data
modeling. In a huge coal market, fast and accurate analysis of coal property is eminently important
for coal pricing, combustion optimization, and pollution reduction. Moreover, there is a thirst need
of precision standardization for coal analyzers in use. In this letter, the analytical performance of
a one-box femtosecond laser system is evaluated relative to an industrially applied coal analyzer
based on five objectives/measures: spectral correlation, relative sensitivity factors, craters topology,
plasma parameters, and repeatability. Despite high-threshold operation parameters of the fs
system, competitive results are achieved compared to the optimized analytical conditions of the
ns-coal analyzer. Studies targeting the in-field optimization of fs-LIBS systems for coal analysis can
potentially provide insights into fs-plasma hydrodynamics under harsh conditions, instrumental
customization, and pave the way for a competitive next-generation of coal analyzers.
Coal energy is used to generate a remarkable chunk of the nation’s electricity and clean coal industry has pro-
moted more attention to an abundant energy source1,2. Retrofitting coal and oxy-air in a furnace for optimized
combustion requisites coal handling, preparation, and power plants to extensively use quality monitoring systems.
Coal quality analysis is performed by several analytical techniques which are classified into two main categories:
standards and alternatives. Standard methods are a number of strictly-regulated chemical-based techniques,
normally utilize a few grams of coal samples from tons travelling on a conveyor belt, and require several hours.
Therefore, standard methods are not able to provide representative results due to the inhomogeneity inherent in
coal nor to be qualified for real-time requirements. Alternative methods are physical-based techniques, such as:
X-ray fluorescence (XRF), prompt gamma neutron activation analysis (PGNAA), laser-induced breakdown spec-
troscopy (LIBS), near-infrared spectrometry (NIRS), inductively-coupled plasma atomic emission spectrometry
(ICP-AES), atomic absorption spectrometry (AAS), and microwave analysis. Among these, XRF, PGNAA, NIRS,
and LIBS are able to provide real-time measurements. LIBS—utilizing nanosecond lasers, has been industrially
applied for coal analysis with reasonably simple, robust, and compact analyzers which suit the three installation
ffline3. Comparatively high sensitivity (unlike XRF), safe operation
sets in a power plant: inline, at-line, and o
(unlike PGNAA), and affordable prices (unlike NIRS) forge LIBS as a levelheaded technique for quantitative
analysis in coal-fired applications. However, furtherance in measurement accuracy and performance has been
one of the important concerns for wide c ommercialization4.
Nanosecond-based LIBS coal analyzers have a long journey with several reported letters on their designs,
installation modes (in-line, at-line, and offline), and performance. Inline coal analyzers are directly shooting at
coal blocks or pulverized coal over the belt with no sampling system required to feed the analyzer. This is the
most convenient way for fast in-situ analysis. However, inline analyzers yield results which suffer from severe
measurement errors and high uncertainty. At-line coal analyzers are placed besides the coal flow where samples
1
State Key Lab of Power Systems, Department of Energy and Power Engineering, International Joint Lab
on Low Carbon Clean Energy Innovation, Tsinghua University, Beijing 100084, China. 2Renewable Energy
Resources Laboratory, Department of Mechanical and Aerospace Engineering, University of California, Irvine,
CA 92697‑3975, USA. *email: sahar_sheta@niles.edu.eg; zhewang@tsinghua.edu.cn
Scientific Reports | (2021) 11:15968 | https://doi.org/10.1038/s41598-021-95317-8 1
Vol.:(0123456789)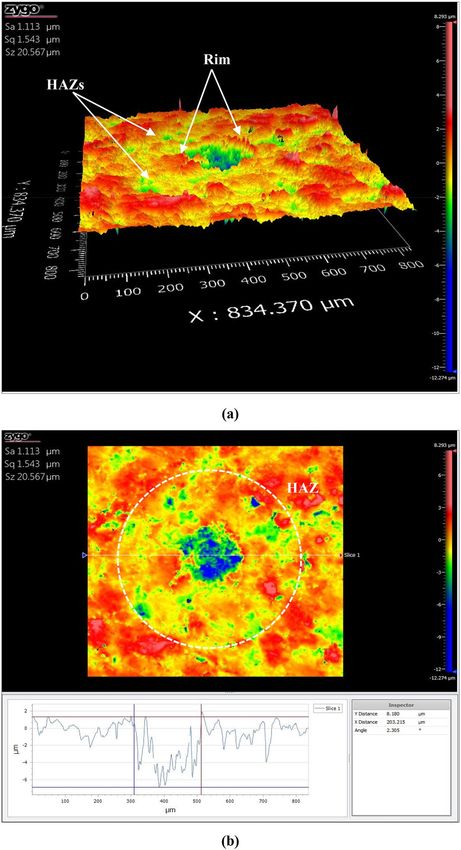
www.nature.com/scientificreports/
are made using a sampling system. Offline coal analyzers are usually one-box/unit LIBS systems located near
the coal utilization line or at laboratories. The sample is prepared by choosing representative samples from the
belt, grinding, mixing, pressing into pellets, analyzing, and finally sending back to the coal stream. Romero
et al.5 developed an offline coal analyzer to be installed in a power plant and utilized coal samples from 3 mines.
Samples were crushed into ~ 250 μm and dried to remove moisture. The unit achieved measurement accuracy
for elemental composition within ± 15% (absolute). The unit consists of a ns-ablation source (10 ns pulse width),
optical spectrometer, photodiode/amplifier, and processing computer. The sample chamber, machined from alu-
minum, comprises a sample cart and motorized XY stage, and designed to allow a nonoxygen atmosphere. Data
processing was done using artificial neural network models to determine ash fusion temperature with ± 14% °C
average precision. Zhang et al.6 designed a fully software-controlled LIBS unit with a ns-ablation source (8 ns
pulse width), analysis chamber, and a control module. The analysis chamber included a stepping-motor stage
and a jet pump to create negative pressure to suck the generated aerosols. A closed-loop feedback laser energy
stabilization methodology reduced RSDs of energy variations from ± 5.2% to ± 1.3%. Coal properties; ash con-
tent, volatile matter content, and calorific value, were predicted using SVM combined with PCA and the average
relative error of prediction reduced from 8.3% to 5.48%, 5.83% to 4.42%, and 5.4% to 3.68%, respectively. On
a laboratory level, Redoglio et al.7,8 designed a moving system comprised a 500 mm-diameter circular array to
house coal samples and rotate at fixed speed. The optical system with a large depth-of-field mirror was utilized
to overcome the changing in coal rocks’ height. This combination of sample rotating tray and optical system
allowed scanning coals at desired sampling frequency to cope with the in-line requirements of analysis. A close
design was employed by Gaft et al.9,10 at LDS LIBS unit (in-line mode of operation) to overcome the variation
of coal height using an ultrasonic sensor which moves the entire optical system to maintain the focal length of
the focusing lens. The different designs in literature have proved useful in providing technical specifications for
LIBS customization in coal industry. Along with the ameliorating of data modeling, a wide research direction is
opened for next generations of LIBS coal analyzers with ultrafast lasers as ablation sources.
In fact, progress in analytical techniques based on laser ablation (LA) continually places demands on devel-
oping informative analytical methods with competing performances for different applications. Ultrashort pulse
lasers (pulse width < 1 ps) have addressed fundamental changes in the ablation process due to different mecha-
nisms of power dissipation. LIBS, as an analytical technique widely used for solid sampling, benefits by femto-
second lasers as ablation sources and improves its figures of merit with: enhanced r epeatability11, reduced matrix
effects12, better depth control and quality crater13, and reduction in damage14,15. At present—to the authors’
knowledge, only two references to date make use of fs-LIBS systems to coal analysis. Hemalaxmi et al.16 detected
C, Al, Fe, and Ca in coal and ash samples using fs-LIBS system. The carbon content was found to be correlated to
the C2 and CN molecular bands. Jian et al.17 combined fs-LIBS with PLS model to quantitatively determine the
calorific heat value in coal samples. Authors claimed that when the fs laser is used as the ablating source and a ns
laser is used for heating plasma, the dual-pulse system would improve the quantification results. Despite useful
results to this end, no introductory study has evaluated ultrafast lasers as innovative ablation sources for coal
analysis in comparison to industrially-applied coal analyzers. This approach paves the way to methodical optimi-
zation studies from a technical point of view; necessary to provide solutions for LIBS analytical tasks in industry.
In this letter, a fs-LIBS system is evaluated in comparison to industrially applied coal analyzer. The concept
described in this paper evolves in steps to cover five objectives for a performance measure that starts with empha-
sizing the differences between fs and ns-LAs analytical capabilities to represent coal structure by analyzing lines
with highest correlation coefficients to coal properties. Molecular fragmentation and ionization are discussed
to understand the high representativeness and selectiveness of lines within molecular bands correlated to coal
properties in case of fs-LA. Ionic and atomic lines abundancies in fs-plasma are tested by calculating relative
sensitivity factors. Coulombic regime of plasma hydrodynamics in fs-LA incurs fast dissipation of pulse energy
density where electrostatic ejection and formation of atomic, ionic, and molecular fragments are dominant.
Craters morphologies are examined to explain the enhanced laser-energy coupling in case of fs-LA. Plasma
temperatures and electron number densities are calculated and the cooler ablation of fs plasmas is emphasized.
Later, spectral repeatability is accessed by average measurement-to-measurement relative standard deviations
(RSDs) of raw spectral lines. At the end of this letter, a discussion about the applicability and problems of fs-LIBS
systems for industrial applications is conducted, along with the evaluation results and summary.
Results and discussion
Correlation coefficients. Direct correlation between quantitative information of coal spectra and coal
IBS18. The situation is complicated due to: matrix com-
analysis is one of the tentative and tricky applications of L
plexity and property interdiscursivity of coal. The heterogeneous composition of coal, with a mixture of organic
and inorganic molecules which are considerably varying in size and structure19, implements fluctuated plasma
kinetics and spectral interdependency. The coal properties interdiscursivity is simply noticed by calorific heat
value, volatile, and ash contents definitions. Caloric heat value is the net heat released from coal combustion with
oxygen. It integrates the combustion heat of C, H, O, S, ash, and volatile matter contents. Volatile matter includes
long-chains hydrocarbons, aromatic hydrocarbons, and sulfur. Ash includes the noncombustible residue of min-
eral oxides and sulfates. Therefore, major and mineral lines carry spectral information related to different coal
properties. In this work, a total of 998 and 900 lines are observed by the fs and ns LIBS systems, respectively
(denoted as fs-Solstice and ns-Chem—see materials and systems section for more details). The congestion of the
coal spectra due to abundance of mineral elements makes emission lines identification a cumbersome task and
misidentification of lines is easily probable. Therefore, spectra from fs-Solstice and ns-Chem systems were care-
fully identified using NIST database20 and confirmed by literature. A plentiful population of atomic, ionic, and
Scientific Reports | (2021) 11:15968 | https://doi.org/10.1038/s41598-021-95317-8 2
Vol:.(1234567890)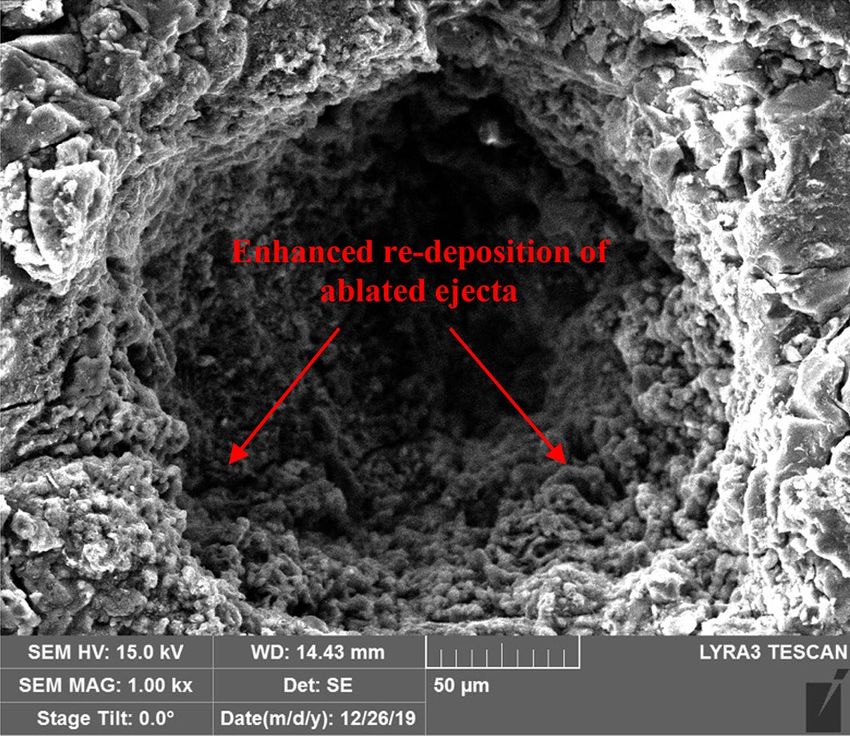
www.nature.com/scientificreports/
Figure 1. Coal spectra obtained by fs-Solstice system in (a) and ns-Chem system in (b). A plentiful population
of atomic, ionic, and molecular lines in both spectra indicates the enrichment of plasma species in the fs and ns
ablation conditions.
molecular lines are observed in both spectra indicating the enrichment of plasma species in fs and ns ablation
conditions as shown in Fig. 1.
This expected congestion of coal spectra means that the normal situation of extracting coal properties from
specified spectral lines might limit the analysis accuracy due to stepwise c orrelations21. Consequently, several
multivariate and hybrid models22–24 have been used to extract correlated spectral information to concentrations.
These models, still and all, provide robust algorithms to enhance quantitative measurements for a number of
applications, but have degraded accuracy for materials with heterogenous/matrix composition like coals3. With
increasing chemical complexity, algorithms functionalize with solely statistical correlations or curve overfitting
eventually ruin the measurement trueness due to lack of physical picture of the fingerprint emissions from par-
ent molecules in the LA process. To this extent, it is significant to emphasize the analytical capabilities of fs-LA
to represent coal structure by analyzing lines with highest correlation coefficients to coal properties relative to
those obtained by the optimized ns-Chem system. Pearson correlation (r) is commonly used in linear regression
to measure a relationship strength between two variables. It is given by the f ormula25:
Scientific Reports | (2021) 11:15968 | https://doi.org/10.1038/s41598-021-95317-8 3
Vol.:(0123456789)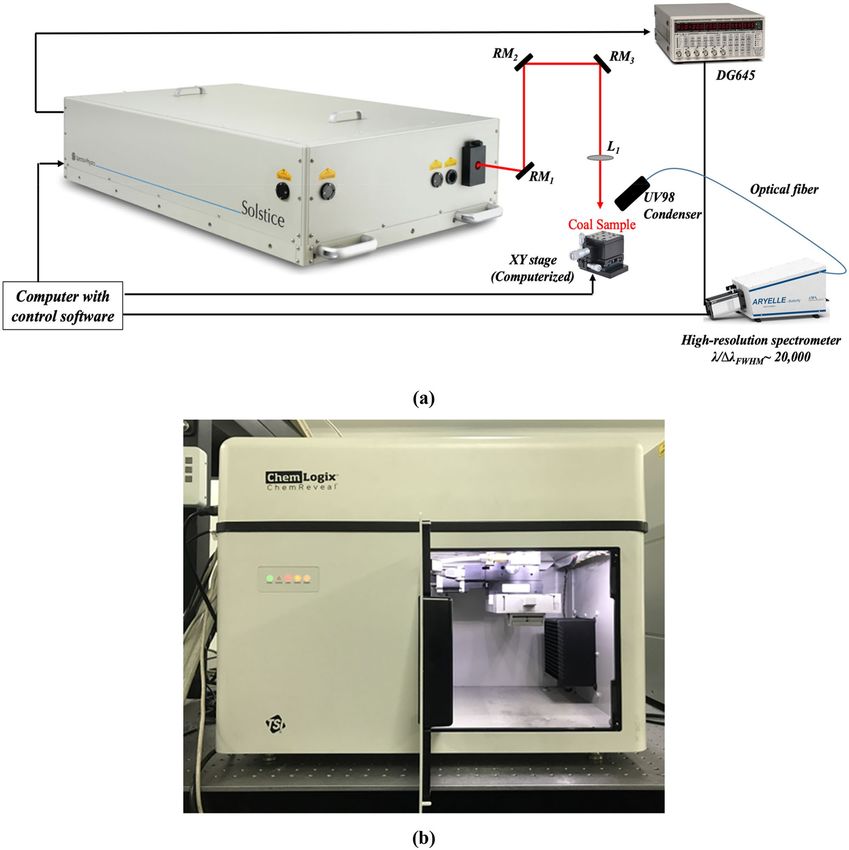
www.nature.com/scientificreports/
Figure 2. Average of Pearson’s correlation coefficients of 10 most correlated lines to carbon content, heat value,
volatile, and ash contents obtained by fs-Solstice and ns-Chem systems.
(x − x) y − y
r =
2 (1)
(x − x)2 y − y
where; r is the correlation coefficient, x is the standard value and y is the line intensity. The bar sign shows the
average value of all measurements.
Pearson correlation analysis has been used for the identification, classification, and determination of physical/
chemical properties of different materials relative to reference spectra. However, to ensure correct and fair cor-
relation magnitude of r, a few factors have to be considered: (1) Essential spectra related to laser-matter interac-
tion and probably to a surrounding gas have to be included while non-essential spectral information (random
noise) have to be excluded; (2) Sufficient number of observations (well-resolved and non-saturated lines) should
be available in correlated spectra to confirm correct representativeness of r; (3) Multiple sampling is essential to
avoid misleading r values due to strongly nonlinear character of a combination of factors such as the laser-matter
interaction, surface roughness, sample heterogeneity, e tc26. Considering those factors, Gornushkin et al.27 used
Pearson correlation for the identification of glass samples of forensic interest. The spectral data was utilized after
two pre-processing steps of: rejection of spectral outliners (filtering) and removal of spectral fragments which
contain no correlated information (masking). The proposed procedure showed 100% identification rate. Lentjes
et al.28 found that averaging the spectra enhanced the correlation accuracy from 79% for single shot to 99.9% for
average spectra. Therefore, during our work, multi-pulse averaging, background subtraction, and normalization
by the whole spectral area were applied as pre-processing methods to compensate for variations in laser energies
and to ensure fair r values for each system. Visual inspection of spectral lines was done to ensure that the lines
which showed highest correlation are non-saturated lines, well-resolved, and have stable intensity over the 40
samples (validity for analytical use). Figure 2 shows average correlation coefficients of 10 most correlated lines
for carbon content, heat value, volatile, and ash contents using fs-Solstice and ns-Chem systems. The error bars
are standard deviations of 40 measurements corresponding to 40 samples in use. The correlation coefficients of
carbon, heat value and ash are ≥ 0.949 for fs-Solstice and ≤ 0.923 for ns-Chem showing higher representativeness
of the fs spectra to coal property. For volatile matter content, the fs-spectra show correlation of 0.566 which is
lower than 0.845 for the ns-spectra. The identification of the correlated lines for each coal property may uncover
reasons behind low r values in case of volatile matter content and reveal differences in ablation mechanisms for
fs-Solstice relative to ns-Chem.
Table 1 illustrates the identification and evaluation of the 10 most correlated lines for carbon content. The
correlation coefficients vary between 0.975 and 0.971 for fs-Solstice, while for ns-Chem, correlation coefficients
show larger variations between 0.907 and 0.879 for the 10 most correlated lines. For fs-Solstice spectra, seven
lines are identified29 within the CN (B2 + − X2 +) violet system (�ν = −1), while three lines are Fe I and
V I mineral lines. For ns-Chem spectra, two C I lines at 798.8 and 804.4 nm show high correlation with carbon
content. Other organic lines are an O I line at 799.5 and N I triplet at 742.4, 744.3, and 746.9 nm. Residuals are
four mineral lines of V I, Cu II, Ti II, and Cs II. Same lines with different correlations order show r values ranged
Scientific Reports | (2021) 11:15968 | https://doi.org/10.1038/s41598-021-95317-8 4
Vol:.(1234567890)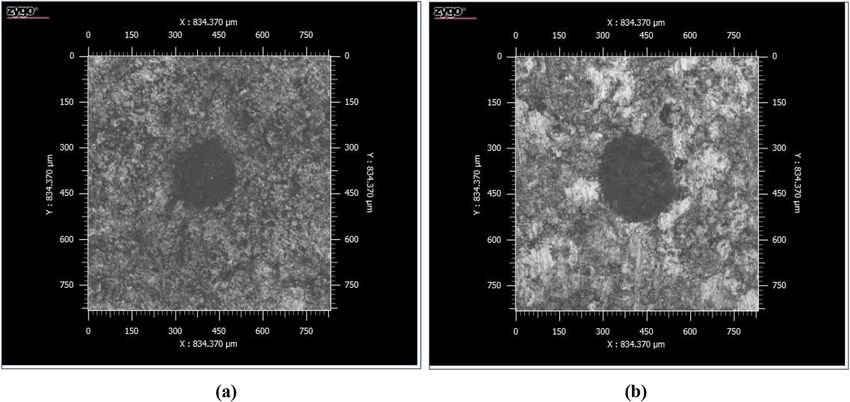
www.nature.com/scientificreports/
Carbon content
fs-Solstice ns-Chem
λ/nm r Line λ/nm r Line Evaluation
417.645 0.975 CN 798.855 0.907 CI
417.953 0.974 CN 804.458 0.906 CI
371.600 0.974 Fe I 809.361 0.904 VI
417.526 0.973 CN 799.572 0.904 OI
418.240 0.973 CN 789.590 0.903 Cu II
Higher representativeness of fs-Solstice spectra (larger r values)
417.189 0.973 CN 790.968 0.903 Ti II
415.808 0.972 CN 793.434 0.902 Cs II
411.777 0.972 VI 744.322 0.882 NI
415.709 0.972 CN 742.480 0.881 NI
373.119 0.971 VI 746.971 0.879 NI
Table 1. Evaluation of fs-Solstice spectra correlation to carbon content in coal samples.
Heat value
fs-Solstice ns-Chem
λ/nm r Line λ/nm r Line Evaluation
415.808 0.970 CN 798.855 0.924 CI
375.543 0.968 Cs II 789.590 0.924 Cu II
415.236 0.968 CN 809.361 0.923 VI
356.533 0.968 N2+ 804.458 0.923 CI
355.280 0.968 N2+ 790.968 0.923 Ti II
Higher selectiveness of fs-Solstice spectra (different molecular fragments correlated)
354.413 0.968 N2+ 793.434 0.921 Cs II
373.119 0.968 VI 799.572 0.921 OI
418.240 0.968 CN 744.322 0.896 NI
356.204 0.968 N2+ 746.971 0.894 NI
415.674 0.967 CN 742.480 0.894 NI
Table 2. Evaluation of fs-Solstice spectra correlation to heat value in coal samples.
between 0.924 and 0.894 to caloric heat content as shown in Table 2. While for the fs-Solstice spectra, four lines
are identified within the CN molecular band where two of them correlate to heat value and not to carbon content
showing higher selectiveness of the fs-LA relative to its ns-counterpart. Another four lines are unforeseen emis-
sions from the second positive band system30,31 (C3 u − B3 g transition) of N2. It means that 7/10 and 8/10 of
the most correlated lines for carbon content and heat value respectively are molecular lines for fs-Solstice spectra.
During the last few years, molecular fragmentation and ionization have been evolved significantly in molecu-
lar sensing studies as fundamental interaction processes in fs-LA32,33 of organic materials. Due to the short-time
interaction of super intense laser fields, the geometrical structure of molecules becomes deformed within ~ 100 fs
and tunneling ionization occurs. Charged molecules are formed triggered by strong Coulombic repulsive force
and abrupt chemical bond fission occurs where atomic and ionic species with large kinetic energies are ejected.
In collisional environment like air, resultant ions/fragments undergo random scattering/collision reactions in
a relatively slower time scale leading to optical emissions. In an ideal reaction process; i.e. collision-less, fs-LA
molecular ejecta is typically fingerprinting the parent molecules. The formation pathways of CN molecular bands
in fs-based interaction zone have been discussed under three major formation mechanisms: direct fragmentation
from species containing CN bonds in its structure at early stages of plasma evolution near surface (native CN),
recombination of atoms from compounds in plasma to produce CN molecules (collisions-CN), and reactive
atomic recombination of C from plasma with N from ambient or air (ambient-CN). For the 2 nd and 3 rd path-
ways, CN molecules’ detection is sensitive to spatiotemporal conditions of the plasma. The persistence of CN
molecular bands in fs-LAs is well reported. Baudelet et al.34 investigated native CN molecular bands of bacteria
where the band-head intensity reached maximum at 450 ns delay time. Zhao et al.35 found that the native CN
band-head persisted before 700–800 ns delay time (the delay time chosen in our experiment is 400 ns). As for
the nitrogen band, the N 2+ fragments could come f rom36: collision of resultant fragments (NH radicals) within
the dense plasma or with ambient particles or with energetic electrons. Since N–N bond structure might not
exist in coals, N2+ fragments are probably formed due to ionization of air by energetic electrons at the interaction
zone on coal surface—which is the claim behind enhanced residual thermal energy deposition explained later
in this paper. Yet, the dynamical reactions of hydrocarbons in air are still under i nvestigation37. Figure 3 shows
the CN (B2 + − X2 +) and the N2 (C3 u − B3 g ) molecular systems detected into fs-Solstice spectra of coal
and show high correlations to carbon content and heat value.
Scientific Reports | (2021) 11:15968 | https://doi.org/10.1038/s41598-021-95317-8 5
Vol.:(0123456789)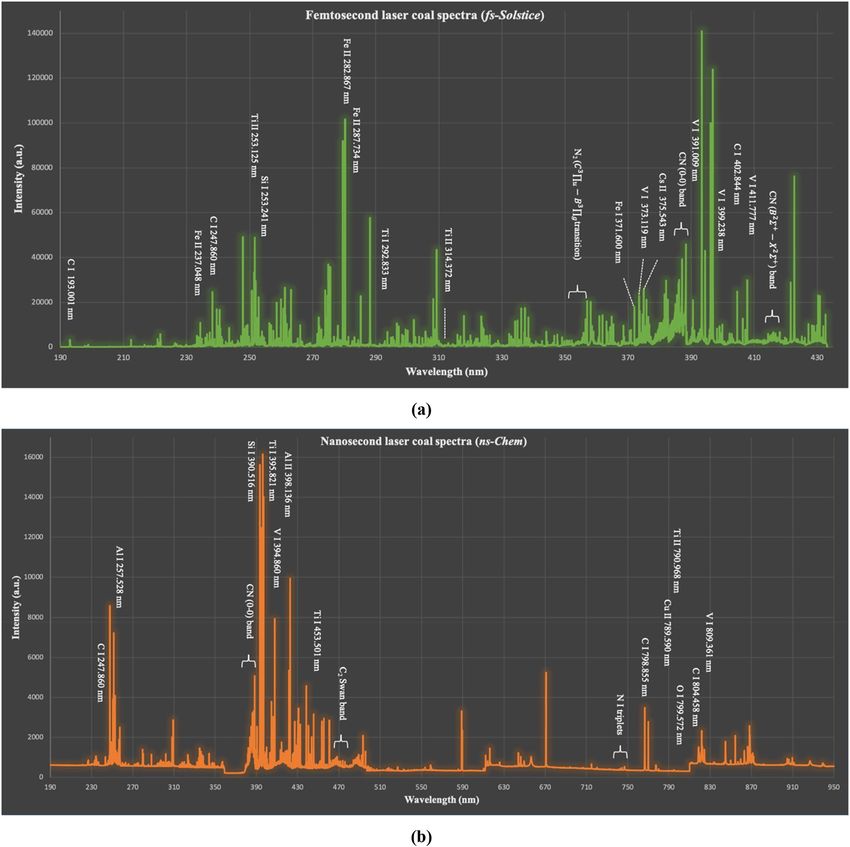
www.nature.com/scientificreports/
Figure 3. The CN (B2 + − X2 +) and the N2 (C3 u − B3 g ) molecular systems detected into fs-Solstice
spectra of coal and lines within which show high correlations to carbon content and/or heat value.
As for volatile matter content, Table 3 depicts the lines of fs-Solstice and ns-Chem spectra which show high-
est to volatile matter content. For ns-Chem spectra, lines are detected within the C2 swan system
correlations
(d 3 g − a3 u ) and r values are in the range 0.853–0.841 (weak correlation values). As a consensus reality,
volatile matter content determination is a hectic task due to limitations related to the accuracy of the eventual
detection of elements integrating spectral information to the property content. In a sense, volatile matter is
standardly measured as the weight percent of gas (emissions) that is released during heating a dried coal sample
to 950 °C in an oxygen-free environment by thermogravimetric analysis (TGA). The integrated intensities of
C, H, O, N, and S lines are hypothetically representing correlated data set to volatile content. However, O and
N can be originating from the surrounding air and reaction of O with minerals in coal to form ash have to be
considered during data handling. Moreover, sulfur is volatilized as sulfur dioxide with hardly detectable lines in
many experimental protocols. Yao et al.38 discussed coals with different volatile contents and found that changes
in volatile content ushered different emission line intensities and spatial distribution of major and mineral ele-
ments in the evolved ns-plasma. Several experimental and data modeling methods have been discussed in litera-
ture to enhance volatile matter content measurement by LIBS. We refer to the collection of works summarized
in the analytical results section of the tutorial review by Sheta et al.3. For fs-Solstice spectra, weaker correlation
is detected (r values are in the range 0.704–0.518) than those of the reference spectral set. Despite 6/10 of the
most correlated lines are CN and C I lines, it may just be a statistical artifact instead of based on real physical
Scientific Reports | (2021) 11:15968 | https://doi.org/10.1038/s41598-021-95317-8 6
Vol:.(1234567890)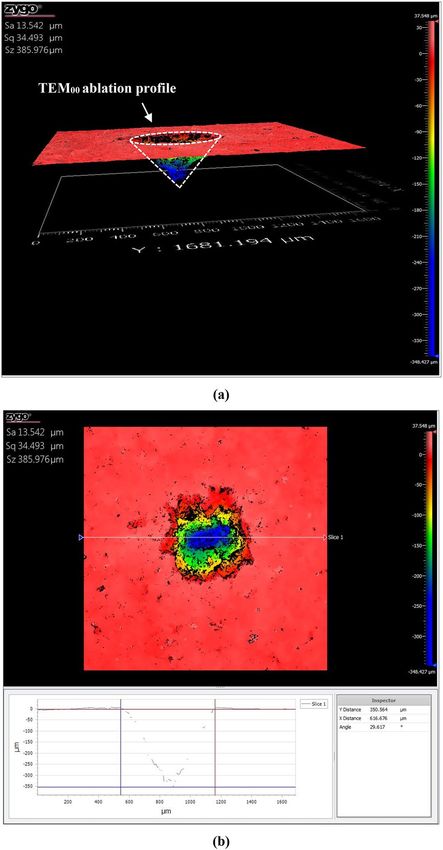
www.nature.com/scientificreports/
Volatile content
fs-Solstice ns-Chem
λ/nm r Line λ / nm r Line Evaluation
314.372 0.704 Ac I 473.599 0.853 C2
387.646 0.585 CN 471.403 0.848 C2
387.692 0.575 CN 468.383 0.846 C2
391.009 0.573 VI 470.332 0.845 C2
387.588 0.567 CN 470.131 0.844 C2
Weak correlation of both fs-Solstice and ns-Chem (reference data set) spectra
399.238 0.549 VI 469.662 0.844 C2
402.844 0.535 CI 470.667 0.842 C2
373.964 0.526 Pb I 470.466 0.842 C2
387.744 0.524 CN 471.002 0.841 C2
193.001 0.518 CI 469.997 0.841 C2
Table 3. Evaluation of fs-Solstice spectra correlation to volatile content in coal samples.
Ash content
fs-Solstice ns-Chem
λ/nm r Line λ/nm r Line Evaluation
253.125 0.955 Ti II 395.821 0.949 Ti I
292.833 0.954 Ti I 395.661 0.947 Fe I
237.048 0.952 Fe II 394.860 0.943 VI
282.867 0.950 Fe II 399.886 0.929 Ti I
287.734 0.950 Fe I 398.136 0.927 Al II
High correlation of both fs-Solstice and ns-Chem spectra
237.517 0.948 Fe II 398.933 0.922 Ti I
226.005 0.947 Fe II 453.501 0.916 Ti I
236.923 0.945 Fe II 453.289 0.910 Ti I
309.712 0.943 Ti II 390.516 0.896 Si I
253.241 0.943 Si I 257.528 0.885 Al I
Table 4. Evaluation of fs-Solstice spectra correlation to ash content in coal samples.
background. Worth to mention that the molecular band correlated to volatile content by the ns-Chem spectra is
out of the spectrometer range for the fs-Solstice system. The importance of establishing an accurate correlation
between spectral data set and volatile matter content urges attention to further studies based on understandable
interpretation of LA-physics. For ash content, Table 4 collects the identified lines correlated to the property. Both
spectra revealed well-resolved, non-saturated, and mineral lines of Ti, Si, and Fe with larger r values detected
for fs-Solstice lines. Unexpectedly, mineral lines most correlated to ash content are mainly ionic for fs-Solstice
spectra and atomic for ns-Chem which is contrast to the claim of fs-plasmas atomic nature39,40. The evaluation of
atomic and ionic lines abundance in fs-Solstice spectra would be investigated in the next performance measure
of the conducted evaluation study.
Relative sensitivity factor. With a few exceptions, minerals are the prim hosts of vast majority of elements
in coals41. On the basis of their concentration, mineral elements are considered minor and trace elements. How-
ever, they are easily atomized and ionized in coal matrix like Fe, Si, Mg, Al, Ti, and Ca and attribute to higher
emissions from matrixes and early stages of plasma formation42. Mineral elements affect, straightforwardly, the
detection accuracy of volatile and ash contents, and the plethora of their lines in coal spectra plays a key role in
full spectral information applied in several multivariate algorithms for enhanced quantitation. Relative sensitiv-
ity factor (RSF) is used to measure the spectral detection discernment of an element by intensity/concentra-
tion ratios normalized to an internal standard element. In other words, RSFs correct for the differences in the
response to several elements by a specific technique, as well as for changes in the response to a species due to
changes in matrix. A wide variety of analytical techniques, viz. glow discharge mass s pectroscopy43 and second-
ary ion mass s pectrometry44, rely on the use of RSFs for obtaining semi-quantitative results for multicomponent
samples. In this work, RSFs have been determined for the analysis of 6 mineral elements from multiple analyses
of the 40 standard coal samples representing different matrices for fs-Solstice system relative to ns-Chem system.
As each element has a fixed concentration in a specific sample, the sensitivity response of the fs system is meas-
ured with RSF, which is determined as follows45:
RSF = (Ix /IM )fs / (Ix /IM )ns (2)
Scientific Reports | (2021) 11:15968 | https://doi.org/10.1038/s41598-021-95317-8 7
Vol.:(0123456789)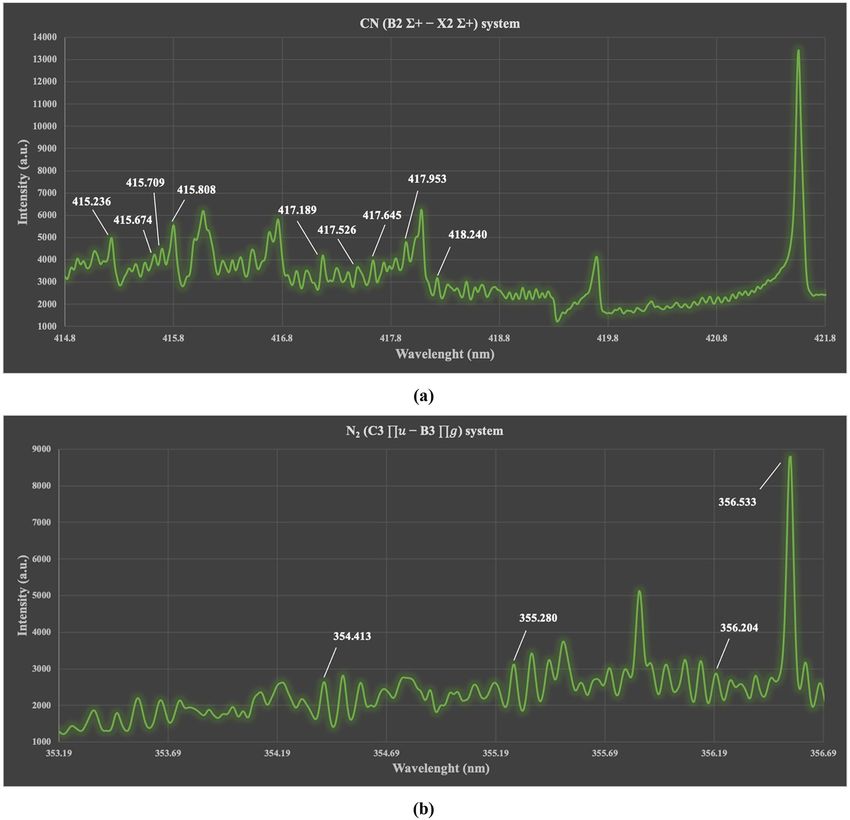
www.nature.com/scientificreports/
Figure 4. Relative sensitivity factors for 6 mineral elements: Fe, Si, Mg, Al, Ti, and Ca in coal matrix vary
between 2 to 10 showing enhanced sensitivity of fs-Solstice system relative ns-Chem system for minerals
detection.
where; x is the element of interest and M is an internal standard element. Since carbon is presented in all coal
samples, it was chosen as the internal standard element for RSF calculations.
Figure 4 depicts the mean RSFs for Fe, Si, Mg, Al, Ti, and Ca elements in 40 coal samples and are higher than 1
for all elements. RSFs vary between 2 and 10, showing enhanced detection sensitivity for fs-Solstice system relative
to its ns counterpart. For prominent lines such as Mg II 279.55 nm, Mg II 280.27 nm (commonly used for plasma
temperature correction to cancel its dependence on line intensities46), and Si I 288.16 nm (commonly used as
internal standard), RSFs are ~ 10 indicating 10 times enhanced detection of those lines in a normalized spectra
to its dominant element, i.e. carbon to by fs-Solstice system. Meanwhile, the response factor for Fe, Al, Ti, and
Ca elements shows RSFs between 2 and 7. Gross et al.47 correlated the RSFs of 4 alkali metals in single-particle
detection to both the ionization potential and lattice energy. A matter of fact is that for multicomponent analy-
sis, factors such as the atomization/ionization energy, lattice energy, absorption cross-section at the ionization
wavelength, and laser-particles interaction—all vary within each plasma and contribute to the final discernment
in each system. Zhang et al.12 demonstrated that the discrepancy of RSFs between fs and ns LAs is attributed
to the fundamental basis of high-irradiance laser ionization process in case of fs ablation. The RSFs variations
reduced to half for the fs system relative to ns-laser mode indicating reduction in matrix-effects. Owing to the
ultra-intense laser irradiance of fs laser ablation, atoms in lattice are atomized and ionized through multipho-
ton ionization, tunnel ionization, electron impact ionization, and avalanche ionization leading to a metastable
plasma cloud with direct ejection of ions in the solid–gas-mixture phase48. The higher RSFs for elemental detec-
tion makes fs-Solstice system a competitive choice for industrial coal quality analysis applications, and indeed,
for monitoring environmental pollutants of coal combustion reactions. Moreover, significantly high response
factors for mineral elements adds a one-point advantage for fs-Solstice system far beyond ns-Chem system for the
detection of minor and trace elements compared to x-ray diffraction (XRD) which provides little information
on trace elements associated with coal minerals.
The RSFs of ionic-to-atomic and ionic-to-ionic lines within fs-Solstice spectra are further studied to investigate
the abundance of ionic lines in fs plasma and their persistence in different spectra (40 spectra correlating to 40
samples in use)—see Fig. 5. The RSFs of Ca II 393.36 nm to Al I 394.40 nm lines show variations around 2 with
average RSF of ~ 2 ± 0.5 for all samples. This indicates enhanced presence/abundance of ionic lines in fs plasmas.
While, the average RSF of Mg II 280.27 nm to Mg II 279.55 nm has a mean value of ~ 1.02 ± 0.04 showing similar
presence for the same transition states. It is important to note that both of the selected transition sets are closely
spaced to avoid the detector sensitivity issues for further apart transitions in the optical spectrum. The plenti-
ful population of both atomic and ionic lines in fs coal plasma is in contrast to several research work, in which
dominancy of atomic lines was reported. Freeman et al.39 demonstrated neutral emission with little-to-no ionic
emission from fs-plasma of brass sample in both vacuum and atmospheric conditions. LaHaye et al.40 claimed
fs-LA plume to be more atomic due to absence of laser-plasma coupling relative to the more ionized plume of
Scientific Reports | (2021) 11:15968 | https://doi.org/10.1038/s41598-021-95317-8 8
Vol:.(1234567890)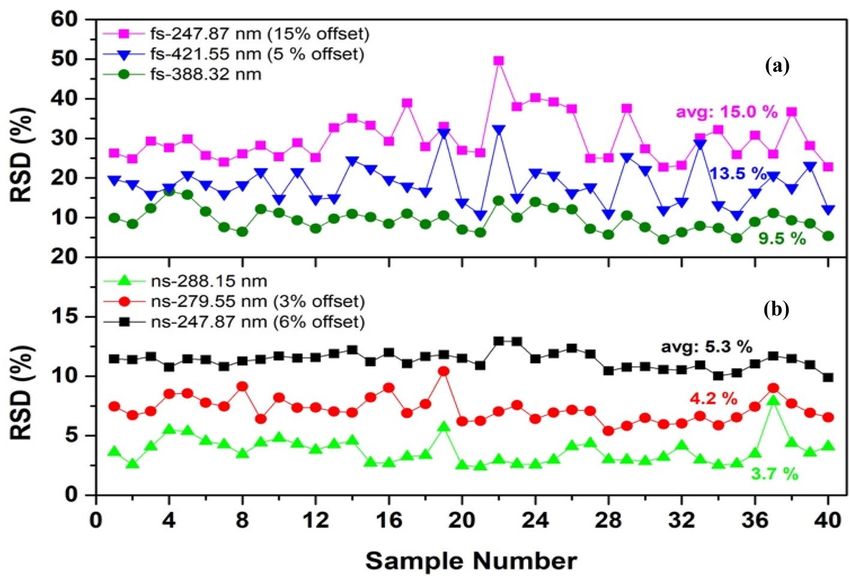
www.nature.com/scientificreports/
Figure 5. Relative sensitivity factors of ionic-to-atomic and ionic-to-ionic lines detected within fs-Solstice
spectra proving abundant presence of ionic lines in fs plasmas.
ns-LA, where laser interacts with plasma forming higher early excitation temperature and electron density.
Herein, the results show the prominence of higher ionic states in fs plasmas despite shorter life time and cooler
plasmas due to the fundamental ablation mechanisms. In fs-LA, the fast dissipation of pulse energy density into
the sample with minimized thermalization incur Coulombic regime of plasma hydrodynamics where electrostatic
ejection and formation of atomic, ionic, and molecular fragments is dominant. The high ionic states abundance
is found to increase with laser power density49. In ns-LA, the thermalization and plasma heating results in lower
ionization states50 and higher plasma parameters (both higher plasma temperature and electron density) due to
the dissipation mechanism of thermal energy into sample. The contrarieties in laser energy coupling between fs
and ns-LAs are clarified by craters morphologies.
Craters topology. The ablation features; i.e. mass and yield, of both fs-Solstice and ns-Chem systems are
investigated by focused ion beam scanning electron microscopy (FIB-SEM) and coherence scanning interferom-
etry (CSI) to better evaluate the formation mechanism of coal ejecta induced by fs-LIBS system relative to that
obtained by the ns-LIBS system.
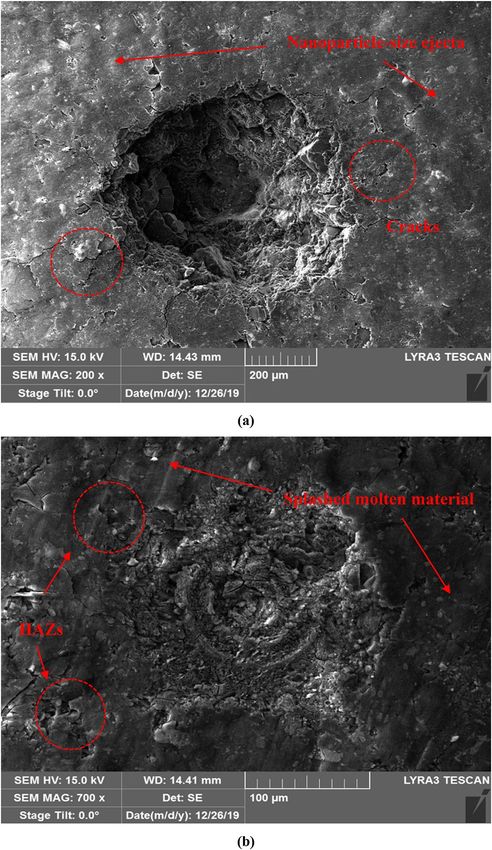
FIB‑SEM images. Figure 6a elucidates a precise crater with Gaussian-like profile obtained via fs-Solstice system
ablation, while the crater bottom can be clearly seen. The sample surface shows no rim formed nor heat-affected
zones (HAZs) of molten material. In contrast, both rim and HAZs are observed in case of ns-Chem ablation,
see Fig. 6b. Cracks at the crater’s edge are observed due to a strong fs-laser hit (a pulse train of 100 signals) in
ablation with electrostatic nature which are not observed in case of ns-Chem ablation (single shot) and replaced
with scattered HAZs of molten material formed in thermal explosion reaction. Splashed particles ejected from
molten ablated mass are distinguished on coal sample after ns-LA, and according to their temperature at the
landing time over the surface, they appear as HAZs or large agglomerates. For fs-LA, powdery appearance of
nanoparticles spread around the crater indicates that the coal ejecta is ablated in nanoscale particle size. This is
in agreement with the report by Liu et al.51 who studied the ablated aerosol vapor collected on silicon substrate
after fs and ns-LAs of brass alloy. SEM images showed ejecta formed by fs-LA were ~ 100 nm while those formed
by ns-LA were in 100 s nm to μm size scale. The slow thermalization and re-solidification of the ablated matter
on sample’s surface are significant sources of matrix effects and fractional evaporation. It should be noted that
ns-Chem is in optimal operation conditions of minimized HAZ to reduce matrix effects and to enhance signals
repeatability. The fs-Solstice system, which is not exactly working in optimal operation conditions for coal analy-
sis, shows reduction of thermal effects and proves absence of fractional evaporation.
CSI profiles. The 3D surface profilometer images show the alteration occurred to the coal sample after laser
ablation. Figure 7 shows the Gaussian beam profile of fs-Solstice laser which yields a cone-shaped crater accom-
panied with absence of molten rims and HAZs. The fs-crater has a surface diameter of 617 μm and depth of
350 μm. For ns-Chem system, rims as molten heights with pointed tips (look like stalactites) are formed around
the crater with HAZs are shown as random thermal grooves/modifications of coal surface, see Fig. 8. The ns-
crater has a surface diameter of 203 μm and depth of 8 μm. While fs-Solstice system employs a fs-laser with
Gaussian beam profile, ns-Chem system has a laser source with top-hat beam profile. Therefore, assuming the
ablated masses have right structures, fs-Solstice yielded ~ 3.5E−05 cm3 ablation volume (considering the fs-crater
has circular cone structure) and ns-Chem ablated ~ 1.5E−07 cm3 (considering the ns-crater has truncated cone
structure). Using the bituminous coal density (1.346 g cm−352), the ablated masses are ~ 40 and ~ 0.2 μg for fs-
Scientific Reports | (2021) 11:15968 | https://doi.org/10.1038/s41598-021-95317-8 9
Vol.:(0123456789)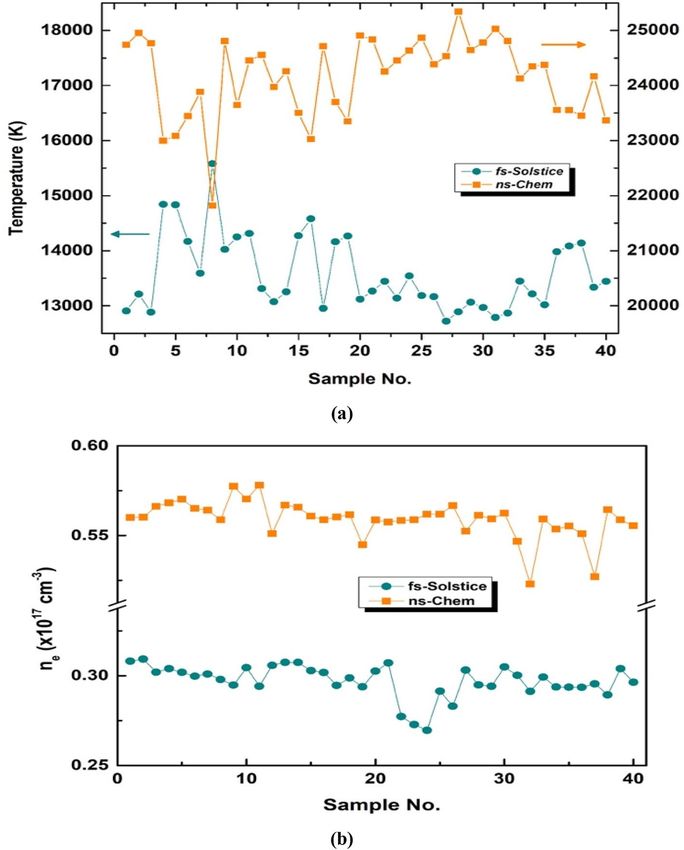
www.nature.com/scientificreports/
Figure 6. Focused ion beam scanning electron microscopy (FIB-SEM) images of laser ablation craters formed
using (a) fs-Solstice sytem where: no rim not heat affected zones (HAZs), cracks at the crater’s edge due to strong
fs laser hit, and powdery appearance of ejecta are observed; (b) ns-Chem system where: rim, HAZs, molten and
splashed particles are observed.
Solstice and ns-Chem systems, respectively. The ablation yield is defined as the mass ablated per laser pulse which
gives 0.4 μg/pulse for fs-Solstice system (a pulse train of 100 signals) and 0.2 μg/pulse for ns-Chem system. The
energy densities responsible for this ablation yield are calculated from the incident laser energies and spot sizes
for each system. For fs-Solstice system, the energy density is: (5.7 × 100 × 10–3) J/(π × (617 × 10–4)2 cm2 = 47.66
J cm−2. For ns-Chem system, the energy density is: (90 × 10–3) J/(π × (203 × 10–4)2 cm2 = 69.51 J cm−2. This means
that fs-Solstice system has double the ablation yield of ns-Chem system and ablates a mass which is 200 times
more that ablated by ns-Chem system with ~ 2/3 of the energy density employed. Table 5 summarizes the ablation
features for the evaluation of fs-Solstice relative to ns-Chem.
Several contributing factors have been discussed in literature to explain the phenomenology of enhanced
energy density deposition in fs laser matter interactions, including:
1. Enhanced laser energy coupling Considerably contrastive physics of energy deposition between fs and ns-LA
regimes is attributed to the pulse duration; i.e. time scales in which intense laser energy deposits. The fs laser
pulse has a pulse duration τL/fs shorter than the electron-lattice relaxation time τe. Therefore, fs-pulse energy
couples to electron carriers which follow Drude hydro-dynamics with various scattering and collision events
to relax energy into lattice. Hot electrons cause a high-pressure buildup within the crystal which is then
Scientific Reports | (2021) 11:15968 | https://doi.org/10.1038/s41598-021-95317-8 10
Vol:.(1234567890)www.nature.com/scientificreports/
Figure 7. 3D surface profilometer images of coal sample after ablation by fs-Solstice system: (a) is the 3D profile
and (b) is surface profile view. The ablated volume has a circular-cone structure accompanied with absence of
molten rims and heat affected zones. The crater diameter is 617 μm and its depth is 350 μm.
released via mechanical expansion in electrostatic ablation. The extremely rapid isochoric heating of lattice
pushes the system into metastable state where homogenous nucleation of gas bubbles in solid–vapor phase
explosion takes place. Moreover, mechanical fragmentation and spinodal decomposition are two effective
ablation mechanisms happening at high energy density regime. The two-temperature model53,54 is used to
describe the energy relaxation between electrons and lattice, as:
∂Te ∂ −ke ∂T e
Ce =−
∂z
− γ (Te − Ti ) + Ia αexp(−αz) (3)
∂t ∂z
∂Ti
Ci = γ (Te − Ti ) (4)
∂t
Scientific Reports | (2021) 11:15968 | https://doi.org/10.1038/s41598-021-95317-8 11
Vol.:(0123456789)www.nature.com/scientificreports/
Figure 8. 3D surface profilometer of coal sample after ablation by ns-Chem system: (a) is the 3D profile and
(b) is surface profile view. The ablated volume can be simulated as a truncate-cone structure with clear thermal
effects; rims and heat affected zones (HAZs). The crater diameter is 203 μm and its depth is 8 μm.
fs-Solstice ns-Chem
Crater width/μm 617 203
Crater depth/μm 350 8
Crater volume/cm3 3.5 × 10⁻⁵ 1.5 × 10⁻⁷
Mass of ejecta/μg 40 0.2
Ablation yield/μg per pulse 0.4 0.2
Energy density/J cm−2 47.66 69.51
Table 5. Craters and ablation features of fs-Solstice and ns-Chem systems for coal samples analysis.
Scientific Reports | (2021) 11:15968 | https://doi.org/10.1038/s41598-021-95317-8 12
Vol:.(1234567890)www.nature.com/scientificreports/
Figure 9. 2D surface profilometry images of single shots ablation using fs-Solstice system in (a) and ns-Chem
system in (b) clarifying the reduced thermal effects of fs-LA.
where; Ce is the heat capacity per unit volume of the electron subsystem, Te is electron temperature, Q(z) is
the heat flux which
is a function at z direction perpendicular to the target surface and given by:
Q(z) = −ke ∂T ∂z , γ is the electron-lattice coupling parameter, Ti is lattice temperature, S is the laser heating
e
source function and given by: S = AαI(t)exp − αz , Ci is the heat capacity per unit volume of the lattice
subsystem, ke is the electron thermal conductivity, A = 1 − R is the surface transmittivity, α is the material
absorption coefficient, and Ia is the absorbed laser intensity. For a fs-pulse, τL/fswww.nature.com/scientificreports/
Figure 10. Focused ion beam scanning electron microscopy (FIB-SEM) image of the interior part of coal
crater ablated by fs-Solstice system (a train pulse of 100 signals). The re-deposited ablated ejecta inside the crater
resemble those formed on the surface as nanoparticle-sized which confirms the enhanced thermal energy
deposition for fs-LA.
λ/nm Ek/eV Ei/eV Aki/s−1 gk gi
279.10 8.86 4.42 1.63 × 10⁻³ 6 2
279.56 4.43 0.00 2.60 × 10⁸ 2 4
279.81 8.86 4.43 4.79 × 10⁸ 4 6
280.27 4.42 0.00 2.57 × 10⁸ 2 2
Table 6. List of Mg II lines for plasma temperature calculation and corresponding spectroscopic parameters.
ki Iki Ek
ln =− +C (5)
gk Aki kB T
where; ki , Iki , gk , Aki , Ek , kB , and C are emission wavelength, integral intensity of emission line, degeneracy of
upper level energy, transition probability, upper-level energy, Boltzmann constant, and a constant, respectively.
Plasma temperatures are obtained using slope of the fitted line. Non-resonant ionic Mg II lines: 279.10, 279.56,
279.81, and 280.27 nm are selected to deduce the temperature. Our choice is based on using lines with same
ionization states and closely-spaced to reduce the effect of instrumental efficiency bias. For each sample, 100
spectra are averaged and normalized to the whole spectral area then Mg II lines are used to deduce the sample’s
plasma temperature. The Mg II lines exhibit ~ 20 times higher normalized peak intensities in case of fs-Solstice
spectra relative to ns-Chem spectra. This is attributed to the accumulation over fs train pulses, higher resolution,
and detector sensitivity of the spectrometer used in the fs system. Nevertheless, the integrated line intensities of
Mg II lines are used without background subtraction to encounter for population-averages of the local electronic
temperature through the lifelong detection window for each system. Table 6 collects the spectral line parameters
from NIST database20.
The electron density is determined by using the full-width at half maximum (FWHM) of spectral lines
according to Stark b roadening68:
1016
Ne = [� Stark × ] (6)
2ω
where; ω is electron impact parameter, and Stark is FWHM of Stark broadened profile. Lines’ profiles are
affected by different broadening mechanisms. Stark broadening and instrumental broadening are accounted for
in laser-induced plasmas; considering contribution of other broadening mechanisms is ignorable. The C I transi-
tion at 247.86 nm is used for electron density measurements and is fitted using a Voigt profile which considers
Stark broadening by Lorentzian profile and instrumental broadening by Gaussian profile. Stark broadening is
Scientific Reports | (2021) 11:15968 | https://doi.org/10.1038/s41598-021-95317-8 14
Vol:.(1234567890)www.nature.com/scientificreports/
Figure 11. Plasma temperatures in (a) and electron densities in (b) for 40 coal samples ablated with
fs-Solstice and ns-Chem plasmas. The average temperature value for fs system is 13,583 ± 679 K while for ns
system is 24,151 ± 732 K. The average electron number densities are 2.97 ± 0.09 × 1016 cm−3 for fs plasma and
5.59 ± 0.10 × 1016 cm−3 for ns plasma.
de-convoluted after inserting instrumental broadening for each system (22 pm and 0.5 nm FWHM for fs-Solstice
and ns-Chem systems respectively measured using a low-pressure mercury lamp) as follows:
2 1
2
� Stark(Lorentz) 2 � Stark(Lorentz)
(7)
� measured(Voigt) = + � Instru.(Gauss) +( )
2 2
Figure 11 depicts the plasma temperatures (in a) and electron densities (in b) for 40 coal samples analyzed
by each system. The average plasma temperature of all samples analyzed by fs-Solstice system is 13,583 ± 679 K.
While, it is 24,151 ± 732 K for ns-Chem system. Similarly, the average electron density is 2.97 ± 0.09 × 1016 cm−3
for fs-Solstice and is 5.59 ± 0.10 × 1016 cm−3 for ns-Chem. FWHM of other minor elemental lines (not shown)
expressed alike trend suggesting denser plasmas obtained by ns-Chem system ablation parameters. One might
consider that hotter and denser plasma conditions are better to obtain more ablation ejecta and spectral informa-
tion. While, fs-Solstice evaluation results of the performance measures: RSFs and craters topology with plasma
parameters show that cooler and less dense plasma may form less chaotic conditions for different elemental
species to evolve and gentle craters to form. The laser-plasma interaction is virtually absent, and thereby, fs-
plasmas are overcoming the shielding and re-heating effects typically caused by ns-laser e xcitation33. Therefore,
fs-Solstice plasmas have lower plasma temperatures and less electron density values relative to ns-Chem plasmas.
From physics point of view, as soon as the formed plasma temperature in the interaction zone reaches energy
Scientific Reports | (2021) 11:15968 | https://doi.org/10.1038/s41598-021-95317-8 15
Vol.:(0123456789)www.nature.com/scientificreports/
Figure 12. Relative standard deviations (RSDs) of 100 spectra for the 40 coal samples ablated by: (a) fs-Solstice,
and (b) ns-Chem systems with average RSDs of 9.7% and 2.5% for the two systems respectively. Offsets are to
avoid points’ overlapping for clarity.
magnitudes enough for breaking/melting, vaporization, and ionization of matter species, it validates for spec-
troscopy elemental detection. In a sense, an ideal plasma performs stoichiometric ablation with least chaotic
behavior. The electrostatic ablation nature and the absence of laser-plasma interaction promote fs-Solstice plasma
as competitive source for non-stochastic plasma parameters.
Measurement‑to‑measurement repeatability. Spectral repeatability is accessed by average measure-
ment-to-measurement RSDs of raw spectral lines. Figure 12 shows RSDs of 100 measurements (ablation matrix
of 10 × 10 positions) for 40 coal samples ablated by fs-Solstice (in a) and ns-Chem (in b) systems. The average RSD
of C I 247.87 nm line for all samples is 15% for fs-Solstice spectra; ~ 3 times higher than that obtained by ns-Chem
spectra (average RSD of 5.3%). The Sr II 421.55 nm line and the molecular band CN at 388.32 nm show average
RSDs of 13.5% and 9.5% respectively for fs-Solstice spectra. While, other lines including Si I line at 288.15 nm
and Mg II at 279.55 nm show lower average RSDs of 3.7% and 4.2% respectively in case of ns-Chem spectra. To
get an overall estimation of each system’s repeatability, the 100 lines with highest repeatability obtained by each
system are investigated. For fs-Solstice system, 100-highest repeatability lines have average RSD of 9.7%. The
repeatable lines are branches of CN or C2 bands due the stable formation of molecules; i.e. fragmentation. For
ns-Chem spectra, 100-highest repeatability lines have average RSD of 2.5%. The repeatable lines are atomic/ionic
lines of mineral elements.
The fact that fs-Solstice system has: stable crater morphology, ionized plasma cloud which is not interacting
with the laser tail, and ejecta formed in a cool plasma with considerably low chaotic behavior in a short lifetime,
encounter the expectation of higher signals repeatability relative to ns-Chem system. However, ns-Chem system
is optimized for best-signals repeatability and precise quantitative analysis as an offline coal analyzer already
operating in power plants. The work on the direction of optimizing the fs-Solstice system repeatability for coal
analysis would uncover interesting aspects about plasma modeling based on physical background where accuracy
is significantly boosted.
Industrial scale‑up of fs‑LIBS: applicability and problems. Ultrafast lasers are unique by incredibly
high peak intensities and interaction timescale faster than the lattice disorder and heat diffusion. Since their
development over half a century, researchers continue to uncover new phenomena about laser-matter interac-
tions. As for spectroscopic techniques, advances provided by femtosecond lasers have been directed to solve
different analytical tasks. LIBS benefits from femtosecond lasers and the review paper by Labutin et al.69 foresaw
a brighter future for numerous fs-LIBS applications due to state-of-the-art findings reviewed in studies. How-
beit, a slow mainstream adoption of fs- LIBS is observed relative to the analytical and industrial problems the
technique is capable to solve. This is attributed to: (1) Unavailability of reliable/stable high energy femtosecond
lasers; (2) Lack of fs-physics understanding quadrated with analytical capabilities; (3) Commercial restraints
such as high cost, maintenance, and performance; (4) Presence of other affordable techniques. In fact, the first
review paper of fs-LIBS by Gurevich et al.70 outlined two important points about scaling up fs-LIBS technique.
The first point is that a replacement of current widely-used technique cannot be expected without a better per-
formance in terms of analytical figures-of-merit by fs-LIBS based on understood plasma formation mechanisms.
Scientific Reports | (2021) 11:15968 | https://doi.org/10.1038/s41598-021-95317-8 16
Vol:.(1234567890)www.nature.com/scientificreports/
Performance measure fs-Solstice ns-Chem Evaluation
Higher representativeness and selectiveness of
r ≥ 0.949 r ≤ 0.923
fs-Solstice spectra to coal property
Correlation coefficients Different lines with most identified within Same lines correlated to carbon content and heat
Formation of molecular fragments correlated to
molecular bands value
parent molecules due to fs-laser ablation nature
Enhanced detection sensitivity of ionic and
Relative sensitivity factor RSFs ≈ 2–10
atomic species by fs-Solstice system
No rim nor heat-affected zone Clear rim and heat-affected zone Higher ablation yield of fs-Solstice system (0.4 μg/
Craters topology Ejecta in nanoparticle-size Splashed and molten material pulse relative to 0.2 μg/pulse for ns-Chem system)
Ablated mass = ~ 40 μg by 47.66 J c m−2 Ablated mass = ~ 0.2 μg by 69.51 J c m−2 due to enhanced laser-energy coupling
Plasma temperature = 13,583 ± 679 K Plasma temperature = 24,151 ± 732 K Cooler and less-dense fs-plasma incorporate less
Plasma parameters
Electron density = 2.97 ± 0.09 × 1016 cm−3 Electron density = 5.59 ± 0.10 × 1016 cm−3 chaotic behavior for stable ablation
Optimization of fs-Solstice system repeatability
Repeatability RSDs = 9.5–15% RSDs = 3.7–5.3%
is needed
Table 7. Performance measures and evaluation results of fs-Solstice system relative to ns-Chem for coal
analysis.
The second point is that a booming growth of ongoing trends such as femtosecond micromachining and surgery
applications can provide a way for simplified, compact, and all-solid-state femtosecond lasers. This means that:
(1) Ablation physics plays a significant rule in understanding the analytical capabilities and limitations of fs-
LIBS. Without such detailed physics understanding, effective optimization of fs-LIBS instrumentation is hardly
possible; (2) Industrial applications of fs-LIBS and trendy applications (e.g. thin films deposition, quantum dots
synthesis, chemical imaging, standoff environmental sensing, etc.) where fs-LIBS performs inline operation
monitoring are gateways for effective commercialization where cost and size reduce significantly. At present,
some research groups around the world are focusing on both directions of analytical performance of fs-LIBS
quadrated to its ablation physics and industrially-related applications. We believe that for coal analysis industry
with a huge market size, operation efficiency and accuracy have decisive impacts on a technique’s utilization
and fs-LIBS introductory-study presented in this letter is a challenging new task for a wide research direction
of in-field adaption of the technique. Table 7 summarizes the performance measures and evaluation results of
fs-Solstice system under assessment relative to ns-Chem system.
Conclusion
Femtosecond lasers provide enhanced analytical capabilities for different LIBS applications. In this work, we
have conducted an evaluation study of a one-box femtosecond laser system for the application of coal property
analysis relative to an industrially-applied coal analyzer. The evaluation study is based on using 5 different
objectives/measures: spectral correlations, relative sensitivity factors, craters topology, plasma parameters, and
repeatability—which cover different analytical performance aspects. The fs-LIBS system reveals competitive
results to those obtained by the reference coal analyzer:
• Higher representativeness (correlation coefficients) of fs-spectra to coal properties with different lines cor-
related to each coal property (higher selectiveness).
• Enhanced detection sensitivity and presence/abundance of ionic lines in fs-plasmas with relative sensitivity
factors of 2–10.
• Precise ablation craters with no rim nor heat-affected zones of splashed/molten material due to enhanced
laser energy coupling for fs-plasmas. The fs-system has higher ablation yield of 0.4 μg/pulse vs. 0.2 μg/pulse
for the reference system.
• Cooler and less-dense fs-plasmas incorporate less chaotic behavior for stable ablation.
• Further studies have to be conducted for in-field optimization of fs-system, includes: signals repeatability for
precise quantitative results, operation under harsh conditions, customization for different installation sets in
power plants, etc.—the reference coal analyzer has higher signals’ repeatability.
Materials and systems
Samples. Samples used in this study were 40 standard powdery bituminous coal samples. Table 8 shows the
certified chemical analysis of C, heat value, volatile, and ash contents. Air-dried coal pellets were pressed using
a hydraulic tablet machine at 25-ton pressure for 3 min. Each pellet contained ~ 3 g powder coal and formed in
dimensions of 30 mm diameter and 3 mm thickness after pressing. Two sets of samples were prepared under the
same conditions, each to be analyzed by a system.
Coal‑analysis systems. Femtosecond‑LA system (fs‑Solstice). A one-box ultrafast Ti:Sapphire amplifier
(SolsticeAce, Spectra Physics, USA) was targeted for a performance test as a coal analysis system (Fig. 13a).
Inside the amplifier box (with 125 × 68 × 29 cm dimensions) are four independent modules: regenerative am-
plifier, stretcher/compressor, seed laser, and pump laser. Two power supplies and chillers are connected to the
system for seed (Mai Tai) and pump (Empower) lasers operation. The system produces laser pulses centered
at 800 nm with linear polarization and it is user configurable to operate over: 2–7 mJ pulse energy, 35–120 fs
pulse width, and 4–1000 Hz repetition rate. The system employs adjustment-free EternAlign internal optical
mounts to maximize long-term stability and operation (Energy stability of < 0.5% rms over 24 h operation).
Scientific Reports | (2021) 11:15968 | https://doi.org/10.1038/s41598-021-95317-8 17
Vol.:(0123456789)You can also read