Technical note: Pyrolysis principles explain time-resolved organic aerosol release from biomass burning
←
→
Page content transcription
If your browser does not render page correctly, please read the page content below
Atmos. Chem. Phys., 21, 15605–15618, 2021
https://doi.org/10.5194/acp-21-15605-2021
© Author(s) 2021. This work is distributed under
the Creative Commons Attribution 4.0 License.

Technical note: Pyrolysis principles explain time-resolved organic
aerosol release from biomass burning
Mariam Fawaz1 , Anita Avery2 , Timothy B. Onasch2 , Leah R. Williams2 , and Tami C. Bond1,3
1 Department of Civil and Environmental Engineering, University of Illinois Urbana-Champaign, 205 N Mathews Ave.,
Urbana, IL 61801, USA
2 Aerodyne Research Inc., Billerica, MS 01821, USA
3 Department of Mechanical Engineering, Colorado State University, 400 Isotope Dr., Fort Collins, CO 80521, USA

Correspondence: Tami C. Bond (tami.bond@colostate.edu)

Received: 5 May 2021 – Discussion started: 28 May 2021
Revised: 10 September 2021 – Accepted: 20 September 2021 – Published: 19 October 2021

Abstract. Emission of organic aerosol (OA) from wood             1   Introduction
combustion is not well constrained; understanding the gov-
erning factors of OA emissions would aid in explaining the
reported variability. Pyrolysis of the wood during combus-       The emission of organic aerosol (OA) particles from open
tion is the process that produces and releases OA precursors.    biomass and biofuel burning contributes 93 % of the global
We performed controlled pyrolysis experiments at represen-       atmospheric primary organic aerosol emissions (POA), with
tative combustion conditions. The conditions changed were        19 % from biofuel burning for residential energy consump-
the temperature, wood length, wood moisture content, and         tion (Bond et al., 2004). OA emission factors from biofuel
wood type. The mass loss of the wood, the particle concen-       burning are used in emission inventories (Denier van der Gon
trations, and light-gas concentrations were measured con-        et al., 2015; Wu et al., 2019; Morino et al., 2018; Cao et al.,
tinuously. The experiments were repeatable as shown by a         2006), regional and global air quality models (Lane et al.,
single experiment, performed nine times, in which the real-      2007; Yu et al., 2004; Wang et al., 2018; Tsimpidi et al.,
time particle concentration varied by a maximum of 20 %.         2017; Theodoritsi and Pandis, 2019), and exposure studies
Higher temperatures increased the mass loss rate and the re-     for health impacts (Tuet et al., 2019; Hystad et al., 2019;
leased concentration of gases and particles. Large wood size     Carter et al., 2017; Okello et al., 2018).
had a lower yield of particles than the small size because of       Emission of OA from biomass is observed to be vari-
higher mass transfer resistance. Reactions outside the wood      able and chaotic, making the determination of definite emis-
became important between 500 and 600 ◦ C. Elevated mois-         sion factors difficult (Nielsen et al., 2017; Shrivastava et al.,
ture content reduced product formation because heat received     2006; Jolleys et al., 2014). To explain measurement variabil-
was shared between pyrolysis reactions and moisture evap-        ity, the emission behavior has been related to combustion pa-
oration. The thermophysical properties, especially the ther-     rameters. The most used parameters are heat flux (Haslett
mal diffusivity, of wood controlled the difference in the mass   et al., 2018; Eriksson et al., 2014); wood type (Weimer
loss rate and emission among seven wood types. This work         et al., 2008; McDonald et al., 2000), whether softwood
demonstrates that OA emission from wood pyrolysis is a de-       or hardwood (Schmidl et al., 2008; Iinuma et al., 2007);
terministic process that depends on transport phenomena.         moisture content (van Zyl et al., 2019); and combustion
                                                                 phase, whether flaming or smoldering (Yokelson et al., 1997;
                                                                 McKenzie et al., 1995; Amaral et al., 2014). The most preva-
                                                                 lent characterization factor in emission studies is the mod-
                                                                 ified combustion efficiency (MCE) (Ward and Hao, 1991);
                                                                 others, such as the fire radiative energy (FRE) (Freeborn
                                                                 et al., 2008; Ichoku and Kaufman, 2005) and inferred py-

Published by Copernicus Publications on behalf of the European Geosciences Union.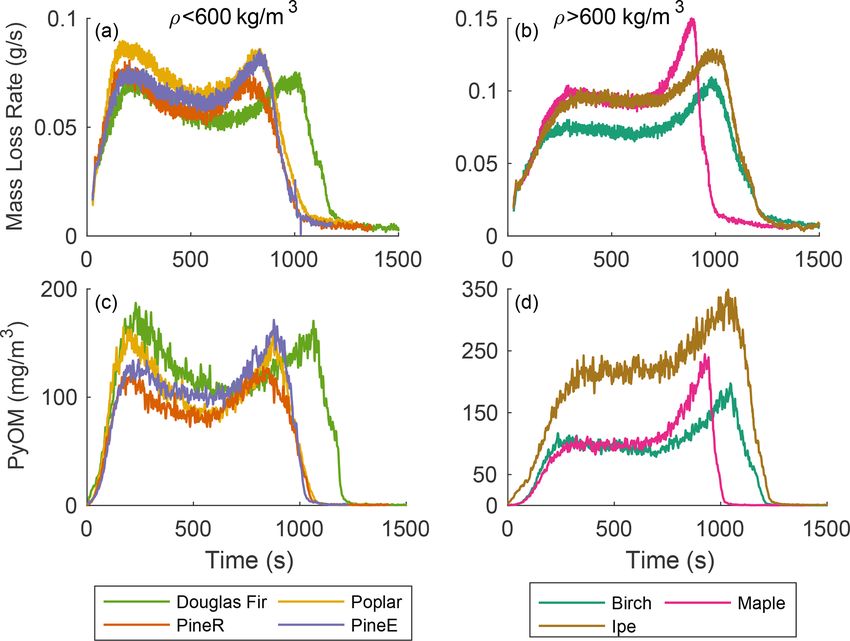
15606                                                        M. Fawaz et al.: Governing factors of organic aerosol emissions

rolysis temperature (Sekimoto et al., 2018), have also been        molecules and tar molecules using FTIR or GC–MS (Anca-
used. Previous emission studies have alluded to the role of        Couce et al., 2017; Corbetta et al., 2014; Dufour et al., 2007).
pyrolysis in the emission of organic aerosols (Yokelson et al.,    These studies can provide final yields for industrial appli-
1996; Sekimoto et al., 2018); however, there has not yet been      cations, product types, and kinetic parameters for modeling
a comprehensive attempt to understand how emission occurs          thermally-thick pyrolysis.
and how governing factors at the point of origin affect the           In thermally thick pyrolysis, heat transfer in and mass
types and amounts of particles and gases. We suggest that          transfer out of the wood matrix are important limiting fac-
the study should start at the source of emission.                  tors. This type of pyrolysis is less often explored because
   When wood is heated, the first response is thermal degra-       of its limited relevance to industrial processes, although de-
dation, known as pyrolysis. Pyrolysis reactions form prod-         composition rates of thermally thick wood have been exam-
ucts in the solid phase (char) (Shafizadeh, 1982), in the gas      ined, because they affect fire safety (Tran and White, 1992;
phase as permanent gases (e.g., CO, CO2 , and hydrocarbons)        Lee et al., 1977). Samples investigated are commonly 1–
and as condensable products (CPs) that have high molecu-           3 cm, with cylindrical and spherical shapes (Remacha et al.,
lar weight (Evans and Milne, 1987). The latter are known           2018; Bennadji et al., 2013; Di Blasi et al., 2001; Ding
as tar in pyrolysis literature, and these products overlap with    et al., 2018b; Gauthier et al., 2013). Differences in time-
condensed organic aerosol. Owing to the pressure gradient          dependent mass loss and in overall product yield occur over
between the formation site and the surface, both gas and           a range of wood sizes, shapes, and temperature or heat flux to
CPs (Diebold, 1994; Suuberg et al., 1996) can be ejected           which they are exposed. Throughout these works, larger sizes
from the wood (Staggs, 2003). Before release, CPs can be           and non-rounded shapes have not been investigated to ascer-
broken down to form gaseous material (Pattanotai et al.,           tain whether known pyrolysis principles are sufficient to ex-
2013) due to secondary pyrolysis reactions within the wood.        plain behavior in real-world applications. Furthermore, time-
After release and in the absence of oxidation reactions as-        dependent release occurs because of heat and mass transfer
sociated with combustion, the CPs may condense to become           rates within the wood matrix. A few of the studies referenced
particles (Zhang et al., 2013), or they may crack at high tem-     above reported time-resolved escape of light gases, but none
perature to form permanent gases (Boroson et al., 1989b;           have measured time-resolved emission of condensable prod-
Morf et al., 2002) due to secondary reactions outside the          ucts, so there is little evidence to indicate whether the prod-
wood. After ignition, gas-phase oxidation reactions can con-       uct division changes as the pyrolysis front penetrates into the
sume CPs to form permanent gases that will not condense at         wood. Any such shifts could affect both ignition timing and
any relevant temperature, such as CO and CO2 . CPs may also        emission characteristics.
polymerize at high temperatures to form soot (Atiku et al.,           The name pyrolytic organic matter (PyOM) is introduced
2017; Fitzpatrick et al., 2009). All of these processes reduce     here as the name of particles that are directly emitted from
the yield of OA. The exothermic reactions that occur outside       pyrolysis in the absence of oxidation reactions inside and
or at the surface of the wood, often called flaming and smol-      outside the wood. In literature, common names of organic
dering, provide energy for the pyrolysis of unreacted wood         aerosol particles from biomass burning include biomass
and production of OA precursors.                                   burning organic aerosol (BBOA), brown carbon (BrC), pri-
   Considering the processes that control emission can lead to     mary organic aerosol (POA), and secondary organic aerosol
a greater understanding of the connection between OA emis-         (SOA), but these products are not exactly like pyrolysis parti-
sion and the nature of the fuel and the combustion process. A      cles in their properties or emission behavior. BBOA contains
systematic sequence of investigation would evaluate several        oxidation products from combustion and atmospheric oxida-
processes: (a) the control of solid-phase processes, or pyroly-    tion reactions (Huffman et al., 2009). BrC is defined based on
sis, on the emission of CPs and gases and the potential of CPs     the optical properties of OA (Andreae and Gelencsér, 2006).
to become OA; (b) the alteration of OA emission caused by          POA and SOA from biomass burning come from all combus-
the gas-phase processes oxidation (including flaming), poly-       tion processes, fresh (May et al., 2013) or aged (Capes et al.,
merization, and secondary pyrolysis; and (c) the feedback en-      2008), and sampled at the source or in the atmosphere (Cu-
ergy the solid-phase processes receive from the heat release       bison et al., 2011).
from gas-phase oxidation reactions.                                   In this work we developed an approach that relates the
   Much of the work in pyrolysis literature aims to describe       emission measurements from wood pyrolysis with the pro-
industrial applications such as bio-oil production and en-         cesses responsible for the emissions in the wood. This ap-
ergy generation from biomass. “Thermally-thin” applica-            proach was accomplished by coupling our previously de-
tions employ pulverized wood for which heat transfer to            veloped pyrolysis model (Fawaz et al., 2020) with emission
the center occurs nearly instantly (Wagenaar et al., 1993;         measurements. The objective of the work presented here is to
Di Blasi and Branca, 2001; Janse et al., 2000). Product            determine the extent to which released PyOM is governed by
yield from thermally-thin wood is measured either as lumped        transport phenomena within the wood during pyrolysis. This
groups of tar, char, and gases (Di Blasi et al., 2001; Grønli      is achieved by selecting and varying the important factors
and Melaaen, 2000) or speciated measurements of gaseous            that influence heat, mass, and momentum transfer in pyrol-

Atmos. Chem. Phys., 21, 15605–15618, 2021                                          https://doi.org/10.5194/acp-21-15605-2021
M. Fawaz et al.: Governing factors of organic aerosol emissions                                                           15607

ysis: thermal boundary conditions, wood size, moisture con-           The number size distribution of particles was measured by
tent, and wood type. Chemical characterization of emitted          an engine exhaust particle sizer (TSI, EEPS 3090), the mass
PyOM was also made and will be discussed in future work.           was measured by a DustTrak aerosol monitor (TSI, Dust-
                                                                   Trak 8530), the concentrations of CO and CO2 gas were
                                                                   measured by a CO/CO2 analyzer (Horiba, AIA-220), and
2     Methods                                                      the total concentration of carbon content in gas-phase hy-
                                                                   drocarbons (HCs) was measured by a flame ionization ana-
This section describes the experiments performed to measure        lyzer (Horiba, FIA-236). The gas instruments were calibrated
the change in the mass of the wood and the release of gas and      every day with zero and span gas. The electrometers of the
particles during controlled pyrolysis. The details of the py-      EEPS were zeroed every day to check the stability of the in-
rolysis model used in the analysis of the experimental results     strument.
were published in Fawaz et al. (2020).
                                                                   2.2   Wood sample description
2.1    Sampling setup
                                                                   Wood samples of varying type, size, and moisture content
Figure 1 is a schematic of the experiment. The pyrolysis re-       were used. Seven types of wood were used: Douglas fir
actor was described in detail in previous work (Fawaz et al.,      (Pseudotsuga menziesii, ρ = 587 ± 10 kg m−3 ), two types
2020) and is briefly reviewed here. The reactor was made           of pine (Pinus radiata, termed pineR, ρ = 507 ± 4 kg m−3 ,
of a 2.6 kW cylindrical heater (height 20.3 cm and diame-          and Pinus echinata, termed pineE, ρ = 538 ± 11 kg m−3 ),
ter 15.2 cm) connected to a proportional–integral–derivative       ipe (Handroanthus, ρ = 937 ± 13 kg m−3 ), maple (Acer ni-
(PID) temperature controller. A thermocouple bonded to the         grum, ρ = 747 ± 17 kg m−3 ), birch (Betula papyrifera, ρ =
wall of the reactor at height 13.5 cm provided feedback to         686 ± 11 kg m−3 ), and poplar (Liriodendron tulipifera, ρ =
the controller, and a thermocouple at 6.7 cm monitored the         554 ± 20 kg m−3 ). The end grain and flat grain of each wood
temperature of the reactor. The top of the reactor was cov-        type are shown in Fig. S1 in the Supplement. The apparent
ered with a movable layer of fire bricks to prevent heat losses    density of each wood sample was calculated as the ratio of
during the experiment. Heat was delivered to the sides of the      the mass to the volume of the wood sample.
wood through radiative heat transfer from the walls of the            PineR, pineE, and Douglas fir are softwoods and ipe,
reactor. Nitrogen gas flowed through the reactor to maintain       maple, birch, and poplar are hardwoods. In lumber, the di-
oxygen-deficient conditions, and a precision scale (Sartorius      vision of softwood and hardwood can be based on botani-
ENTRIS 6202I) measured the wood mass change.                       cal or anatomical definitions. Botanically, hardwoods belong
   Smoke emitted from the reactor cooled during the primary        to the angiosperm family and softwoods to the gymnosperm
dilution stage in the fume hood and was pulled into a duct         family, and anatomically, hardwoods are more porous than
at a speed of 7 m s−1 . Gases were sampled directly from           softwoods (Bergman et al., 2010). Chemically, the differ-
the duct, and the particles were measured after undergoing         ence between softwood and hardwood is less clear (Di Blasi
a secondary dilution stage in a probe. The secondary dilu-         et al., 2001). The main structural groups of wood are cell
tion probe was 1 m in length and had two concentric tubes          wall material, extractives, and ash. Hemicellulose, cellulose,
(o.d. = 0.75 in., i.d. = 0.5 in.); the internal tube was made of   and lignin are the components of cell wall material; volatile
a porous metal with a 20 µm pore size. The sample flow en-         sugar and acids are the major components of extractives; and
tered the inner tube, and the dilution flow entered the outer      inorganic oxides make up ash (Reed, 2002).
tube. The flow of air from the outer tube to the inner tube           Two size dimensions of wood were used; 14 cm×3.8 cm×
formed a barrier to reduce the loss of particles to the walls of   2.9 cm are called in this work “large”, and 2.9 cm × 2.9 cm ×
the probe. Compressed HEPA and activated carbon filtered           2.9 cm are called “small”. The wood was cut longitudinally
air was provided to the dilution probe. The secondary di-          with the grain as shown in Fig. S2 in the Supplement. The
lution ratio was the ratio of the dilution flow of air to the      large wood size was the same order of magnitude as those
sample flow from the duct. Air and vacuum flows were mon-          used in wood cookstoves, and the small size was used to
itored by two low-pressure drop mass flow meters (Alicat,          evaluate the effect of the length of the wood on emission.
MW-100SPLM/175SPLM), and the sample flow was mea-                  Both wood sizes are considered thermally thick, a condition
sured directly using a bubble flow meter before and after each     in which a thermal gradient forms between the surface and
experiment. The secondary dilution ratio across experiments        the center when the wood is exposed to heat from its sur-
ranged between 150 and 200 (Table S1 in the Supplement).           roundings (Pyle and Zaror, 1984).
Particle sampling was done near ambient temperature during            Two wood moisture contents (MCs) were used for pineR:
the experiments. A dark, heavy, sticky, material was released      dry samples at 8 ± 1 % and wet wood at 25 ± 2 %. Dry wood
in some experiments, especially at lower temperatures. This        samples used were received as kiln dried wood, and the MC
material deposited on the cold surfaces of the reactor before      of the samples was between 7 %–9 %. The wood MC was
reaching the sampling system and could not be collected.           increased by soaking pineR wood samples for 24 h based on

https://doi.org/10.5194/acp-21-15605-2021                                        Atmos. Chem. Phys., 21, 15605–15618, 2021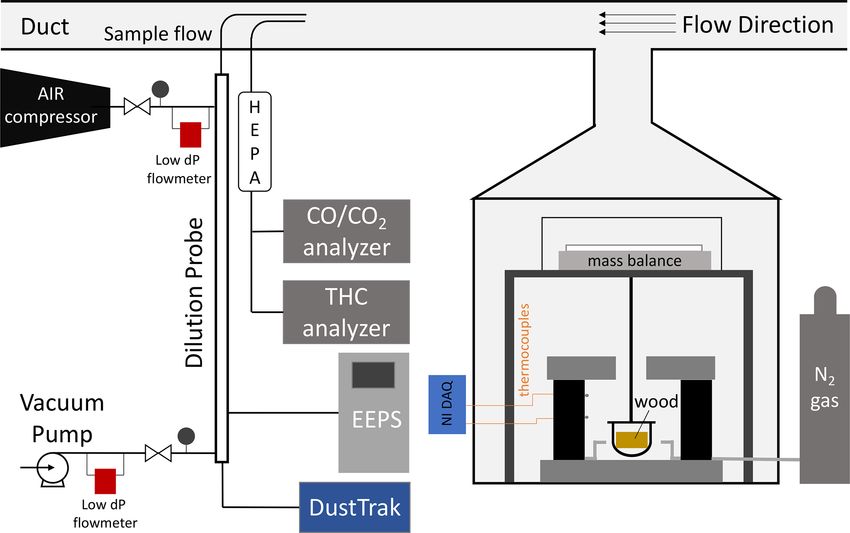
15608                                                            M. Fawaz et al.: Governing factors of organic aerosol emissions

Figure 1. Experimental setup of the pyrolysis reactor and the sampling gases and particles.

the method of Lee and Diehl (1981). The MC of the soaked                sample was inserted after the purge period, and this event
wood was measured in four internal positions to confirm the             marked the experiment start time.
permeation of water and a homogeneous distribution of water                After the wood sample was inserted, the reactor was kept
throughout the wood.                                                    partially covered with firebricks to prevent heat loss to the
                                                                        ambient atmosphere. The experiment ended when the resid-
2.3   Experimental design                                               ual mass of the solid stopped changing within the uncertainty
                                                                        limit of the mass balance and when the hydrocarbon gas con-
Two groups of experiments were performed. The first group               centration returned to background values measured before
varied pyrolysis conditions of reactor temperature, wood                the experiment. Each experiment was replicated to determine
moisture content, and wood size for two wood types: birch               the uncertainty.
and pineR. PineR is a low-density softwood and birch is a
high-density hardwood. These two woods were chosen to
                                                                        2.5    Analysis
evaluate whether the response to changing input conditions
depends on wood type. The second group of experiments ex-
plored how emissions from pyrolysis change based on the                 A LabVIEW program collected the thermocouple, mass bal-
type of the wood. Seven wood types, including birch and                 ance, gas analyzer, and flowmeter data. TSI software pack-
PineR, were used in constant temperature experiments at                 ages were used to collect data from the EEPS and DustTrak,
400, 500, and 600 ◦ C. This range was selected because at               and the data streams were synchronized with the signals col-
temperatures less than 400 ◦ C, pyrolysis was extremely slow            lected in LabVIEW.
and did not occur at certain conditions, and at temperatures               The background concentration of the gases in ambient air
higher than 600 ◦ C secondary reactions consumed OA pre-                was measured before and after the experiment and subtracted
cursors before formation. In combustion conditions, temper-             from the gas signal during the experiment. We assumed a lin-
atures higher than 600 ◦ C are associated with flaming com-             ear drift in the signal between initial and final measurements.
bustion. The conditions of all the experiments used in the              The real-time concentrations were smoothed using a MAT-
analysis are shown in Table S1.                                         LAB moving mean function with an averaging period of 3 s,
                                                                        unless otherwise stated. Product collection was calculated as
2.4   Reactor operation                                                 the total mass of all measured products divided by the ini-
                                                                        tial mass of the wood. The products measured include the
The experiments were performed under isothermal condi-                  final char mass and the total mass of PyOM, CO, CO2 , and
tions; the wall temperature of the reactor was maintained at a          HCs. The yield or mass fraction of each product is the sum
set point temperature of either 400, 500, or 600 ◦ C. To begin          of its real-time measured mass divided by the initial mass of
an experiment, the reactor was raised to the set point temper-          the wood. In the elevated MC experiments, calculated mass
ature, after which data collection was initiated, and nitrogen          fractions are provided on an as-received basis and wet basis,
gas purged the reactor for 2 min at 20 L min−1 . The wood               where the as-received mass of the wood was the mass be-

Atmos. Chem. Phys., 21, 15605–15618, 2021                                                 https://doi.org/10.5194/acp-21-15605-2021
M. Fawaz et al.: Governing factors of organic aerosol emissions 15609
fore water absorption and the wet mass was after absorption, pineR and birch wood at 400, 500, and 600 ◦ C. The time se-
respectively. ries all have two peaks, although some peaks are more pro-
The EEPS measured the number concentration of the par- nounced than others. At each fixed temperature, the mass loss
ticles from 6–560 nm. A density of 1.3 × 10³ kg m−3 was rate, PyOM, and gas concentrations exhibit similar behav-
used (Hennigan et al., 2011) to convert from number to mass ior with time but the relative heights of the two peaks differ
distribution. EEPS data were corrected for counting errors; among temperatures. Figures S22 and S23 in the Supplement
details of the correction are in Sect. S2 in the Supplement plot the mean and standard deviations of the experiments dis-
and summarized here. The EEPS underestimates the size of cussed in this section; they show that the observed trends are
large particles (Dp > 100 nm) (Zimmerman et al., 2014), so caused by the wood response to the boundary conditions and
the method of Lee et al. (2013) was used to correct size dis- are not experimental artifacts.
tributions by comparing measured concentrations for size- Using a pyrolysis model verified experimentally, Fawaz
selected ammonium nitrate particles between the EEPS and et al. (2020) showed that the real-time mass loss rate from
a long time-of-flight aerosol mass spectrometer (LToF-AMS, thermally thick wood could be predicted and that inter-
Aerodyne Research, Inc.). nal and external heat transfer govern the thermochemical
Pyrolysis experiments at 400 ◦ C released particles with di- degradation that produces the gases and PyOM precursors.
ameters larger than the upper limit of the EEPS measurement That work, and other pyrolysis literature of thermally thick
range, causing an underestimation in the mass concentration. wood (Di Blasi et al., 2000; Ding et al., 2018a), shows that
When the particle sizes exceeded the size range measured by the two distinct peaks of mass loss rate that appear in Fig. 2a–
the EEPS, the mass concentration measured by the DustTrak c can be explained by the reactor temperature and thermal
was used for the total mass of the particles. In Sect. S3 in diffusivity of a given wood type at a fixed size. Modeling re-
the Supplement, we compare the PyOM concentrations from sults of the mass loss rate of birch and pineR at 400, 500, and
the EEPS and DustTrak measurements at 400 and 500 ◦ C to 600 ◦ C are shown in Sect. S4.3 in the Supplement. The model
evaluate the differences between the two instrument outputs also shows that the heating rate at the surface ranged between
and the adequacy of using the DustTrak data at 400 ◦ C. 4–10 ◦ C s−1 for birch wood and 0–1 ◦ C s−1 for the wood cen-
The measured particle concentration was multiplied by the ter, among the three reactor temperatures (Figs. S31–S36 in
dilution ratio of the secondary dilution stage during the ex- the Supplement).
periment. Thus, the PyOM mass concentrations reported here The heat the wood receives at the surface initiates reac-
are those that would be measured in the primary dilution tions and is conducted towards the center of the wood. The
stage, so they are directly comparable to the gas concentra- surface layers of the wood gain temperature rapidly, reacting
tions. and losing mass to form the first peak in emissions. When
these layers are depleted the declining portion of the first
peak forms. Each location inside the wood receives heat con-
3 Results and discussion ducted from the surface and transfers heat toward the wood
center. As pyrolysis progresses, the outer layers of the wood
Table 1 shows the yields of all measured products for the two become char, which has a lower thermal conductivity than
groups of the pyrolysis experiments. The yields of PyOM wood. This thermal resistance barrier slows the travel of the
show that 10 %–30 % of the initial wood mass was emitted as elevated temperature zone, creating the portion of the mass-
particles, depending on the conditions of the experiment. One loss curve that appears as a saddle at 500 and 600 ◦ C. The
test (large birch at 500 ◦ C) was repeated nine times, and the rate of mass loss declines when most of the material has re-
average coefficient of variation of the real-time mass concen- acted in the heated section, and when unreacted wood is not
tration of PyOM was 15 ± 3 % (Fig. S21 in the Supplement), heated rapidly enough to maintain the same level of prod-
indicating that the tests were repeatable. Collected product uct formation. This principle explains the sharp second peak,
percentages, excluding water, of all experiments were be- which occurs when the thermal wave reaches the center. The
tween 77 % and 90 % of the wood mass. The lower end of earlier peak times and shorter overall pyrolysis duration of
the mass closure was observed at 400 ◦ C because of the loss pineR compared to birch at all temperatures is due to the
of dark heavy sticky material onto the reactor. The assump- lower density and greater thermal diffusivity of pineR com-
tion of the PyOM density did not have a quantified effect on pared to birch. The higher the thermal diffusivity, the faster
the PyOM yield and mass closure. The real-time modified the heat transfer rate from the surface to the center, mak-
combustion efficiency of birch experiments at the three tem- ing pyrolysis reactions in pineR faster than birch. Birch has
peratures is shown in Fig. S24 in the Supplement. a larger overall mass loss; the higher density of birch com-
pared to pineR means there is more mass to react and form
3.1 Effect of temperature products. Mass loss as a function of time and temperature is
repeatable (Fig. S21), because it is governed by the relative
Figure 2 shows the real-time mass loss rate and mass concen- rates of heat transfer, temperature increase, and char forma-
tration of emitted gases and PyOM during pyrolysis of large tion within the wood.
https://doi.org/10.5194/acp-21-15605-2021 Atmos. Chem. Phys., 21, 15605–15618, 202115610 M. Fawaz et al.: Governing factors of organic aerosol emissions
Table 1. Average yields of measured products for each replicated experimental condition. Wet pineR yields are expressed on a wet basis (the
mass of the wood used included the moisture content) and on an as-received basis (the mass of the wood before increasing its moisture). The
last column is a semi-quantitative indicator of whether the production of the dark sticky material was detected during the experiment. In the
table “–” indicates the lack of production and “+” indicates production, with “++” signifying more production than +. “N/A” indicates that a
detection was not possible during those experiments.
Sample Temp Char PyOM CO CO2 HC Sticky dark
material
Birch 400 ◦ C 0.33 ± 0.0059 0.21 ± 0.0086 0.039 ± 0.0015 0.1 ± 0.013 0.031 ± 0.00033 ++
500 ◦ C 0.22 ± 0.0061 0.23 ± 0.0002 0.096 ± 0.0047 0.26 ± 0.016 0.033 ± 0.0061 +
600 ◦ C 0.2 ± 0.0053 0.1 ± 0.0064 0.24 ± 0.0024 0.25 ± 0.037 0.044 ± 0.014 –
PineR 400 ◦ C 0.37 ± 0.028 0.27 ± 0.0037 0.056 ± 0.0062 0.095 ± 0.017 0.029 ± 0.003 ++
500 ◦ C 0.27 ± 0.0078 0.27 ± 0.0072 0.095 ± 0.0054 0.19 ± 0.023 0.037 ± 0.00046 +
600 ◦ C 0.23 ± 0.027 0.11 ± 0.0012 0.23 ± 0.0082 0.22 ± 0.0082 0.044 ± 0.0008 –
Small birch 400 ◦ C 0.31 ± 0.013 0.3 ± 0.011 0.078 ± 0.018 0.31 ± 0.064 0.028 ± 0.0012 N/A
500 ◦ C 0.23 ± 0.001 0.25 ± 0.0033 0.094 ± 0.0055 0.45 ± 0.054 0.027 ± 0.0006 N/A
600 ◦ C 0.22 ± 0.008 0.095 ± 0.0019 0.25 ± 0.0075 0.36 ± 0.061 0.032 ± 0.00013 N/A
Small PineR 400 ◦ C 0.33 ± 0.019 0.31 ± 0.0032 0.076 ± 0.012 0.32 ± 0.041 0.022 ± 0.0013 N/A
500 ◦ C 0.27 ± 0.0038 0.26 ± 0.0068 0.12 ± 0.0071 0.44 ± 0.025 0.024 ± 2 × 10⁻⁵ N/A
600 ◦ C 0.25 ± 0.01 0.12 ± 0.0041 0.21 ± 0.0038 0.44 ± 0.0066 0.028 ± 0.0015 N/A
Wet PineR 400 ◦ C 0.5 ± 0.025 0.21 ± 0.0073 0.053 ± 0.0071 0.071 ± 0.0047 0.019 ± 0.0011 ++
(received basis) 500 ◦ C 0.28 ± 0.008 0.22 ± 0.0027 0.099 ± 0.0072 0.19 ± 0.032 0.031 ± 0.0019 +
600 ◦ C 0.33 ± 0.0053 0.1 ± 0.0039 0.22 ± 0.0069 0.26 ± 0.013 0.035 ± 0.001 –
Wet PineR 400 ◦ C 0.37 ± 0.024 0.16 ± 0.0033 0.039 ± 0.0047 0.053 ± 0.0042 0.014 ± 0.00067 ++
(wet basis) 500 ◦ C 0.2 ± 0.0028 0.17 ± 0.0045 0.073 ± 0.0064 0.14 ± 0.026 0.023 ± 0.0017 +
600 ◦ C 0.25 ± 0.0074 0.075 ± 0.0039 0.16 ± 0.0074 0.19 ± 0.012 0.026 ± 0.0004 –
PineE 400 ◦ C 0.38 ± 0.0028 0.23 ± 0.012 0.047 ± 0.0005 0.16 ± 0.026 0.022 ± 0.0005 ++
500 ◦ C 0.25 ± 0.002 0.29 ± 0.0024 0.079 ± 0.0022 0.22 ± 0.018 0.029 ± 0.0002 +
600 ◦ C 0.23 ± 0.01 0.11 ± 0.0049 0.23 ± 0.017 0.26 ± 0.035 0.043 ± 0.0008 –
Poplar 400 ◦ C 0.33 ± 0.0048 0.2 ± 0.0018 0.051 ± 0.0028 0.096 ± 0.0021 0.027 ± 0.00018 ++
500 ◦ C 0.24 ± 0.0028 0.26 ± 0.021 0.092 ± 0.0033 0.23 ± 0.022 0.034 ± 0.0008 +
600 ◦ C 0.22 ± 0.011 0.13 ± 0.0055 0.24 ± 0.0013 0.25 ± 0.023 0.049 ± 0.00033 –
Douglas fir 400 ◦ C 0.4 ± 0.022 0.23 ± 0.032 0.038 ± 0.0084 0.055 ± 0.021 0.021 ± 0.002 ++
500 ◦ C 0.29 ± 0.021 0.38 ± 0.018 0.074 ± 0.0046 0.2 ± 0.021 0.027 ± 0.0029 +
600 ◦ C 0.24 ± 0.0054 0.12 ± 0.014 0.24 ± 0.021 0.22 ± 0.012 0.038 ± 0.002 –
Ipe 400 ◦ C 0.39 ± 0.0021 0.2 ± 0.0027 0.044 ± 0.0063 0.091 ± 0.0004 0.029 ± 0.0014 ++
500 ◦ C 0.28 ± 0.0051 0.35 ± 0.021 0.081 ± 0.011 0.16 ± 0.012 0.036 ± 0.0013 +
600 ◦ C 0.24 ± 0.019 0.2 ± 0.03 0.22 ± 0.0071 0.18 ± 0.023 0.053 ± 0.0039 –
Maple 400 ◦ C 0.3 ± 0.0093 0.17 ± 0.0021 0.041 ± 0.002 0.081 ± 0.0027 0.031 ± 0.0011 ++
500 ◦ C 0.25 ± 0.007 0.23 ± 0.049 0.094 ± 0.023 0.19 ± 0.077 0.036 ± 0.0002 +
600 ◦ C 0.23 ± 0.0015 0.12 ± 0.0081 0.22 ± 0.007 0.21 ± 0.018 0.051 ± 2 × 10⁻⁵ –
At all temperatures, the real-time mass concentration of process is similar. Concentrations of CO and CO2 at 400 ◦ C
PyOM (Fig. 2d–f) had similar real-time features to the mass are noisy because they are near the instrumental detection
loss rate. The concentrations of CO, CO2 , and HC (Fig. 2g– limit.
o) are also similar in behavior. For example, the slope of Emissions of gases and PyOM increase as a function of
the first peak increases with temperature for all measured increasing temperature, except for PyOM at 600 ◦ C (Fig. 2f)
products. Relative peak heights and the nature of the sad- for which the PyOM was lower than at 400 and 500 ◦ C. At
dle between peaks changed with wood size and temperature and above this temperature, secondary pyrolysis reactions
in nearly the same way for mass loss rate, PyOM, and gases. (known as tar cracking reactions in pyrolysis literature) break
The relative magnitude of PyOM and gases is relatively con- down CPs and transform them to CO and CO2 (Morf et al.,
stant, regardless of the wood type and temperature, suggest- 2002) and increase CO yields compared to CO2 and other
ing that the product emission throughout the entire pyrolysis gases (Nunn et al., 1985). These reactions are likely the cause
Atmos. Chem. Phys., 21, 15605–15618, 2021 https://doi.org/10.5194/acp-21-15605-2021M. Fawaz et al.: Governing factors of organic aerosol emissions 15611
Figure 2. The mass loss rate and real-time concentration of particles and gases for birch and pineR at three reactor temperatures. Note the
significant changes in the scales from plot to plot. Fluctuations in the CO2 signals are due to noise near the detection limit.
of the reduced PyOM yield at 600 ◦ C and the more than dou- ence between the production site and the surface. If the pre-
bling in CO concentration from 500 to 600 ◦ C. At temper- cursors are not able to exit the wood freely, large and small
atures lower than 600 ◦ C, the collected PyOM yield is the wood might have different yields.
maximum particle yield from pyrolysis. At 400 ◦ C, transport resistance inside the wood appears
to reduce PyOM emission from larger wood, as the yield of
3.2 Wood size PyOM for small birch and small pineR was higher than that
for large wood (40 % difference for birch and 15 % difference
At smaller wood sizes, heat transfer into the center takes less for pineR). Yields of PyOM are shown in Table 1 and sum-
time, and pyrolysis and product release are completed more marized graphically in Figs. S39 and S40 in the Supplement.
rapidly (Figs. S37 and S38 in the Supplement). If no reac- These differences are not attributable to reactions outside the
tions occur after pyrolysis, equivalent product yields would wood, where the residence time at elevated temperature was
be expected from small and large wood. Transport through kept constant. Neither are they likely to be caused by prod-
the porous char matrix after pyrolysis depends on the per- uct degradation within the wood (Boroson et al., 1989a, b).
meability of the material, the travel distance between the gas The influence of wood size in birch, along with a higher den-
production site and the surface, as well as the pressure differ-
https://doi.org/10.5194/acp-21-15605-2021 Atmos. Chem. Phys., 21, 15605–15618, 202115612 M. Fawaz et al.: Governing factors of organic aerosol emissions
sity that is associated with lower total porosity (Plötze and et al., 2014). Wood moisture has competing effects on emis-
Niemz, 2011), caused a greater inhibition of mass release sion. Wet wood has a higher ignition delay and a higher crit-
compared to pineR. ical heat flux for ignition (Simms and Law, 1967), prolong-
Increased temperature generates gases more quickly, cre- ing pyrolysis and CP emission that occur in the absence of
ating a greater pressure gradient and reducing the likelihood oxidation processes. As shown here, the rate of condensable
of mass transfer resistance. At 500 ◦ C, there was no dif- product formation itself may be diminished, and that could
ference in PyOM yields between large and small wood for reduce the rate of oxidation reactions after ignition (Price-
pineR. However, at 500 ◦ C, mass transfer resistance still re- Allison et al., 2019).
duced the PyOM yield between large and small wood for the
higher-density birch. There was no difference in yield be- 3.4 Wood type
tween wood sizes for either type at 600 ◦ C.
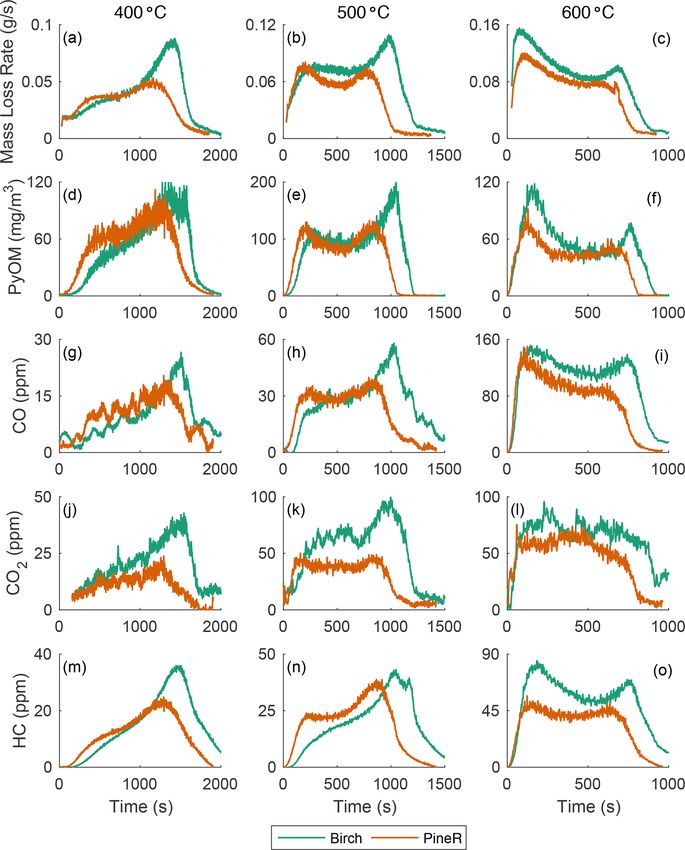
Seven types of wood were used in pyrolysis experiments at
3.3 Moisture content each reactor temperature. Thermal properties of dry wood
depend on density (MacLean, 1941), so we present results
When free water evaporates from the wood matrix, less en- grouped by density, although there may be other causes of
ergy is available for thermochemical degradation and prod- differences. Figure 4a and c show mass loss rate and the real-
uct release (Fatehi and Bai, 2014), and the rates of these time mass concentration of PyOM from woods with densities
processes are reduced. Figure 3 shows that the mass loss below 600 kg m−3 , and Fig. 4b and d show the same quanti-
rate and real-time mass concentration of PyOM for pineR ties for woods with densities above 600 kg m−3 . The reac-
at MC = 8 % (dry) and at MC = 25 % (wet) have some simi- tor temperature 500 ◦ C is shown because it is least sensitive
lar features, such as the dual peaks and change in mass loss to mass transfer resistance (low-temperature effect) and sec-
rate magnitude with reactor temperature. Many of the differ- ondary reactions (high-temperature effect), as discussed pre-
ences, including the time required to complete the reaction, viously. For each wood, regardless of density, its real-time
can be explained by the energy consumed by evaporation. PyOM mass concentration and mass loss rate share the same
Compared with dry wood, initial mass loss from wet wood features in terms of pyrolysis duration, peak shape, and rela-
was equal or faster due to rapid evaporation of water at tive peak heights.
the surface. Evaporation occurs at 100 ◦ C and pyrolysis re- Low-density wood types include softwoods (pineE, pineR,
action rates become significant at temperatures higher than and Douglas fir) and one hardwood (poplar). These wood
280 ◦ C (Broido, 1976). The first peak results from the bal- types had similar behavior, except for Douglas fir with a 20 %
ance between radiative heat flux at the surface and the for- longer pyrolysis duration. The peak heights in the mass loss
mation of char and is most affected by the change in relative rate and real-time mass concentration are within 25 % of each
rates. At 400 and 500 ◦ C, heat transfer into the wood is slow other, showing that for this group the pyrolysis behavior is
enough that evaporation at 100 ◦ C occurs before pyrolysis re- similar.
actions at the surface, and the first peak of PyOM emission The high-density wood types include birch, maple, and
is reduced to a broad shoulder appeared instead. At 600 ◦ C, ipe, all hardwoods. The mass loss rate of the wood types
heat transfer is rapid, and both pyrolysis and evaporation oc- in this group had different pyrolysis durations and ratios be-
cur simultaneously at the surface. After the initial peak, con- tween the first and second peak compared to the low-density
tinuous internal heat transfer in the wood sustains pyrolysis wood, with a shorter first peak and a larger second peak at the
and product formation, and there is little difference between end. The higher second peak, a repeatable feature for high-
the second peak height in the dry and wet cases. density wood, is caused by the availability of more unreacted
The sharing of energy between water evaporation and py- wood mass internally than in low-density wood. Ipe emit-
rolysis shifts product yields towards char (Beaumont and ted more particles than birch and maple and had a higher
Schwob, 1984; Peters and Bruch, 2003; Di Blasi et al., 2000) yield even though the magnitude of the mass loss rates were
and reduces the reaction temperature. The effect of reaction comparable among the three wood types. This work’s ther-
temperature on yield reduction is evident in the change in mochemical approach does not offer the reason behind the
yield between 400 and 500 ◦ C where more char, less gases, high particle emission for ipe compared to other woods and
and less PyOM were produced at the lower temperature. Fur- remains an open question.
ther, the yield of PyOM from pyrolysis of wet pineR on an In pyrolysis studies, wood type effect has been dis-
as-received basis was lower than that of pineR at MC = 8 % tinguished in thermally thin wood based on the frac-
at the same reactor temperature (Table 1). tions of cellulose, hemicellulose, and lignin (Grønli et al.,
Published findings show conflicting effects of moisture 2002). Di Blasi et al. (2001) found that the mass loss rate be-
content on particle emission yields. Some observe that higher havior for thermally thick wood can be related to the chem-
moisture content increases OA emission (May et al., 2014; ical makeup at low heat flux, and at higher heat fluxes the
van Zyl et al., 2019; Magnone et al., 2016), while others find mass loss rate was explained by transport phenomena. When
a reduction in OA emission with moisture content (Huangfu heat transfer controls pyrolysis and burning, the difference
Atmos. Chem. Phys., 21, 15605–15618, 2021 https://doi.org/10.5194/acp-21-15605-2021M. Fawaz et al.: Governing factors of organic aerosol emissions 15613 Figure 3. (a–c) Comparison between real-time mass loss rates and (d–f) mass concentration of PyOM at low and high MCs for PineR wood samples. Figure 4. (a, c) Mass loss rate and real-time mass concentration of PyOM for low-density wood (ρ < 600 kg m−3 ) and (b, d) high-density wood (ρ > 600 kg m−3 ) at a reactor temperature of 500 ◦ C. in the mass loss rate of the wood can be explained using the the wood. Section S4.3 shows that the mass loss rate of birch thermal diffusivity of the wood (Spearpoint and Quintiere, and pineR can be predicted by the same global kinetics using 2001). As demonstrated in this work and modeled (Fawaz Gpyro (Lautenberger and Fernandez-Pello, 2009). No stud- et al., 2020), the mass loss rate change as a function of wood ies have investigated the role of the chemical makeup of the type and heat flux can be explained by the heat transfer in wood in the pyrolysis of thermally thick wood. The differ- https://doi.org/10.5194/acp-21-15605-2021 Atmos. Chem. Phys., 21, 15605–15618, 2021
15614                                                           M. Fawaz et al.: Governing factors of organic aerosol emissions

ence in real-time emissions among each group of wood (low-               We have demonstrated that the first step in biomass emis-
and high-density wood groups) can be attributed to the dif-           sion – release of particles and gases from pyrolysis – is pre-
ferences in wood composition.                                         dictable and repeatable. The principles demonstrated here
   Measurements of emission factors to represent open                 have not previously been exploited to guide understanding of
biomass burning have often been reported for individual               biomass burning emissions to the atmosphere. Quantifying
wood types (Stockwell et al., 2014; Chen et al., 2007). Tabu-         relevant physical factors, such as temperature, wood size, and
lations for use in atmospheric models have been grouped by            thermal diffusivity of the wood matrix, would likely reduce
ecosystem type (Akagi et al., 2011; Andreae, 2019), some-             the unexplained variation in reported biomass emission rates.
times separating by flaming and smoldering (Koppmann                  A more predictive understanding would require investigation
et al., 2005). Measurements of wood burning in fireplaces             of the remaining steps in the process, including gas-phase
and domestic stoves have provided in-depth chemical com-              oxidation and feedback from exothermic gas-phase reactions
position of gas and particulate emission for different wood           to the solid phase.
species (McDonald et al., 2000; Schauer et al., 2001; Vi-
cente and Alves, 2018). However, these studies could not
attribute variations of measured emission yields to wood              Data availability. The       data    presented      in this
type (Gonçalves et al., 2011; Ozgen et al., 2014). Temper-            manuscript can be found in “Manuscript Figure Data”,
atures and heating rates in these studies were not reported.          https://doi.org/10.5281/zenodo.5562674 (Fawaz, 2021).
   We have shown that differences in yields of particles and
gases could be explained by reactor temperature, moisture
content, and wood size, and the difference in real-time emis-         Supplement. The supplement related to this article is available on-
                                                                      line at: https://doi.org/10.5194/acp-21-15605-2021-supplement.
sion among wood types can be explained by the difference in
the physical properties of the wood. Varying PyOM and gas
emissions from different vegetation types, as widely reported
                                                                      Author contributions. MF developed the methodology, collected
in literature, are likely attributable to these factors rather than   the data, and performed the formal analysis. AA collected the AMS
to differences among wood species.                                    data. MF and TCB wrote the original draft. All authors reviewed the
                                                                      draft.

4   Conclusions                                                       Competing interests. The contact author has declared that neither
                                                                      they nor their co-authors have any competing interests.
The results of the developed approach reported here show
that time-dependent emission of particles and gases from py-
rolysis is a repeatable and deterministic process. Coupled            Disclaimer. Publisher’s note: Copernicus Publications remains
with model findings, we found that the real-time mass loss            neutral with regard to jurisdictional claims in published maps and
rate can be explained by heat and mass transfer processes,            institutional affiliations.
and in turn, real-time emission of particles and gases follows
the mass loss rate.
   The conditions of pyrolysis influence the product yield            Acknowledgement. The authors would like to thank Indoor Climate
and the real-time concentrations. We reported here the effect         Research and Training for hosting the experiments.
of the heating conditions, wood size, moisture content, and
wood type on product emission. Comparative yields of par-
                                                                      Financial support. This research has been supported by the Di-
ticles and gases can be explained by thermochemical prin-
                                                                      vision of Atmospheric and Geospace Sciences (grant no. AGS-
ciples that are well known in pyrolysis literature. Increas-          1742956).
ing temperatures increase mass loss rates and increase the
concentration of emitted particles between 400 and 500 ◦ C.
At 600 ◦ C the particle concentration decreased, likely due           Review statement. This paper was edited by James Allan and re-
to gas-phase secondary reactions outside the wood. Increas-           viewed by András Gelencsér and one anonymous referee.
ing wood size decreased the yield of particles at the low-
est temperature due to mass transfer resistance. Increasing
moisture content reduced the yield and real-time concentra-
tion of particles and gases when drying reactions consumed            References
some of the energy that the wood received for pyrolysis. The
mass loss rate of different wood types showed differences be-         Akagi, S. K., Yokelson, R. J., Wiedinmyer, C., Alvarado, M. J.,
tween low-density (ρ < 600 kg m−3 ) and high-density wood               Reid, J. S., Karl, T., Crounse, J. D., and Wennberg, P. O.: Emis-
(ρ > 600 kg m−3 ).                                                      sion factors for open and domestic biomass burning for use

Atmos. Chem. Phys., 21, 15605–15618, 2021                                              https://doi.org/10.5194/acp-21-15605-2021
M. Fawaz et al.: Governing factors of organic aerosol emissions 15615 in atmospheric models, Atmos. Chem. Phys., 11, 4039–4072, Capes, G., Johnson, B., McFiggans, G., Williams, P. I., Hay- https://doi.org/10.5194/acp-11-4039-2011, 2011. wood, J., and Coe, H.: Aging of biomass burning aerosols over Amaral, S. S., De Carvalho Jr., J. A., Costa, M. A. M., West Africa: Aircraft measurements of chemical composition, Neto, T. G. S., Dellani, R., and Leite, L. H. S.: Compara- microphysical properties, and emission ratios, J. Geophys. Res.- tive study for hardwood and softwood forest biomass: Chem- Atmos., 113, D00C15, https://doi.org/10.1029/2008JD009845, ical characterization, combustion phases and gas and par- 2008. ticulate matter emissions, Bioresource Technol., 164, 55–63, Carter, E., Norris, C., Dionisio, K. L., Balakrishnan, K., Check- https://doi.org/10.1016/j.biortech.2014.04.060, 2014. ley, W., Clark, M. L., Ghosh, S., Jack, D. W., Kinney, P. L., Anca-Couce, A., Sommersacher, P., and Scharler, R.: Online exper- Marshall, J. D., Naeher, L. P., Peel, J. L., Sambandam, S., iments and modelling with a detailed reaction scheme of single Schauer, J. J., Smith, K. R., Wylie, B. J., and Baumgartner, J.: particle biomass pyrolysis, J. Anal. Appl. Pyrol., 127, 411–425, Assessing exposure to household air pollution: A systematic re- 2017. view and pooled analysis of carbon monoxide as a surrogate mea- Andreae, M. O.: Emission of trace gases and aerosols from biomass sure of particulate matter, Environ. Health Persp., 125, 076002, burning – an updated assessment, Atmos. Chem. Phys., 19, https://doi.org/10.1289/EHP767, 2017. 8523–8546, https://doi.org/10.5194/acp-19-8523-2019, 2019. Chen, L.-W. A., Moosmüller, H., Arnott, W. P., Chow, J. C., Wat- Andreae, M. O. and Gelencsér, A.: Black carbon or brown car- son, J. G., Susott, R. A., Babbitt, R. E., Wold, C. E., Lin- bon? The nature of light-absorbing carbonaceous aerosols, At- coln, E. N., and Hao, W. M.: Emissions from laboratory com- mos. Chem. Phys., 6, 3131–3148, https://doi.org/10.5194/acp-6- bustion of wildland fuels: Emission factors and source profiles, 3131-2006, 2006. Environ. Sci. Technol., 41, 4317–4325, 2007. Atiku, F. A., Lea-Langton, A. R., Bartle, K. D., Jones, J. M., Corbetta, M., Frassoldati, A., Bennadji, H., Smith, K., Ser- Williams, A., Burns, I., and Humphries, G.: Some As- apiglia, M. J., Gauthier, G., Melkior, T., Ranzi, E., and pects of the Mechanism of Formation of Smoke from Fisher, E. M.: Pyrolysis of centimeter-scale woody biomass parti- the Combustion of Wood, Energ. Fuel., 31, 1935–1944, cles: kinetic modeling and experimental validation, Energ. Fuel., https://doi.org/10.1021/acs.energyfuels.6b02639, 2017. 28, 3884–3898, 2014. Beaumont, O. and Schwob, Y.: Influence of physical and chemical Cubison, M. J., Ortega, A. M., Hayes, P. L., Farmer, D. K., parameters on wood pyrolysis, Ind. Eng. Chem. Proc. DD., 23, Day, D., Lechner, M. J., Brune, W. H., Apel, E., Diskin, G. S., 637–641, https://doi.org/10.1021/i200027a002, 1984. Fisher, J. A., Fuelberg, H. E., Hecobian, A., Knapp, D. J., Bennadji, H., Smith, K., Shabangu, S., and Fisher, E. M.: Low- Mikoviny, T., Riemer, D., Sachse, G. W., Sessions, W., We- temperature pyrolysis of woody biomass in the thermally thick ber, R. J., Weinheimer, A. J., Wisthaler, A., and Jimenez, J. L.: regime, Energ. Fuel., 27, 1453–1459, 2013. Effects of aging on organic aerosol from open biomass burn- Bergman, R., Cai, Z., Carll, C. G., Clausen, C. A., Dieten- ing smoke in aircraft and laboratory studies, Atmos. Chem. berger, M. A., Falk, R. H., Frihart, C. R., Glass, S. V., Phys., 11, 12049–12064, https://doi.org/10.5194/acp-11-12049- Hunt, C. G., Ibach, R. E., Kretschmann, D. E., Rammer, D. R., 2011, 2011. and Ross, R. J.: Wood Handbook, Wood as an Engineering Denier van der Gon, H. A. C., Bergström, R., Fountoukis, C., Material, Forest Products Laboratory, Department of Agricul- Johansson, C., Pandis, S. N., Simpson, D., and Viss- ture, Madison, available at: https://www.fpl.fs.fed.us/products/ chedijk, A. J. H.: Particulate emissions from residential wood publications/several_pubs.php?grouping_id=100&header_id=p combustion in Europe – revised estimates and an evaluation, At- (last access: 27 April 2020), 2010. mos. Chem. Phys., 15, 6503–6519, https://doi.org/10.5194/acp- Bond, T., Streets, D., Yarber, K., Nelson, S., Woo, J.-H., and 15-6503-2015, 2015. Klimont, Z.: A technology-based global inventory of black and Di Blasi, C. and Branca, C.: Kinetics of primary product forma- organic carbon emissions from combustion, J. Geophys. Res.- tion from wood pyrolysis, Ind. Eng. Chem. Res., 40, 5547–5556, Atmos., 109, D14203, https://doi.org/10.1029/2003JD003697, 2001. 2004. Di Blasi, C., Hernandez, E. G., and Santoro, A.: Radiative Pyrolysis Boroson, M. L., Howard, J. B., Longwell, J. P., and Pe- of Single Moist Wood Particles, Ind. Eng. Chem. Res., 39, 873– ters, W. A.: Heterogeneous cracking of wood pyrolysis tars 882, https://doi.org/10.1021/ie990720i, 2000. over fresh wood char surfaces, Energ. Fuel., 3, 735–740, Di Blasi, C., Branca, C., Santoro, A., and Hernandez, E.: Pyrolytic https://doi.org/10.1021/ef00018a014, 1989a. behavior and products of some wood varieties, Combust. Flame, Boroson, M. L., Howard, J. B., Longwell, J. P., and Pe- 124, 165–177, https://doi.org/10.1016/S0010-2180(00)00191-7, ters, W. A.: Product yields and kinetics from the vapor phase 2001. cracking of wood pyrolysis tars, AICHE J., 35, 120–128, Diebold, J. P.: A unified, global model for the pyrolysis of cellu- https://doi.org/10.1002/aic.690350113, 1989b. lose, Biomass Bioenerg., 7, 75–85, https://doi.org/10.1016/0961- Broido, A.: Kinetics of solid-phase cellulose pyrolysis, in: Sym- 9534(94)00039-V, 1994. posium on Thermal Uses and Properties of Carbohydrates and Ding, Y., Zhou, R., Wang, C., Lu, K., and Lu, S.: Modeling Lignins, San Francisco, Calif., USA, 1976, 172nd National and analysis of bench-scale pyrolysis of lignocellulosic biomass Meeting of the American Chemical Society, Academic Press, based on merge thickness, Bioresource Technol., 268, 77–80, 1976. https://doi.org/10.1016/J.BIORTECH.2018.07.134, 2018a. Cao, G., Zhang, X., and Zheng, F.: Inventory of black carbon and or- Ding, Y., Zhou, R., Wang, C., Lu, K., and Lu, S.: Modeling and anal- ganic carbon emissions from China, Atmos. Environ., 40, 6516– ysis of bench-scale pyrolysis of lignocellulosic biomass based on 6527, https://doi.org/10.1016/j.atmosenv.2006.05.070, 2006. merge thickness, Bioresource Technol., 268, 77–80, 2018b. https://doi.org/10.5194/acp-21-15605-2021 Atmos. Chem. Phys., 21, 15605–15618, 2021
15616                                                              M. Fawaz et al.: Governing factors of organic aerosol emissions

Dufour, A., Girods, P., Masson, E., Normand, S., Rogaume, Y., and           mos. Chem. Phys., 11, 7669–7686, https://doi.org/10.5194/acp-
   Zoulalian, A.: Comparison of two methods of measuring wood               11-7669-2011, 2011.
   pyrolysis tar, J. Chromatogr. A, 1164, 240–247, 2007.                 Huangfu, Y., Li, H., Chen, X., Xue, C., Chen, C., and Liu, G.: Ef-
Eriksson, A. C., Nordin, E. Z., Nyström, R., Pettersson, E.,                fects of moisture content in fuel on thermal performance and
   Swietlicki, E., Bergvall, C., Westerholm, R., Boman, C., and             emission of biomass semi-gasified cookstove, Energy Sustain.
   Pagels, J. H.: Particulate PAH Emissions from Residential                Dev., 21, 60–65, 2014.
   Biomass Combustion: Time-Resolved Analysis with Aerosol               Huffman, J. A., Docherty, K. S., Mohr, C., Cubison, M. J., Ul-
   Mass Spectrometry, Environ. Sci. Technol., 48, 7143–7150,                brich, I. M., Ziemann, P. J., Onasch, T. B., and Jimenez, J. L.:
   https://doi.org/10.1021/es500486j, 2014.                                 Chemically-Resolved Volatility Measurements of Organic
Evans, R. J. and Milne, T. A.: Molecular characterization of the            Aerosol from Different Sources, Environ. Sci. Tech-
   pyrolysis of biomass, Energ. Fuel., 1, 123–137, 1987.                    nol., 43, 5351–5357, https://doi.org/10.1021/es803539d,
Fatehi, H. and Bai, X. S.: A Comprehensive Mathematical Model               https://doi.org/10.1021/es803539d, 2009.
   for Biomass Combustion, Combust. Sci. Technol., 186, 574–593,         Hystad, P., Duong, M., Brauer, M., Larkin, A., Arku, R.,
   2014.                                                                    Kurmi, O. P., Qi Fan, W., Avezum, A., Azam, I., Chifamba, J.,
Fawaz, M.: mfawaz2/PyEx: Manuscript Figure Data (v1.0), Zenodo              Dans, A., Du Plessis, J. L., Gupta, R., Kumar, R., Lanas, F.,
   [data set], https://doi.org/10.5281/zenodo.5562674, 2021.                Liu, Z., Lu, Y., Lopez-Jaramillo, P., Mony, P., Mohan, V.,
Fawaz, M., Lautenberger, C., and Bond, T. C.: Predic-                       Mohan, D., Nair, S., Puoane, T., Rahman, O., Tse Lap, A.,
   tion of organic aerosol precursor emission from the                      Wang, Y., Wei, L., Yeates, K., Rangarajan, S., Teo, K., and
   pyrolysis of thermally thick wood, Fuel, 269, 117333,                    Yusuf, S.: Health effects of household solid fuel use: Find-
   https://doi.org/10.1016/j.fuel.2020.117333, 2020.                        ings from 11 countries within the prospective urban and ru-
Fitzpatrick, E., Bartle, K., Kubacki, M., Jones, J., Pourkasha-             ral epidemiology study, Environ. Health Persp., 127, 057003,
   nian, M., Ross, A., Williams, A., and Kubica, K.: The mechanism          https://doi.org/10.1289/EHP3915, 2019.
   of the formation of soot and other pollutants during the co-firing    Ichoku, C. and Kaufman, Y. J.: A method to derive smoke emission
   of coal and pine wood in a fixed bed combustor, Fuel, 88, 2409–          rates from MODIS fire radiative energy measurements, IEEE T.
   2417, https://doi.org/10.1016/J.FUEL.2009.02.037, 2009.                  Geosci. Elect., 43, 2636–2649, 2005.
Freeborn, P. H., Wooster, M. J., Hao, W. M., Ryan, C. A., Nord-          Iinuma, Y., Brüggemann, E., Gnauk, T., Müller, K., Andreae, M. O.,
   gren, B. L., Baker, S. P., and Ichoku, C.: Relationships between         Helas, G., Parmar, R., and Herrmann, H.: Source characterization
   energy release, fuel mass loss, and trace gas and aerosol emis-          of biomass burning particles: The combustion of selected Eu-
   sions during laboratory biomass fires, J. Geophys. Res.-Atmos.,          ropean conifers, African hardwood, savanna grass, and German
   113, D01301, https://doi.org/10.1029/2007JD008679, 2008.                 and Indonesian peat, J. Geophys. Res.-Atmos., 112, D08209,
Gauthier, G., Melkior, T., Grateau, M., Thiery, S., and Salvador, S.:       https://doi.org/10.1029/2006JD007120, 2007.
   Pyrolysis of centimetre-scale wood particles: New experimental        Janse, A., Westerhout, R., and Prins, W.: Modelling of flash pyroly-
   developments and results, J. Anal. Appl. Pyrol., 104, 521–530,           sis of a single wood particle, Chem. Eng. Process., 39, 239–252,
   2013.                                                                    2000.
Gonçalves, C., Alves, C., Fernandes, A. P., Monteiro, C.,                Jolleys, M. D., Coe, H., McFiggans, G., McMeeking, G. R., Lee, T.,
   Tarelho, L., Evtyugina, M., and Pio, C.: Organic compounds in            Kreidenweis, S. M., Collett, J. L., and Sullivan, A. P.: Or-
   PM2.5 emitted from fireplace and woodstove combustion of typ-            ganic aerosol emission ratios from the laboratory combustion
   ical Portuguese wood species, Atmos. Environ., 45, 4533–4545,            of biomass fuels, J. Geophys. Res.-Atmos., 119, 12850–12871,
   2011.                                                                    https://doi.org/10.1002/2014JD021589, 2014.
Grønli, M. G. and Melaaen, M. C.: Mathematical model for wood            Koppmann, R., von Czapiewski, K., and Reid, J. S.: A review of
   pyrolysis comparison of experimental measurements with model             biomass burning emissions, part I: gaseous emissions of carbon
   predictions, Energ. Fuel., 14, 791–800, 2000.                            monoxide, methane, volatile organic compounds, and nitrogen
Grønli, M. G., Várhegyi, G., and Di Blasi, C.: Thermogravimetric            containing compounds, Atmos. Chem. Phys. Discuss., 5, 10455–
   analysis and devolatilization kinetics of wood, Ind. Eng. Chem.          10516, https://doi.org/10.5194/acpd-5-10455-2005, 2005.
   Res., 41, 4201–4208, 2002.                                            Lane, T. E., Pinder, R. W., Shrivastava, M., Robinson, A. L., and
Haslett, S. L., Thomas, J. C., Morgan, W. T., Hadden, R., Liu, D.,          Pandis, S. N.: Source contributions to primary organic aerosol:
   Allan, J. D., Williams, P. I., Keita, S., Liousse, C., and Coe, H.:      Comparison of the results of a source-resolved model and the
   Highly controlled, reproducible measurements of aerosol emis-            chemical mass balance approach, Atmos. Environ., 41, 3758–
   sions from combustion of a common African biofuel source, At-            3776, https://doi.org/10.1016/j.atmosenv.2007.01.006, 2007.
   mos. Chem. Phys., 18, 385–403, https://doi.org/10.5194/acp-18-        Lautenberger, C. and Fernandez-Pello, C.: Generalized pyrolysis
   385-2018, 2018.                                                          model for combustible solids, Fire Safety J., 44, 819–839, 2009.
Hennigan, C. J., Miracolo, M. A., Engelhart, G. J., May, A. A.,          Lee, B. P., Li, Y. J., Flagan, R. C., Lo, C., and Chan, C. K.: Siz-
   Presto, A. A., Lee, T., Sullivan, A. P., McMeeking, G. R.,               ing Characterization of the Fast-Mobility Particle Sizer (FMPS)
   Coe, H., Wold, C. E., Hao, W.-M., Gilman, J. B., Kuster, W. C.,          Against SMPS and HR-ToF-AMS, Aerosol Sci. Tech., 47, 1030–
   de Gouw, J., Schichtel, B. A., Collett Jr., J. L., Kreiden-              1037, https://doi.org/10.1080/02786826.2013.810809, 2013.
   weis, S. M., and Robinson, A. L.: Chemical and physical trans-        Lee, C. K. and Diehl, J.: Combustion of irradiated dry and wet oak,
   formations of organic aerosol from the photo-oxidation of open           Combust. Flame, 42, 123–138, https://doi.org/10.1016/0010-
   biomass burning emissions in an environmental chamber, At-               2180(81)90151-6, 1981.

Atmos. Chem. Phys., 21, 15605–15618, 2021                                                 https://doi.org/10.5194/acp-21-15605-2021
You can also read