The Messenger No. 181 - Quarter 3 | 2020 - European Southern Observatory
←
→
Page content transcription
If your browser does not render page correctly, please read the page content below
ESPRESSO Science Verification
The VLT-FLAMES Tarantula Survey
NGTS – Uncovering New Worlds with Ultra-Precise Photometry
Magellanic Clouds – Historical Perspectives & A View from VMC, Gaia and Beyond
                                                                                                              The Messenger
                                                                                 No. 181 – Quarter 3 | 2020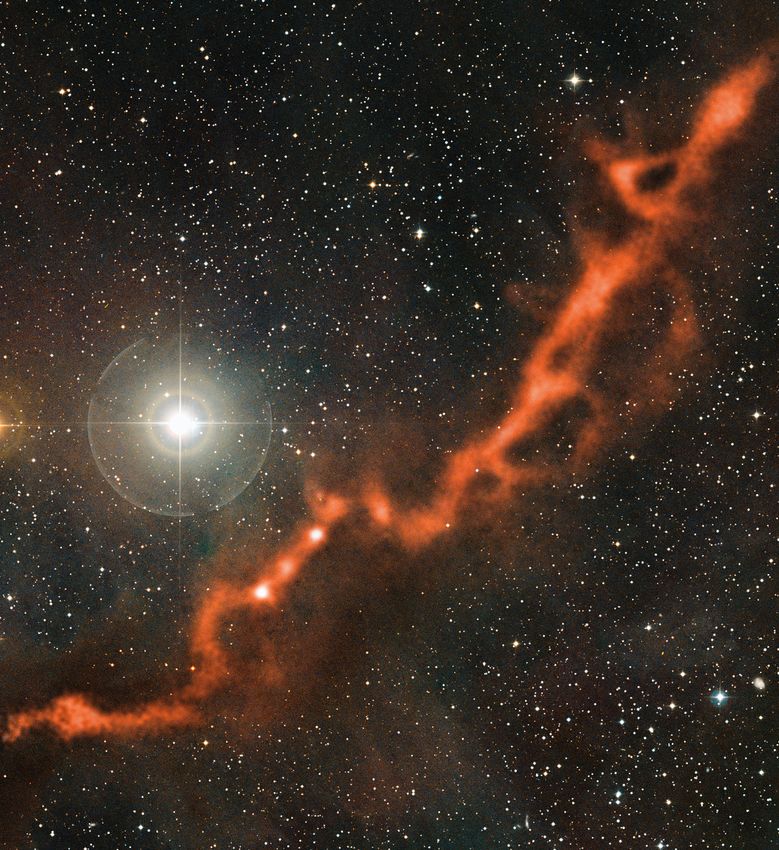
ESO, the European Southern Observa- Contents
tory, is the foremost intergovernmental
astronomy organisation in Europe. It is Instrumentation
supported by 16 Member States: Austria, Leibundgut B. et al. – ESPRESSO Science Verification 3
Belgium, the Czech Republic, Denmark, Lundgren A. et al. – An Era Comes to an End: The Legacy of LABOCA at APEX 7
France, Finland, Germany, Ireland, Italy, Petry D. et al. – ALMA Data Quality Assurance and the Products it Delivers —
the Netherlands, Poland, Portugal, Spain, The Contribution of the European ARC 16
Sweden, Switzerland and the United
Kingdom, along with the host country of Astronomical Science
Chile and with Australia as a Strategic Evans C. et al. – The VLT-FLAMES Tarantula Survey 22
Partner. ESO’s programme is focused Bayliss D. et al. – NGTS — Uncovering New Worlds with
on the design, construction and opera- Ultra-Precise Photometry 28
tion of powerful ground-based observing
facilities. ESO operates three observato- Astronomical News
ries in Chile: at La Silla, at P
aranal, site of Beccari G., Boffin H. M. J. – The ESO Cosmic Duologues 34
the Very Large Telescope, and at Llano Dennefeld M. – A History of the Magellanic Clouds and the European
de Chajnantor. ESO is the European Exploration of the Southern Hemisphere 37
partner in the Atacama Large Millimeter/ Cioni M.-R. L. et al. – Report on the ESO Workshop “A Synoptic View
submillimeter Array (ALMA). Currently of the Magellanic Clouds: VMC, Gaia, and Beyond” 43
ESO is engaged in the construction of the Gendron-Marsolais M.-L., Jones M. – Fellows at ESO 49
Extremely Large Telescope. Personnel Movements 51
The Messenger is published, in hardcopy
and electronic form, four times a year.
ESO produces and distributes a wide
variety of media connected to its activi-
ties. For further information, including
postal subscription to The Messenger,
contact the ESO Department of Commu-
nication at:
ESO Headquarters
Karl-Schwarzschild-Straße 2
85748 Garching bei München, Germany
Phone +498932006-0
information@eso.org
The Messenger
Editor: Gaitee A. J. Hussain
Layout, Typesetting, Graphics:
Lorenzo Benassi
Design, P roduction: Jutta Boxheimer
Proofreading: Peter Grimley
w ww.eso.org/messenger/
Printed by omb2 Print GmbH,
Lindberghstraße 17, 80939 Munich,
Germany
Unless otherwise indicated, all images in
The Messenger are courtesy of ESO,
except authored contributions which are
Front cover: This image of the Large Magellanic Cloud, obtained
courtesy of the respective authors. by the VISTA telescope as part of the ESO Public Survey called the
VISTA Magellanic Clouds Survey (VMC), reveals the contents of
© ESO 2020 one of our nearest galactic neighbours in unprecedented detail.
ISSN 0722-6691 The VMC allows astronomers to trace stellar evolution, galactic
dynamics and stellar variability in different environments.
2 The Messenger 181 – Quarter 3 | 2020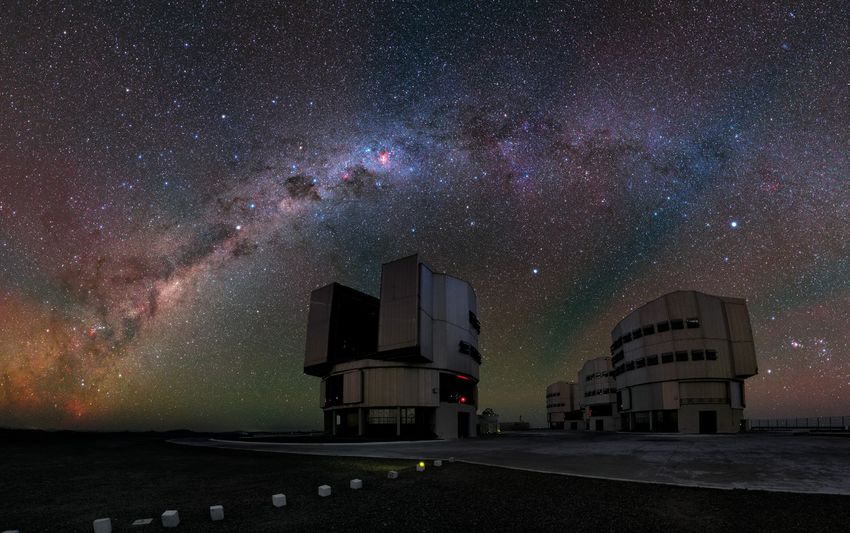
Instrumentation DOI: 10.18727/0722-6691/5204
ESPRESSO Science Verification
Bruno Leibundgut 1 25 hours of execution time, which expected owing to the faintness of the
Richard Anderson 1 resulted in an oversubscription of the science targets. Owing to a technical
Trystyn Berg 1 available time by about 25%. Proposers problem, one UT could not be used, and
Stefano Cristiani 2 were informed of the outcome of the so the observations continued with three
Pedro Figueira 1 selection on 22 July 2019 in time to meet telescopes, the exposure times being ad-
Gaspare Lo Curto 1 the Phase 2 deadline on 31 July. justed accordingly for some programmes.
Andrea Mehner 1 Despite these problems four programmes
Elyar Sedaghati 1 The proposed science cases covered a could be completed. Owing to the signifi-
John Pritchard 1 wide range of topics, including the obser- cant loss of observing time the observa-
Markus Wittkowski 1 vation of the most massive star in a dis- tory granted another 7 hours of observing
tant dwarf galaxy, the detection of water time in early September. Data for three
in an outgassing comet from the main additional programmes could be acquired
1
ESO asteroid belt, the characterisation of an under excellent conditions over the follow-
2
INAF Trieste, Italy exoplanet atmosphere during a transit, ing nights so that 7 out of 10 scheduled
measuring the chemical composition programmes could be completed. The
of a turnoff star in a globular cluster, an ESPRESSO science verification page pro-
ESPRESSO Science Verification took attempt to measure the fine-structure vides information on the completed pro-
place at the end of August and the constant at high redshift, observations grammes and links to the archived data.
beginning of September 2019. It was of potential stimulated (laser) emission
spread over two visitor-mode nights, in a distant galaxy, the first measurement
requiring seven hours of observations of the 12C:13C ratio in a low-metallicity Archive and data processing
taken in service mode. The weather damped Lyman-α system, and the detec-
conditions (strong winds and poor see- tion of 6Li in a star in the SMC. All raw data are publicly available through
ing conditions) and some telescope the ESO science archive. The ESPRESSO
problems (failure of guide cameras) science verification webpage has been
hampered the first two nights and addi- Observations updated with direct links to the raw data
tional time was granted to finish the in the archive. Pipeline-reduced data (ver-
top-ranked programmes. In response The ESPRESSO science verification sion 1.4.2) were also provided, and are
to the call for ESPRESSO science verifi- nights were scheduled on 26 and 27 linked from the ESPRESSO science verifi-
cation, 16 proposals were submitted, August 2019. The first night was severely cation webpage. The current ESPRESSO
10 of which were scheduled for a total affected by inclement weather (high pipeline release is version 2.2.14. Some of
of 25 hours of observations. A slight winds), which resulted initially in pointing the data presented below were reduced
oversubscription of the available time restrictions and subsequently closure of with the ESO Data Reduction Software
was planned to allow for the prevailing the domes. The second night started (DRS) (Sosnowska et al., 2015) and ana-
atmospheric conditions. The seven with pointing restrictions and a seeing of lysed with the Data Analysis Software
top-ranked programmes were fully 1.5 to 2 arcseconds. The acquisitions (DAS) specifically developed for
completed. proved to be more time consuming than ESPRESSO (Cupani et al., 2019).
Proposal solicitation and submission
ESPRESSO is offered with one VLT Unit 1
Telescope (1-UT mode) or with all 4 Unit
Telescopes (4-UT mode) combined.
ESPRESSO has already been offered in
1-UT mode since Period 102 (October
Normalised flux
2018) and a call for ESPRESSO science
verification proposals with the 4 UTs
combined was issued on 14 June 20191, 2 0.5
offering 2 observing nights. Alongside the
call, the ESPRESSO science verification
webpage3 was launched and 16 propos- Figure 1. Details of the
ESPRESSO spectrum
als were received by the deadline on
536.2861 Fe II
536.5399 Fe I
536.9961 Fe I
536.4871 Fe I
536.7466 Fe I
537.1600 Fe I
537.1489 Fe I
of a blue straggler in
5 July 2019, requesting a total of 32.3 the globular cluster
hours. Pal12 compared to the
MyGIsFoS (Sbordone
0
et al., 2014) analysis.
The science verification team ranked the The best fitting synthetic
proposals according to scientific merit. 536 536.5 537 spectrum is shown
Ten projects were selected for a total of Wavelength (nm) in red.
The Messenger 181 – Quarter 3 | 2020 3
Instrumentation Leibundgut B. et al., ESPRESSO Science Verification
+1σ generator that shows the partial circle
–1σ 198 199 200 201 202 203204
“observed” by the ESPRESSO sky fibre,
205 206
el dgbdas
dq ag cc
am fl
av
du dv
ea
bq ey
cr dx
dh bufo bi aa ayeh az
bm bc egcq cv ev bv
cf ds
b gce
ae
by au
cu ff
eb ci db
so the user can check that no objects
1 overlap with it.
Normalised flux
The signal-to-noise ratio per integrated
0
Fell 1608.45 1.00044 f = 0.0529 x2abs= 441.2500 x2red = 1.7236 pixel in the fully reduced data is ~ 23 in
q = –1165 npix = 575 ndf = 256 1 - J2123ss_norm.fits
the Li 6708-Å region, which is adequate
+1σ to derive abundances for several ele-
–1σ 250 251 252 ments (see Figure 1). Unfortunately, the
el dg as am du bq ey bufo bi aa ay cf ds ae cu
1 dq ag cc av ea cr bm bc eg cq cv bg ce by au ci upper limit on the Li abundance is not
low enough to decide on the blue strag-
gler mechanism formation, but other ele-
0 ment abundances and their comparison
x2 abs= 502.5300 x red = 1.6476
2
f = 0.2936
Fell 2382.76 1.00154 q = 1505 npix = 576 ndf = 305 2 - J2123ss_norm.fits with the abundances obtained in giants
of the same cluster will nevertheless pro-
– 200 –150 –100 – 50 0 50 100 150 200
vide interesting results.
Velocity relative to zabs = 2.058706 (km s –1)
Disappearance of a luminous blue
Figure 2. Details of the ESPRESSO spectrum of a This programme aimed to obtain abun- variable
sub-damped Lyman-α system. Many suitable transi-
dances for a star of V ≈ 19.1 to demon-
tions are detected in an absorption complex span-
ning about 400 km s –1. The Fe II transitions falling strate the potential of the 4-UT mode for Massive stars in low-metallicity environ-
within the spectral range covered by the 4-UT faint star spectroscopy. Sky subtraction ments are very interesting and may be
ESPRESSO data include lines at 1608, 2344, 2374, is essential to derive precise abundances linked to different types of supernovae.
2383 and 2600 Å. The figure shows two of these,
at these magnitudes. However, the sky The metal-poor dwarf galaxy PHL 293B
1608 Å and 2383 Å. Illustrated along with the 1608-Å
profiles are the interesting broad CIV 1550-Å fea- spectra collected on fibre B were found hosted a luminous blue variable star, for
tures modelled by Hamann et al. (2011) as outflows to be contaminated by another source. which ESPRESSO was supposed to pro-
from the quasar. Since wavelength calibration makes This is a problem in crowded fields: dur- vide a detailed spectral analysis. The pro-
use of the laser frequency comb, one of the major
ing one exposure, the field rotates and posers hoped to determine luminosity,
sources of systematic errors in this sort of study is
eliminated. Preliminary results, solving for α, indicate the sky fibres draw an arc in the sky so effective temperature, surface abun-
an overall error budget at around the 10 –6 level, they may get contaminated by nearby dances and wind parameters for this
making this one of the most precise measurements sources. The geometry of each telescope object in a low-metallicity environment.
of α to date.
is different, so it may happen that only As it turned out the signature of the lumi-
one telescope contributes to the contam- nous blue variable — broad hydrogen
Science results ination. Thanks to this observation, a tool lines from the wind — had disappeared
has been now added in the finding charts at the time of the observations in August
Chemical composition of an
extragalactic turnoff star
13
C 12C
Normalised flux
A blue straggler in the globular cluster 1.0
Pal 12 was observed. This solar-mass 0.5
star is close to the main-sequence turnoff 0.0
Ci ii λ1334 O i λ1302 Al ii λ1670
of this globular cluster in the Sagittarius
dwarf galaxy. It represents the best
chance to observe a bona fide extraga-
lactic low-mass star with known age and
Normalised flux
1.0
metallicity. A debate is ongoing as to
0.5
whether blue stragglers are formed by
Si ii λ1304 Si ii λ1526 Fe ii λ1608
collision or by fusion of two stars and it 0.0
should be possible to distinguish between
these possibilities by measuring the Li –20 0 +20 –20 0 +20
abundance, which is expected to be Relative velocity (km s –1) Relative velocity (km s –1)
Normalised flux
1.0
around A(Li) = 1.0 for collisions and fully
depleted in the case of a merger. 0.5
Fe ii λ2344
0.0
Figure 3. Line fits to various absorption lines in the
DLA (z = 2.34) towards J0035‑0918. The rest-frame
wavelengths are indicated by red tick marks. From –20 0 +20
Welsh et al. (2020). Relative velocity (km s –1)
4 The Messenger 181 – Quarter 3 | 2020
ESPRESSO Sunburst Arc
R = 70 000 (September 2019: 4-UT mode)
z = 2.37
2 (Lyα)
CIII] 1909
SiIII](1892)
UV34(1914)
Relative flux
1 Tr
0
1880 1890 1900 1910 1920
Rest-frame wavelength (Å) Transient
Figure 4. The left panel shows the one- separated absorption components. The tight enough to distinguish between the
dimensional spectrum obtained with ESPRESSO
individual components appear strong yet possible enrichment models. Interest-
(green, R = 70 000) and the smoothed version (red,
R = 7000). Three lines are indicated, SiIII]1892, unsaturated and are ideal for a measure- ingly, the star formation can be deter-
CIII]1909 and the faint fluorescent iron line at 1914 Å ment of Δα/α promising to provide a mined to have started only about 1 Gyr
as part of a group of lines known as UV34. The strong new constraint on any change. after reionisation of the Universe and star
1914-Å line is generated by Lyman-α pumping radia-
Figure 2 shows part of the high-signal-to- formation was quenched by heating of
tion. The right panel displays the HST ACS/F814W
image of the lensed arc, with the inset zooming noise spectrum around two Fe absorp- the interstellar medium. The data were of
in on the region of the transient Tr observed with tion lines. sufficiently high signal-to-noise to provide
ESPRESSO (the green circle corresponds to an upper limit on the variation of the
1 arcsecond in diameter), while the boxes are
fine-structure constant, one of the main
9 arcseconds across. From Vanzella et al. (2020b). 12
C/13C molecular ratio at high redshift scientific goals of ESPRESSO.
2019 (Allan et al., 2020). A quick double- The formation of elements proceeds via
check with X-shooter was requested and stellar enrichments. Depending on the Space foam
confirmed the disappearance of the lumi- enrichment source, different values of the
nous blue variable features. This led to ratio of the two carbon isotopes 12C and Space is generally assumed to be a con-
13
the conclusion that the star was in a lumi- C are expected. For example, superno- tinuum, but some models of quantum
nous blue variable outburst in the first vae from massive stars of the first gener- gravity predict that it may have a “frothy”
decade of this century but that the out- ation of stars (Population III) will mostly structure. Such models involve a change
burst must have ended after 2011, as produce 12C, while evolved stars on the in the characteristics of an emitted pho-
deduced from archival data. This was the asymptotic giant branch (a later Popula- ton — for example, its energy — as it
first time such an event had been found tion II) will have a higher fraction of 13C. travels through space. A monochromatic
in a low-metallicity galaxy. Possible inter- The isotopic wavelength shift for two car- light source would gradually disperse as
pretations include that, after the eruption, bon transitions at 1334 Å is only 0.013 Å, a result of space-time fluctuations. Since
the star shifted to a higher temperature, corresponding to a relative velocity shift these effects are predicted to be tiny, long
that it suffers dust obscuration or that the of 2.99 km s – 1. To measure such a tiny distances must be probed. ESPRESSO
star collapsed directly to a black hole wavelength offset, very high spectral res- observations were used to investigate
without a supernova display. High- olution and a high signal-to-noise ratio are the narrow Fe II 1608-Å line in a DLA at
resolution imaging to determine the cur- required — an ideal case for ESPRESSO z = 2.34, corresponding to a comoving
rent brightness of the star should provide combining the light of all four UTs. Fig- distance of 5.8 Gpc (Cooke et al., 2020).
information that will make it possible to ure 3 (from Welsh et al., 2020) shows The critical measurement is the broaden-
decide between these possibilities. absorption lines from a damped-Lyman-α ing of the line caused by space foam
system at a redshift z = 2.34. This system effects. For the line broadening, the ther-
was chosen because it appears to be mal energy dominates and hence a line
Fundamental constants one of the most pristine gas clouds from an element with a high atomic num-
known at high redshift. The individual ber is favoured. At the same time, the
One of ESPRESSO’s key scientific goals lines are well fitted by models of a single effect depends on the ratio between dis-
is to measure the variation of fundamen- line. The ratio 12C/13C is best fitted tance and wavelength, and the shortest
tal constants, and if they change in time with log(12C/13C) = 1.15 ± 0.65 and a 2σ available wavelength of a heavy element
or spatially. A sub-damped-Lyman-α upper limit for this ratio was found to be is best suited to this measurement —
(DLA) system at z = 2.059 shows well- log(12C/13C) > 0.37. This ratio is not quite hence the choice of the Fe II ultraviolet
The Messenger 181 – Quarter 3 | 2020 5
Instrumentation Leibundgut B. et al., ESPRESSO Science Verification
line. The limits derived from the high ure 4). The exact nature of the transient in this article: Luca Pasquini and Piercarlo Bonifacio,
José Groh, Ryan Cooke and Louise Welsh, Eros
signal-to-noise ESPRESSO spectrum are is still under investigation to determine
Vanzella, and John Webb, Dinko Milakovic and
promising but not yet competitive with where it may fit among the possible cate- Vincent Dumond.
imaging point sources at the highest gories of supernovae (Vanzella et al.,
observed energies. 2020b). Fluorescence emission from iron
References
is detected as the result of possible inter-
action among the circumstellar material Allan, A. et al. 2020, accepted by MNRAS,
Lensed transient at z = 2.37 and the explosion event. 496, 1902
Cooke, R. et al. 2020, MNRAS, 494, 4884
Cupani, G. et al. 2019, Astronomical Data Analysis
ESPRESSO was used to observe a
Software and Systems, XXVI, 362
strongly lensed peculiar stellar transient Summary Hamann, F. et al. 2011, MNRAS, 410, 1957
at cosmological distance z = 2.37 hosted Rivera-Thorsen, T. E. et al. 2019, Science, 366, 738
in the highly magnified Sunburst arc The capabilities of the ESPRESSO 4-UT Sbordone, L. et al. 2014, A&A, 564, 109
Sosnowska, D. et al. 2015, Astronomical Data
(Vanzella et al., 2020a; Rivera-Thorsen mode have been amply demonstrated
Analysis Software and Systems, XXIV, 285
et al., 2019). by the presented projects. Four refereed Vanzella, E. et al. 2020a, MNRAS, 491, 1093
papers have already been published Vanzella, E. et al. 2020b, arXiv:2004.08400
The target, indicated by the letters “Tr” showcasing new results, and they Welsh, L. et al. 2020, MNRAS, 494, 1411
in Figure 4, is very faint (around 21 mag- demonstrate the scientific interest
nitudes) for a high-resolution spectro- this new VLT facility fosters. Links
graph and was observed at an airmass
of 1.7. The wavelength-calibrated, sky- Acknowledgements
1
Science announcement of the ESPRESSO Science
Verification: http://www.eso.org/sci/publications/
subtracted, optimally extracted spectra
announcements/sciann17215.html
of the orders produced by the DRS were We received excellent support at the telescope from 2
A nnouncement of the ESPRESSO Science
combined by the DAS into a spectrum of the Telescope and Instrument Operators. They Verification in the Science Newsletter: https://www.
accommodated additional science verification
remarkable quality, in which the contin- observations flexibly to conclude as many pro-
eso.org/sci/publications/newsletter/jun2019.html
3
ESPRESSO Science Verification website: http://
uum is detected at a signal-to-noise grammes as possible after the first night was lost to www.eso.org/sci/activities/vltsv/espressosv.html
around 3 (per resolution element) inclement weather. We would like to thank the fol- 4
L atest ESPRESSO pipeline release:
together with several emission lines lowing Principal Investigators who kindly provided http://www.eso.org/sci/software/pipelines/
the preliminary science verification results presented
at signal-to-noise around 3–10 (see Fig- espresso/espresso-pipe-recipes.html
Y. Beletsky (LCO)/ESO
A panorama of the VLT
platform with distinctive
red airglow visible over-
head.
6 The Messenger 181 – Quarter 3 | 2020
Instrumentation DOI: 10.18727/0722-6691/5205
An Era Comes to an End: The Legacy of LABOCA at APEX
Andreas Lundgren 1 the Solar System and star-forming and the Hubble Deep Field (Smail et al.,
Carlos De Breuck 1 regions throughout the Galactic plane, 1997; Hughes et al., 1998). Its main limi-
Giorgio Siringo 1 to the most distant galaxies. As the tation was the small field of view and
Axel Weiß 2 operation of LABOCA is soon coming to further progress was only possible by
Claudio Agurto 1 an end to make space for a new array of increasing the bolometer array sizes by
Francisco Azagra 1 continuum detectors, we present an an order of magnitude. This motivated
Arnaud Belloche 2 overview of the challenges, lessons the bolometer development group led by
Michael Dumke 1 learned and science impact that it has Ernst Kreysa at the Max Planck Institute
Carlos Durán 1 generated. To date, LABOCA has pro- for Radio Astronomy in Bonn (MPIfR),
Andreas Eckart 2 duced the most papers of any APEX who had already provided the community
Edouard González 1 instrument and compares favourably with MAMBO, SIMBA and its line of pre-
Rolf Güsten 2 with many VLT instruments. decessors, to build LABOCA (Siringo et
Alvaro Hacar 3 al., 2009) for the new Atacama Pathfinder
Attila Kovács 4 Experiment (APEX) 12-m submillime-
Ernst Kreysa 2 Introduction tre telescope as one of its main facility
Felipe Mac-Auliffe 1 instruments (Güsten et al., 2006). With as
Mauricio Martínez 1 Continuum imaging at (sub)millimetre many as 295 bolometers covering a cir-
Karl M. Menten 2 wavelengths provides unique information cular field of 11.4 arcminutes, LABOCA
Francisco Montenegro 1 on the thermal dust emission from cir- would remain the largest submillimetre
Lars-Åke Nyman 1 cumstellar discs (for example, Beckwith array till the SCUBA-2 instrument became
Rodrigo Parra 1 et al., 1990) and star-forming regions (for available on the JCMT in 2012 (Holland
Juan Pablo Pérez-Beaupuits 1 example, Motte, Andre & Neri, 1998). et al., 2013). Being installed on APEX,
Vincent Reveret 5, 6 As these wavelengths probe the steep LABOCA could also make optimal use
Christophe Risacher 7 Rayleigh-Jeans slope of cold (< 100 K) of the excellent weather conditions on
Frédéric Schuller 8 dust emission, the observed flux density Chajnantor, where the 870-µm atmos-
Thomas Stanke 1 remains roughly similar from z = 1 to pheric window is observable for almost
Karl Torstensson 1 z = 10, which makes this wavelength two-thirds of the available weather condi-
Paulina Venegas 1 regime ideal to select targets over half tions (Otarola et al., 2019). In addition,
Helmut Wiesemeyer 2 the age of the Universe. As the sensitivity seeing the same sky as ALMA optimised
Friedrich Wyrowski 2 depends on the bandwidth covered, LABOCA’s synergy as the ideal source
bolometers have a major advantage over finder for ALMA.
heterodyne instruments. After initial
1
ESO efforts using single bolometers (for exam-
2 Figure 1. The LABOCA bolometer array consists of
Max-Planck-Institut für ple, Kreysa, 1985), several small arrays of 295 semiconducting composite bolometers arranged
Radioastronomie, Bonn, Germany bolometers came online in the 1990s: in a hexagonal grid. The array is manufactured on a
3
Leiden Observatory, Leiden, Submillimetre Common-User Bolometer 10-cm single-crystal silicon wafer coated on both
The Netherlands Array (SCUBA) on the James Clerk sides with a silicon-nitride film by thermal chemical
4 vapour deposition. The wiring is created by microli-
Smithsonian Astrophysical Observatory, Maxwell Telescope (JCMT) in Hawai‘i thography of niobium and gold thin layers (left); one
Cambridge, United States (Holland et al., 1999), Max Planck broken membrane is visible on the top left corner.
5
IRFU, CEA, Université Paris-Saclay, Millimeter BOlometer (MAMBO) on the On the opposite side of the wafer, 295 square cavi-
Gif-Sur-Yvette, France IRAM 30-m telescope of Pico Veleta and ties are etched into the silicon wafer by wet etching
6 with potassium hydroxide, producing freestanding,
AIM, CEA, CNRS, Université de Paris, SEST IMager Bolometer Array (SIMBA) unstructured silicon-nitride membranes of 400-nm
Gif-Sur-Yvette, France on the SEST at La Silla in Chile (both thickness (middle). A very thin titanium layer is then
7
IRAM, Saint Martin d’Hères, France Kreysa et al., 1999). sputtered onto the cavity side of the wafer to act as
8 absorber for the submillimetre radiation. In a last
AIP, Potsdam, Germany
step the thermistors are soldered to free-standing
In the 1990s, SCUBA had just opened up membranes with an indium alloy. The thermistors are
the field of observational submillimetre brick shaped (right) but appear as small cubes on
It was 13 years ago, in May 2007, when cosmology by mapping massive clusters the membranes because of the viewing angle.
the Large APEX Bolometer Camera
(LABOCA) was commissioned as a
facility instrument on the APEX tele-
scope at the 5100-m-high Llano de
Chajnantor. This 870-µm bolometer
camera, in combination with the high
efficiency of APEX and the excellent
atmospheric transmission at the site,
has offered an unprecedented capabil-
ity in mapping the submillimetre contin-
uum emission in objects ranging from
The Messenger 181 – Quarter 3 | 2020 7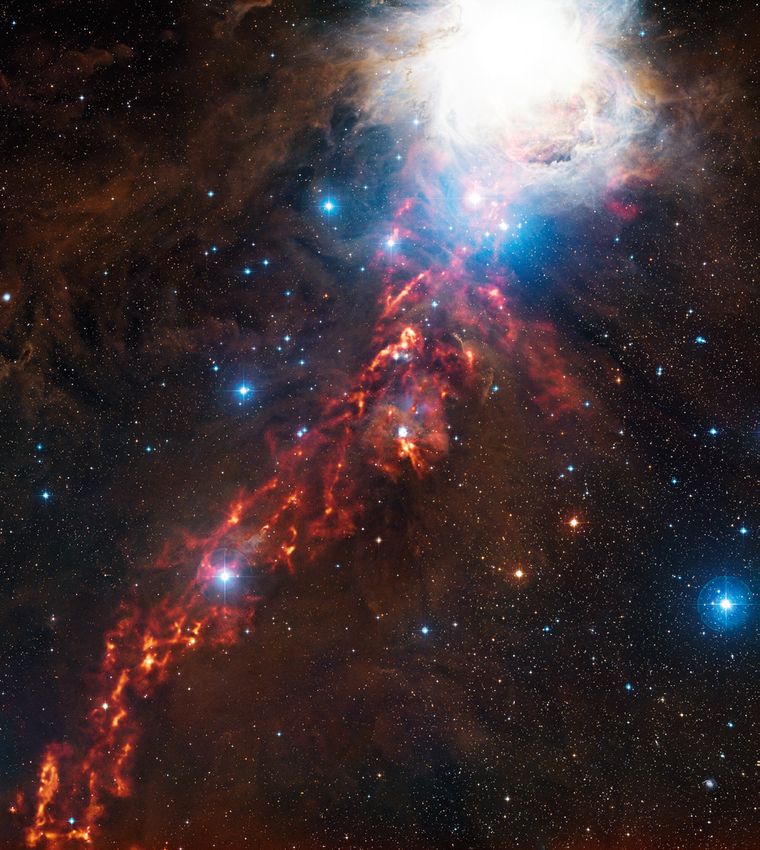
Instrumentation Lundgren A. et al., An Era Comes to an End: The Legacy of LABOCA at APEX
Figure 2. The image on the left shows APEX staff
astronomer, Andreas Lundgren, in the process of
refilling LABOCA. The transfer tube that is wrapped
behind his back goes from a liquid helium dewar in
the foreground to the helium tank in LABOCA, shown
in the inset image in the upper left corner. The cry-
ostat is shown from above in this inset. The image
on the right shows Ernst Kreysa, the leader of the
MPIfR bolometer group, together with the LABOCA
cryostat in the Cassegrain cabin of the APEX tele-
scope. At the time the picture was taken, the instru-
ment PolKa was being installed.
polar coordinates it was possible to move
the telescope along spiral patterns opti-
mised to obtain maps with full spatial
sampling and excellent coverage. For
coverage of square degrees or more, rec-
tangular on-the-fly maps turned out to be
more efficient.
The lack of a readily available software
package to reduce the data has been
recognised as a major drawback of
the fast scanning technique applied to
MAMBO and SIMBA. For this reason, in
parallel with the hardware development
Being faster than the sky (as an ALMA prototype) without using the of LABOCA, a new data reduction soft-
chopping secondary. The design there- ware package was developed, called the
Observations of astronomical objects fore required fast sampling of the bolome- Bolometer data Analysis package (BoA;
from ground-based telescopes at ters’ signals. Following the success of the Schuller, 2012), which is able to reduce
(sub)millimetre wavelengths require tech- MAMBO analogue-to-digital converter data acquired with LABOCA in any of the
niques to minimise disturbance from the (ADC)-based backend, a new ABBA back- possible observing modes; the package
Earth’s atmosphere, which is seen by a end for LABOCA has been built, upgrad- is mostly based on Python, and is open
bolometer as a fluctuating bright screen. ing the scheme of the MAMBO one, which source, distributed under the GNU
The most widely used minimisation tech- can sample up to 320 analogue channels General Public License. In addition,
nique is to modulate the signal from the in parallel up to 1000 Hz (see a detailed the Comprehensive Reduction Utility
sky, usually by chopping with the sec- description by Siringo et al., 2009). The for SHARC-2 package (CRUSH; Kovács,
ondary mirror between two close posi- total power design has been optimised to 2008) was adapted to handle LABOCA
tions, ideally at a frequency higher than make LABOCA capable of mapping the data.
that of the sky fluctuations. Synchronous most diffuse emission of large extended
demodulation is then used to filter out the sources. A detailed analysis of spatial
sky noise and extract the signal of astro- filtering with an investigation of the The LABOCA detectors
nomical interest. Mapping a region of the Chamaeleon dark clouds by Belloche et
sky by scanning in the chopping direction al. (2011a,b) showed that the size of the The initial design of LABOCA considered
will result in both a positive and a negative structures that can be recovered is lim- using superconducting transition-edge
source signal separated by the chopping ited to about 5 arcminutes, i.e., half the sensors (TES) developed at the MPIfR
amplitude. A similar technique has been array size. in collaboration with the Institute for
used with double horn receivers at centi- Photonics Technology of Jena (IPHT) and
metre wavelengths. Efficient algorithms During the commissioning of LABOCA, operated with a closed-cycle pulse-tube
have been developed to retrieve sources extensive tests and simulations were cryo-cooler (Jethava et al., 2008). How-
from double-beam maps (Emerson, Klein undertaken to determine the optimal ever, the pressure to install LABOCA as
& Haslam, 1979). This method has also scanning pattern. Lissajous patterns are quickly as possible led to the decision to
been used with bolometers. often used at other (sub)millimetre tele- stick with well-established semiconductor-
scopes to achieve good spatial sampling. based bolometers (neutron transmutation
The experience with MAMBO and SIMBA However, they turned out to have a ten- doped [NTD]-germanium thermistors, see
played an important role in the design of dency to give greater weight to the edges below) in a liquid helium cooled “wet”
LABOCA. The new bolometer camera of the map with less coverage in the cen- cryostat to avoid problems with micro-
was intended from the beginning to be tre. A new observing pattern was there- phonics. While this inevitably led to
used in a fast scanning mode, to take full fore created for fast scanning with APEX: some operational constraints (see the
advantage of the fast-moving telescope by using strokes at constant velocity in section on cryogenics below), it did allow
8 The Messenger 181 – Quarter 3 | 2020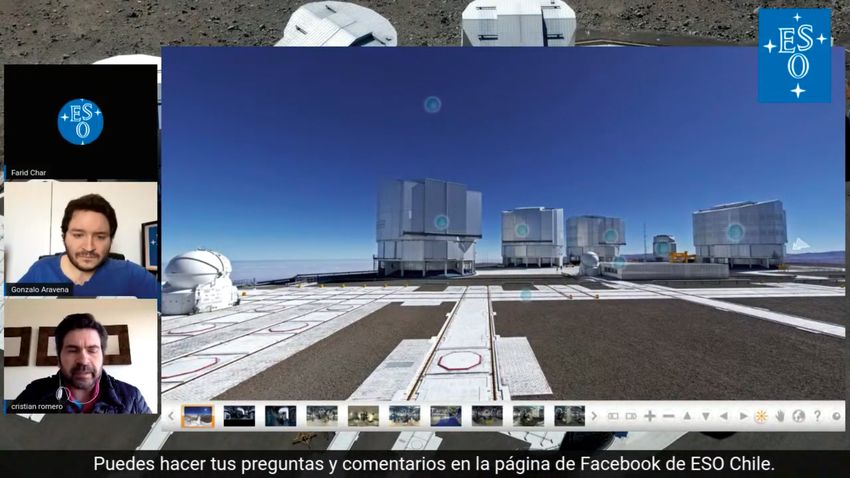
LABOCA to produce scientific results for a reasonably sized reflective half-wave different telescopes (the 10-m Heinrich
several years before other submillimetre plate with a small angle of incidence near Hertz Telescope and the IRAM 30-m
instruments like Herschel and SCUBA-2 the common waist of the two telescopes. telescope). A complete description and
came online. The effort in designing and Three off-axis mirrors, two plane mirrors some results are presented in Siringo et
prototyping TES bolometers was not in and a lens (the cryostat window) make up al. (2012).
vain: the new technology was used in the tertiary optics. Unfolding the optical
the Submillimetre APEX Bolometer path at the plane mirrors would show that The polarisation modulator used in PolKa
Camera, SABOCA (Siringo et al., 2010), this solution still maintains one plane of is a rotating reflection-type half-wave
a 37-element array for the 350-µm symmetry. This property contributes to plate. The reflection-type half-wave plate
atmospheric window that was commis- the diffraction-limited performance at consists essentially of two parts: a wire-
sioned in 2008 as a facility instrument 350 μm. Relaxing the wavelength to grid linear polariser and a plane mirror,
on APEX. SABOCA remained operational 870 μm and doing without the polarime- held parallel to each other. By tuning the
until 2015, when it was replaced by the try mode would allow much simpler distance between the two parts, it is pos-
ArTéMiS instrument covering both the optics to be designed. sible to introduce a controlled phase shift
350- and 450-µm atmospheric windows between the two components of the linear
(Talvard et al., 2018). The polarimeter for LABOCA is an en- polarisation, because one is reflected by
hanced version of the Polarimeter für the wires and the other one by the mirror
NTD thermistors for bolometer arrays Bolometer Kameras (PolKa) developed after a longer path.
need extremely tight control of the dop- at MPIfR between 2000 and 2004 as a
ing for uniform performance. The group plug-in instrument adding polarisation PolKa for LABOCA was not yet available
under Eugene E. Haller at Lawrence capabilities to any of the MPIfR bolometer at the time of LABOCA’s installation and
Berkeley Laboratory (LBL) pioneered the arrays, at different wavelengths and on commissioning — it was installed at the
use of NTD-germanium for this purpose,
in cooperation with the MPIfR bolometer
group (Palaio et al., 1983). When design-
ing LABOCA, several crystals of NTD-Ge
with different dopings were available to
choose from. Optimal chip resistance is
then determined only by temperature and
geometry to match the noise properties
of the silicon field-effect transistor ampli-
fier. This was achieved by precision dic-
ing at LBL, with boron low-noise contacts
and gold coating for ease of soldering.
The chips are finally polish-etched to
remove noise producing surface states,
which explains the rounded corners of
the chips (Figure 1).
Tertiary optics with integrated
polarimetry mode
The main task of the tertiary optics is to
transport the beams from the Cassegrain
focal plane to the final focal plane in the
cryostat, while changing the focal ratio
from f/8 to f/1.5. In order to satisfy
the boundary conditions of the APEX
C-Cabin, an optical solution was found
with two Gaussian beam telescopes in
series. This design has an ideal position
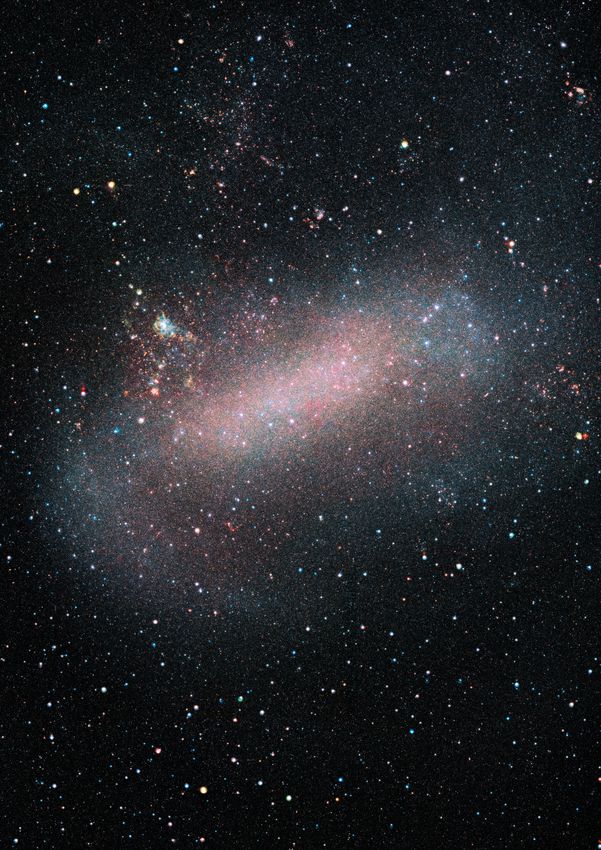
Figure 3. LABOCA emission map of the Barnard
211/213 filament in Taurus (red emission) super-
posed on an optical DSS image of this region (back-
ground). Note the rich substructure shown by the
LABOCA emission along this region, including multi-
ple branches and condensations corresponding to
dozens of small-scale fibres inside this filament.
The Messenger 181 – Quarter 3 | 2020 9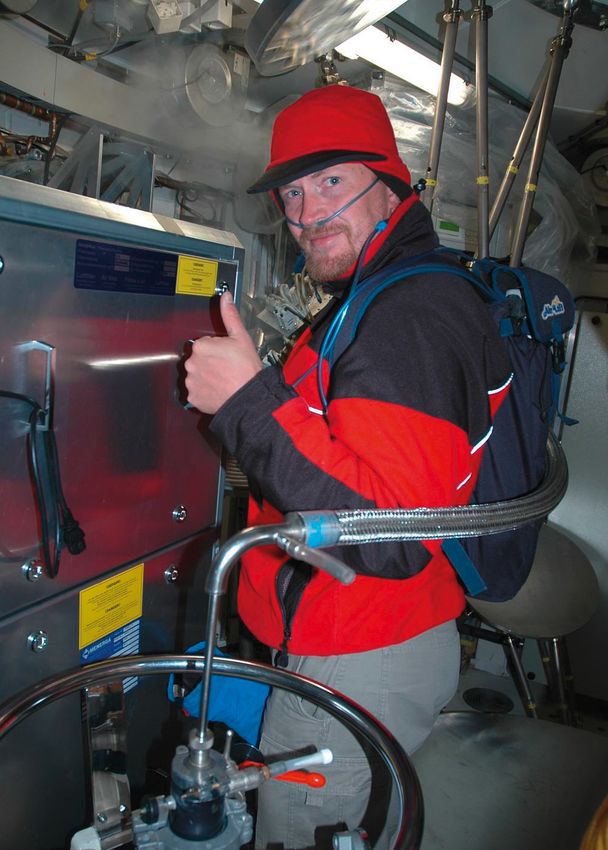
Instrumentation                                        Lundgren A. et al., An Era Comes to an End: The Legacy of LABOCA at APEX

Figure 4. Middle: full extent of the Orion LABOCA      Photometric mode                               This mode was therefore decommis-
survey, spanning almost 11 degrees north to south.
                                                                                                      sioned in August 2016.
The northern half covers prominent star-forming
clumps in the Orion B giant molecular cloud (from      As LABOCA is a sparsely sampled array,
north to south: L1622, NGC 2071 and NGC 2068,          a given source is seen by a single bolom-
Ori B9, and NGC 2024 and NGC 2023 including the        eter for only ~ 1/16th of the observing        Working with cryogenics at 5100 m
Horsehead Nebula). The southern half covers a
                                                       time for a Nyquist sampled map. After the
major fraction of the Orion A giant molecular cloud,
including the Integral-Shaped Filament with the        wobbler became available, a more effi-         The safe handling of cryogenic liquids at
Orion Nebula at its centre at the top, and the L1641   cient photometric mode was offered to          5100 m was one of the challenges in the
cloud further south. Left: zoom-in on the NGC 2071     the community as a means of determin-          operation of LABOCA. Thanks to strict
and NGC 2068 area, with LABOCA dust emission
                                                       ing flux densities of compact sources          procedures, this went fine apart from a
shown in orange on top of a multicolour optical
image (DSS). Right: close-up of the filamentary dust   without spatial information, but with high     small mishap when nitrogen was acci-
emission extending south-east of the Orion Nebula      sensitivity. This was done by using the        dentally put into the helium tank. This
in the L1641 cloud.                                    APEX wobbler to chop symmetrically             required quick action to melt the nitrogen
                                                       between the target and nearby off posi-        ice with a copper rod in order to avoid
end of 2009 as a permanent add-on                      tions in a similar way as is done for heter-   over-pressurising the helium tank. But
available for use with LABOCA until the                odyne observations. For the LABOCA             even in regular operation, doing a daily
end of its operation. For polarimetry, one             implementation, the key was to use a           refill of helium at 5100 m is quite a strain
mirror was replaced by the reflection-type             sensitive bolometer on the optical axisa to    on operations. Everyone at APEX will
half-wave plate on its air bearing. When               stare at the target source, while the other    remember the heroic “LABOCA rescue
PolKa was not being used, only the deli-               elements produced redundancy in esti-          missions” involving a 130-km ride to the
cate wire grid of the reflection-type half-            mating the sky emission. This was a            high site in the middle of a freezing night
wave plate had to be removed (Figure 1).               good way of integrating deeper in com-         to top up liquid helium on the (thankfully
A filter wheel, holding two polarisation               pact regions but this mode still required      rare) occasions when LABOCA unex-
filters and a calibration hot load, has                an exquisitely stable atmosphere and was       pectedly ran out of coolant. All new APEX
replaced the original hot load in front of             prone to systematic errors such as spillo-     instruments after LABOCA have been
the cryostat window. No other modifica-                ver of ground radiation as a result of         designed to run with closed-cycle cry-
tions of the optics were required. In order            imperfections in the secondary mirror          ostats that can be fully remotely oper-
to avoid mechanical or optically induced               surface. While this photometric mode           ated. One lesson learned from LABOCA
microphonics, the reflection-type half-                was quite popular from 2010 to 2013,           was to mount the cryostat inside the
wave plate is rotated on an air bearing.               it lost its relevance for compact point        moving Cassegrain cabin at an angle
                                                       sources as ALMA could reach better sen-        close to 45 degrees so that it is close to
                                                       sitivity significantly faster than LABOCA.     vertical during the observations. This is

10            The Messenger 181 – Quarter 3 | 2020
particularly important during the conden- that the flux of an object remains roughly adigmatic filament. In a pioneering dis-
sation phase of the recycling process. identical from z = 0.7 to 10 to study radio covery, the combination of this LABOCA
During the two hours of LABOCA recy- galaxies, dusty star-forming galaxies and image with additional molecular line
cling, we therefore restrict the elevation protoclusters. As it is impossible to cover observations demonstrated the existence
range of the observations with any other all topics, we here present only a few of dozens of small-scale sub-filaments,
instrument between elevations of 30 and selected highlights which illustrate the high known as fibres, bundled together in
60 degrees. Although this puts quite synergy with other observatories, mainly space and forming an elongated struc-
some constraints on the observing ALMA but also Herschel and the VLT. ture on large scales.
schedule, the APEX science operations
staff have been able to successfully inte-
grate these recycling restrictions into the Star-forming filament in Taurus Cold dust present in star-forming
observing plans. This applies to all closed- regions
cycle cryostats based on pulse-tubes Characterising the origin of stars inside
operating in the Cassegrain cabin. filaments is recognised as one of the LABOCA is well suited to measuring
major open questions in the field of star the amount of cold dust present in star-
formation. The cosmic dust grains in forming regions, with a spatial resolution
Science highlights these filaments are so cold that observa- which corresponds well to the typical
tions at submillimetre wavelengths by the sizes of nearby protostellar envelopes
The range of science targets observed LABOCA camera at APEX are needed to (~ 10 000 au). The Orion A and B giant
during the 13 years of LABOCA opera- detect their faint glow. In order to better molecular clouds have been studied
tions is very wide. In the Solar System understand this process, Hacar et al. most extensively, with a total coverage
many asteroids were observed, including (2013) used LABOCA to study the Barnard of 5.2 square degrees. This includes the
a time-coordinated campaign with 211/213 region in Taurus, a prototypical Orion Nebula region with the famous
Herschel and Planck to determine their star-forming filament for this type of study. “Integral Shaped Filament”, the L1641
variability and suitability as calibrators. cloud to its south, and NGC2023,
Within our Galaxy, LABOCA observed The iconic LABOCA map of the Barnard NGC2024, Ori B9, NGC2068, NGC2071
debris discs, envelopes around stars, 211/213 region (Figure 3) exemplifies the and L1622 in the Orion B cloud. Data
massive stars and even the entire Galactic complex interplay between cloud struc- reduction was optimised to recover as
plane observable from Chajnantor under ture and the origin of stars. In this image, much of the extended emission as possi-
the APEX Telescope Large Area Survey of two newborn stars are recognisable as ble (it tends to be filtered out by sky-noise
the GALaxy (ATLASGAL). In extragalactic bright spots highlighted by the glowing removal), while maintaining excellent sen-
astronomy, LABOCA contributed to the warm dust around them. A series of addi- sitivity in the compact sources. Figure 4
study of dust in nearby galaxies, and gal- tional starless condensations indicate the shows an overview of the entire survey
axy clusters using the Sunyaev Zel’dovich presence of dense cores on the verge of area in the middle, and two close-ups of
effect. At high redshift, LABOCA made collapsing to form yet more stars. Con- NGC 2071/2068 and the Orion A giant
optimal use of the aforementioned fact necting these cores and stars, LABOCA molecular cloud.
also detects the fainter dust emission
Figure 5. A subsection of the 870-µm ATLASGAL of the cloud extending over more than Together with more targeted, smaller-field
data shows up in red, while the background blue 10 light-years. For the first time, the SABOCA mapping, the LABOCA Orion
image is from the Spitzer Space Telescope as part enhanced sensitivity of this LABOCA survey data provided submillimetre pho-
of the 3.6-µm Galactic Legacy Infrared Mid-Plane
Survey Extraordinaire. The fainter extended red
image, comparable in quality to similar tometry for more than 300 protostar can-
structures come from complementary observations space observations obtained by Herschel, didates, identified from Spitzer thermal
made by the Planck satellite. revealed the internal structure of this par- infrared imaging. These data were essen-
tial in determining the reservoir of gas
that is still available in the protostars’ cold
envelopes for accretion onto their central
star and disc. Together with a Herschel
survey using the Photodetector Array
Camera and Spectrometer (PACS) at 70,
100, and 16 μm — the Herschel Orion
Protostar Survey (HOPS) — spectral
energy distributions were obtained over
the full infrared to submillimetre regime
(Furlan et al., 2016); this included a sam-
ple of protostars that were actually too
cold to be detected by Spitzer, which
were found serendipitously in the Herschel
maps (Stutz et al., 2013) and included
in the LABOCA wide-field maps. This
The Messenger 181 – Quarter 3 | 2020 11Instrumentation Lundgren A. et al., An Era Comes to an End: The Legacy of LABOCA at APEX
6.0
5.4
– 28°59ಿ00ೀ – 28°59ಿ00ೀ – 28°59ಿ00ೀ
4.8
Declination (J2000)
Declination (J2000)
Declination (J2000)
4.2
Flux density (Jy)
– 29°00ಿ00ೀ – 29°00ಿ00ೀ – 29°00ಿ00ೀ 3.6
3.0
2.4
01ಿ00ೀ 01ಿ00ೀ 01ಿ00ೀ 1.8
1.2
Beam Beam Beam 0.6
02ಿ00ೀ 02ಿ00ೀ 02ಿ00ೀ 0.0
17 45 45
h m s
40 s
35 s
17 45 45
h m s
40s
35 s
17 45 45
h m s
40s
35 s
Right ascension (J2000) Right ascension (J2000) Right ascension (J2000)
Figure 6. Data reduction process for the LABOCA catalogue of compact clumps extracted ATLASGAL data with spectroscopic
campaigns. All maps show the innermost
from the ATLASGAL images was recog- observations to derive distances and with
3.5 × 3.5 arcminutes. Left: a single measurement
map of the Galactic centre from a typical observa- nised as the best, least biased, and most existing infrared surveys, Urquhart et al.
tion. Centre: model of the extended submillimetre representative database from which to (2018) could draw a detailed picture of
emission from the Galactic centre: co-added maps extract a suitable sample for follow-up the changes in physical properties (tem-
with subtracted point source at the position of SgrA*.
spectroscopic observations in molecular perature, luminosity, onset of star forma-
Right: remaining map after subtracting the model
from the data. The point-like source represents the lines to characterise the physical and tion) during the early evolution of high-
submillimetre emission from SgrA* itself (Subroweit chemical conditions of dense molecular mass protostars and proto-clusters. These
et al., 2017). clumps associated with high-mass star results are based on a complete sample of
formation over a wide range of evolution- ~ 8000 dense clumps, the largest sample
arguably makes HOPS protostars the ary states (Foster et al., 2011). This cata- of submillimetre dense clumps with relia-
largest and best characterised protostar logue was also ideal for drawing up a ble distance estimates to date.
sample in a single star-forming region sample of massive dense clumps for
(Fischer et al., 2017). high-spatial-resolution (down to 0.06 pc)
follow-up observations with ALMA Time-domain science
(Csengeri et al., 2017). The Search
ATLASGAL for high-mass Protostars with ALMA One of the strengths of APEX is its con-
Revealed up to Kiloparsec Scales project siderable scheduling flexibility, which
The ATLASGAL survey (Schuller et al., (SPARKS) is now delivering its first makes it optimal for monitoring cam-
2009) is the single most successful APEX results. Finally, by complementing the paigns. LABOCA has observed several
large programme with nearly 160 associ-
ated science papers1 receiving over 4600
citations. The legacy of this survey will
continue, thanks to the reduced data
products publicly available through ESO
Phase 3 data 2, catalogue release3 and
the ATLASGAL Database Server4.
Figure 7. This image
The ATLASGAL maps cover an area of shows a colour compos-
sky 140 degrees long and 3 degrees ite image of the radio
wide. ATLASGAL complements observa- galaxy NGC 5128, aka
Centaurus A, revealing
tions from ESA’s Planck and Herschel
the lobes and jets ema-
satellites. The combination of the Planck nating from the active
and APEX data allowed astronomers to galaxy’s central black
add information on the diffuse emission hole. This is a compos-
ite of images obtained
across the survey area and to estimate
with three instruments,
the fraction of dense gas in the inner operating at 870 µm
Galaxy (Csengeri et al., 2016). The (LABOCA: orange), in
ATLASGAL data were also used to create X-rays (Chandra X-ray
Observatory: blue) and
a complete census of cold and massive
in visible light (Wide
clouds where new generations of stars Field Imager [WFI] on
are forming. the MPG/ESO 2.2-m tel-
escope at La Silla); it
shows the stars and the
The ATLASGAL project has led to a sus-
galaxy’s characteristic
tained flow of follow-up projects using dust lane in close to
ALMA and many other telescopes. The “true colour”.
12 The Messenger 181 – Quarter 3 | 2020Figure 8. The image on the left shows the LABOCA – 27°30ಿ00ೀ 10
map of the ECDFS with 122 sources detected (Weiß
et al., 2009). This map illustrates the source-finding
capabilities of LABOCA, which allowed deeper and
– 27°40ಿ00ೀ
higher-resolution ALMA follow-up observations (see
Declination (J2000)
5
the 44 x 44-arcsecond images on the right, from
Hodge et al., 2013 and Karim et al., 2013).
mJy/b
– 27°50ಿ00ೀ
classes of objects that show significant 0
variability in their submillimetre contin- – 28°00ಿ00ೀ
uum, such as gamma-ray bursts (for
example, de Ugarte Postigo et al., 2012),
blazars (Fuhrmann et al., 2014) and 3 h33 m00 s 00 s
Right ascension (J2000)
supermassive black holes.
– 27°30ಿ00ೀ
The Galactic centre was monitored over
eight epochs between 2008 and 2014
in a coordinated campaign with the – 27°40ಿ00ೀ
NAOS–CONICA instrument (NACO) on 5
Declination (J2000)
ESO’s VLT. The data show observational
σ = 0.24 mJy σ = 0.28 mJy
S/N
evidence that, together with theoretical – 27°50ಿ00ೀ
modelling, supports the idea that the
SgrA* synchrotron flare spectra are opti- 0
cally thin in the near-infrared and peak in – 28°00ಿ00ೀ
the 350-GHz range (Eckart et al., 2012
and references therein; see Figure 6).
3 h33 m00 s 00 s
Subroweit et al. (2017) performed a sta- Right ascension (J2000)
σ = 0.29 mJy σ = 0.22 mJy
tistical analysis of the variable 100- and
345-GHz flux densities of Sgr A* and find
that both flare flux density distributions of technology development until the first LABOCA ECDFS Submillimetre Survey
are well described by power laws with an (sub)millimetre maps of nearby starburst
index around 4. Using a plasmon model galaxies became available which showed The flagship extragalactic project during
to explain the flares one can constrain the distribution of gas and its relation to the first years of LABOCA was a deep
the important model parameters: the ini- the nuclear activity in infrared-bright sys- survey of the Extended Chandra Deep
tial synchrotron turnover frequency of tems such as M82 and NGC253 (Krugel Field South (ECDFS), producing 34 papers
the flare source components and their et al., 1990). LABOCA, with its large field which have received more than 3000 ci-
expansion velocity is mostly above of view and high sensitivity submillimetre tations. Such a survey was foreseen in
100 GHz and below a velocity value of maps, was finally sensitive enough to also the science justification of APEX itself.
0.01 c (Eckart et al., 2012). study the cold dust in the discs of nearby An investment of 320 hours of the best
galaxies, which are often ~ 20–30 times weather conditions (precipitable water
Time-domain science carried out by fainter than active nuclear regions but vapour, PWV < 1 mm) effectively monop-
Dharmawardena et al. (2020) using carry comparable amounts of dust. olised this range in Local Sidereal Time
LABOCA archival data of Betelgeuse, in for the first two years of LABOCA opera-
combination with more recent SCUBA-2 Figure 7 shows one of the first high-fidelity tions, but the yield was enormous. The
data, showed that its submillimetre lumi- LABOCA images of Centaurus A (Weiß LABOCA ECDFS Submillimetre Survey
nosity has dimmed by about 20% during et al., 2008) combined with optical data (LESS; Weiß et al., 2009; Smail, Walter &
its optical minimum. taken with the MPG/ESO 2.2-m telescope LESS Consortium, 2009) was the largest
and X-ray data observed with Chandra uniform extragalactic survey of its time,
(Kraft et al., 2000). It reveals not only covering a region the size of the full Moon.
Nearby active galaxies emission from cold dust associated with The final map, shown in Figure 8, is avail-
the prominent dust absorption lanes, but able from the ESO Phase 3 interface5.
In the 1970s, the first observations of the also the synchrotron emission from the The observing mode and data reduction
(sub)millimetre continuum emission in radio jets emerging from the accreting procedures developed for LESS have be-
nearby galaxies showed the importance supermassive black hole at the centre of come the standard for all deep extraga-
of this wavelength regime for studying Centaurus A. The LABOCA observations lactic mapping projects with LABOCA.
optically thin emission from cold dust in show that material in the jet is travelling at On the science side, the LESS map set
galaxies and the variability of synchrotron about half the speed of light. This image a new standard — the follow-up of the
emission in active galactic nuclei (for has become a textbook example in jour- 120 sources in the map was the founda-
example, Hildebrand et al., 1977; Elias et nals and the media to illustrate high- tion for one of the highest-impact pro-
al., 1978). It took about another decade energy phenomena in galaxies. jects when ALMA entered operations in
The Messenger 181 – Quarter 3 | 2020 13Instrumentation Lundgren A. et al., An Era Comes to an End: The Legacy of LABOCA at APEX
Proto-cluster SPT2349-56 at z = 4.3 revealed that it coincided with another
– 56°36ಿ
– 56°38ಿ00ೀ triple-lensed system. A quick follow-up
APEX LABOCA 870 μm ALMA 870 μm
with the Green Bank Telescope deter-
mined a redshift of z = 2.3 for this source,
38ಿ10ೀ
– 37ಿ
the first time this was done using a blind
CO search. This system, magnified ~ 32
Declination (J2000)
Declination (J2000)
MC times, was dubbed the “Cosmic Eyelash”
-L
– 38ಿ20ೀ MW
– 38ಿ because of its shape and proximity to the
Cosmic Eye (Swinbank et al., 2010). It
– 38ಿ30ೀ provided, thanks to a string of DDT pro-
– 39ಿ posals, a first insight into the kinematics,
chemistry and interstellar medium prop-
– 38ಿ40ೀ
erties of a high-redshift star-forming gal-
– 40ಿ axy at the spatial resolution and signal-to-
– 38ಿ50ೀ noise which would take another 5+ years
23 h49 m50 s 40 s 30 s 23 h49 m45 s 44 s 43 s 42s 41s
Right ascension (J2000) Right ascension (J2000)
for ALMA to match. At the time of discov-
ery, the Cosmic Eyelash was the only
Proto-cluster distant red core at z = 4.0 high-redshift source sufficiently bright to
use to commission instruments aboard
APEX LABOCA 870 μm ALMA 2 mm Herschel.
– 33°38ಿ
This chance discovery was possible
– 40ಿ H – 33°44ಿ00ೀ thanks to LABOCA’s wide field of view
Declination (J2000)
Declination (J2000)
D E
– 42ಿ
and it became the prototype of the popu-
A lation of lensed submillimetre galaxies.
– 44ಿ C F
These distant objects can be studied in
B – 43ಿ30ೀ unprecedented detail thanks to the gravi-
G
– 46ಿ tational magnification that boosts the
total intensity and allows their intrinsic
– 48ಿ structure to be resolved.
– 43ಿ00ೀ
– 50ಿ While the Cosmic Eyelash was a chance
0 h42m45 s 42m30 s 42m15 s 42m00 s 0 h42m21s 22s 23 s 24 s 25 s 26 s
Right ascension (J2000) Right ascension (J2000)
discovery, LABOCA would soon start
playing a crucial role in a systematic
Figure 9. Top: LABOCA 870-μm image of the SPT (dotted green circle). Additional ALMA data show that search and characterisation of this popu-
2349-56 system at redshift z = 4.304 overlaid with the northern LABOCA source is also part of this sys-
lation of lensed dusty star-forming galax-
the ALMA coverage towards the southern LABOCA tem (Hill et al., 2020). Bottom: same presentation for
source (black contour; the white contour is the 4σ the distant red core at z = 4.002 with the ALMA foot- ies selected using wide-field surveys with
LABOCA signal-to-noise ratio; Miller et al., 2018). At print shown as grey contour. The ALMA 2-mm contin- the Herschel Space Observatory and the
top right is the ALMA 3 pointing mosaic of the high- uum shows that the distant red core consists of South Pole Telescope (SPT). The high
spatial-resolution 870-μm continuum emission 10 (U)LIRGs at the same redshift. In addition to the
sensitivity and sharper spatial resolution
underlying the [CII] emission line that identifies 21 protocluster core the LABOCA image reveals an over-
individual galaxies as members of this protocluster. density of submillimetre galaxies (SMGs) in the vicin- of LABOCA were critical to providing
The core of the protocluster contains 15 (Ultra) Lumi- ity of the distant red core that may also be part of this complementary 870-µm photometry and
nous InfraRed Galaxies, (U)LIRGs, with a projected structure (Oteo et al. 2018; Lewis et al. 2018; Ivison et separating them into point-like strongly
separation equal to the MW–LMC distance only al., 2020).
lensed high-redshift galaxies and proto-
clusters which are typically spatially
2012 (Swinbank et al., 2012). Imaging the Gravitationally lensed dusty star- extended with LABOCA. LABOCA ena-
LESS sources at much higher spatial res- forming galaxies bled the discovery of the most distant
olution was one of the first projects under- objects in both of these categories
taken when ALMA entered science opera- One of the most unexpected discoveries (Strandet et al., 2017; Miller et al., 2018;
tions (Hodge et al., 2013). The redshift de- made with LABOCA happened in May and Oteo et al., 2018).
termination and study of the properties of 2009, while observing a lensed z = 3 gal-
the 120 LESS sources are still ongoing axy called the “Cosmic Eye”. While the
using the VLT, ALMA (Danielson et al., source remained undetected, the obser- LABOCA in numbers
2017; Wardlow et al., 2018) and soon vation showed a bright 100-mJy source
using the JWST. It took SCUBA-2 at the about 1 arcminute away. The observer A total of 596 LABOCA proposals have
JCMT over a decade to cover an area (one of the authors of this paper) first sus- been approved for scheduling by the
10 times wider than LESS to comparable pected this was due to an error in the proposal committees in Sweden, Chile,
depth, while ALMA’s largest areas are pointing model because of a recent inter- MPIfR and ESO, of which 327 are associ-
< 10% those of LESS. vention. However, further investigation ated with datab. Based upon one or more
14 The Messenger 181 – Quarter 3 | 2020You can also read