The Protein-Protein Interaction Network of Hereditary Parkinsonism Genes Is a Hierarchical Scale-Free Network
←
→
Page content transcription
If your browser does not render page correctly, please read the page content below

Original Article
Yonsei Med J 2022 Aug;63(8):724-734
https://doi.org/10.3349/ymj.2022.63.8.724 pISSN: 0513-5796 · eISSN: 1976-2437
The Protein-Protein Interaction Network
of Hereditary Parkinsonism Genes Is
a Hierarchical Scale-Free Network
Yun Joong Kim1,2, Kiyong Kim3, Heonwoo Lee4, Junbeom Jeon4, Jinwoo Lee4, and Jeehee Yoon4
1
Department of Neurology, Yonsei University College of Medicine, Seoul;
2
Department of Neurology, Yongin Severance Hospital, Yonsei University Health System, Yongin;
3
Department of Electronic Engineering, Kyonggi University, Suwon;
4
Department of Computer Engineering, Hallym University, Chuncheon, Korea.
Purpose: Hereditary parkinsonism genes consist of causative genes of familial Parkinson’s disease (PD) with a locus symbol prefix
(PARK genes) and hereditary atypical parkinsonian disorders that present atypical features and limited responsiveness to levodopa
(non-PARK genes). Although studies have shown that hereditary parkinsonism genes are related to idiopathic PD at the phenotyp-
ic, gene expression, and genomic levels, no study has systematically investigated connectivity among the proteins encoded by
these genes at the protein-protein interaction (PPI) level.
Materials and Methods: Topological measurements and physical interaction enrichment were performed to assess PPI networks
constructed using some or all the proteins encoded by hereditary parkinsonism genes (n=96), which were curated using the On-
line Mendelian Inheritance in Man database and literature.
Results: Non-PARK and PARK genes were involved in common functional modules related to autophagy, mitochondrial or lyso-
somal organization, catecholamine metabolic process, chemical synapse transmission, response to oxidative stress, neuronal
apoptosis, regulation of cellular protein catabolic process, and vesicle-mediated transport in synapse. The hereditary parkinson-
ism proteins formed a single large network comprising 51 nodes, 83 edges, and three PPI pairs. The probability of degree distribu-
tion followed a power-law scaling behavior, with a degree exponent of 1.24 and a correlation coefficient of 0.92. LRRK2 was iden-
tified as a hub gene with the highest degree of betweenness centrality; its physical interaction enrichment score was 1.28, which
was highly significant.
Conclusion: Both PARK and non-PARK genes show high connectivity at the PPI and biological functional levels.
Key Words: Parkinson’s disease, hereditary parkinsonian disorder, causative gene, protein-protein interaction, LRRK2
Received: March 15, 2022 Revised: April 19, 2022 INTRODUCTION
Accepted: May 2, 2022
Co-corresponding authors: Yun Joong Kim, MD, PhD, Department of Neurology, More than 20 causative genes/loci showing Mendelian inheri-
Yonsei University College of Medicine, Yongin Severance Hospital, Yonsei Universi- tance have been shown to be associated with familial Parkin-
ty Health System, 363 Dongbaekjukjeon-daero, Giheung-gu, Yongin 16995, Korea.
Tel: 82-31-331-8712, Fax: 82-31-331-8709, E-mail: yunjkim@yuhs.ac and
son’s disease (PD), and these genes have been assigned a locus
Kiyong Kim, PhD, Department of Electronic Engineering, Kyonggi University, 154-42 symbol prefix, “PARK”.1 In hereditary atypical parkinsonian
Gwanggyosan-ro, Yeongtong-gu, Suwon 16227, Korea. disorders, also known as heredodegenerative parkinsonian
Tel: 82-31-249-1507, Fax: 82-31-244-6300, E-mail: eye4eye@kyonggi.ac.kr
disorders, parkinsonism is either concomitant or predomi-
•The authors have no potential conflicts of interest to disclose. nant with other phenotypes of movement disorders, and the
© Copyright: Yonsei University College of Medicine 2022 causative genes are not assigned the PARK prefix (non-PARK
This is an Open Access article distributed under the terms of the Creative Com- genes). Typically, PARK genes are considered as Mendelian
mons Attribution Non-Commercial License (https://creativecommons.org/licenses/
by-nc/4.0) which permits unrestricted non-commercial use, distribution, and repro- genes in PD because their mutations are associated with key
duction in any medium, provided the original work is properly cited. features of idiopathic PD, including levodopa-responsiveness;
724 www.eymj.org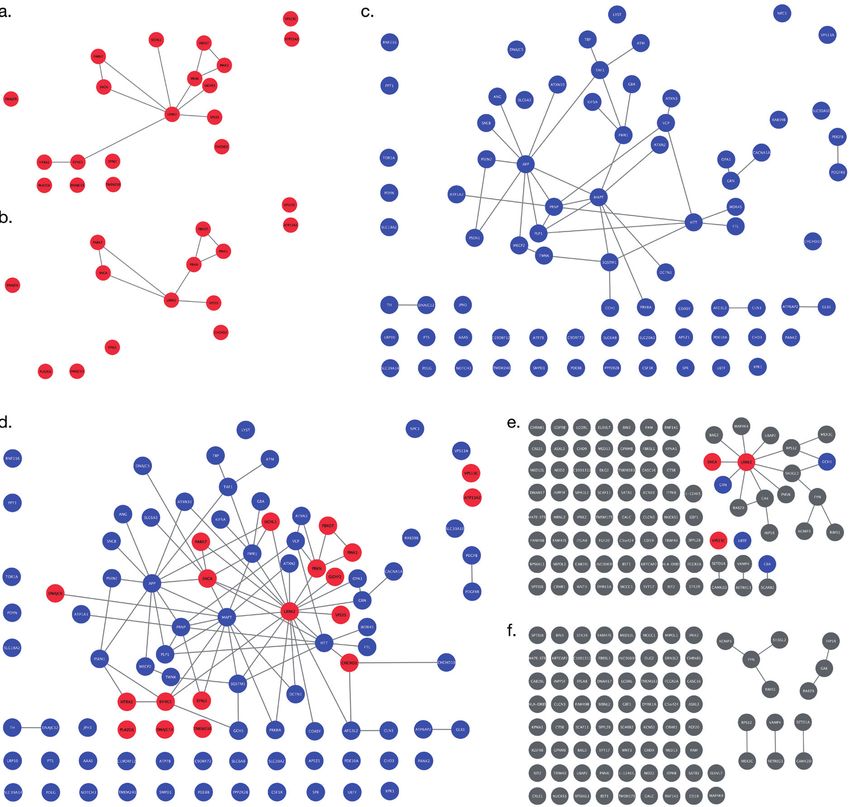
Yun Joong Kim, et al.

whereas, in cases with non-PARK gene mutations, either no                      show a higher likelihood of physical interactions among their
response or a transient response to levodopa is observed. Re-                  products. Given that both PARK and non-PARK genes share the
cent studies have shown that non-PARK genes are related to                     parkinsonism phenotype, we speculate that their encoded pro-
idiopathic PD at the phenotypic, gene expression, and genomic                  teins may interact often and may be involved in the same func-
levels.2-4 However, to date, no study has investigated the con-                tional modules of PD pathogenesis.
nectivity between PARK and non-PARK genes at the protein-                         Here, we systematically curated PARK and non-PARK genes
protein interaction (PPI) level.                                               and performed functional annotation analyses to explore func-
   PPIs are pivotal for the proper functioning of a biological                 tional and physical connectivity between the hereditary parkin-
system. Understanding PPIs can help in predicting the biolog-                  sonism genes. We also analyzed PPINs between PARK and
ical functions of a protein and improving the characterization                 non-PARK proteins and showed that hereditary parkinsonism
of pathways or functional modules.5 A PPI network (PPIN) can                   genes are highly connected in a hierarchical scale-free network.
be used to identify novel drugs and new disease-related genes,
subnetworks, and molecular mechanisms.6 Although PPINs
have been used to explore PD-related functional pathways and                   MATERIALS AND METHODS
discover novel genes, no study has investigated the relation-
ship between PARK and non-PARK genes.7-9 Moreover, no                          Constructing gene sets
study has systematically analyzed PPINs formed by proteins                     A custom gene set of hereditary parkinsonism genes, consist-
encoded by all PARK and non-PARK genes. Meanwhile, Goh,                        ing of 96 causative genes for Mendelian disorders with a par-
et al.10 applied graph theory to Mendelian genes and disorders                 kinsonism phenotype, was constructed via manual curation
from the Online Mendelian Inheritance in Man (OMIM) data-                      from the OMIM database11 and previous studies2,4 (Table 1
base and suggested that genes associated with similar disorders                and Supplementary Table 1, only online). We also included

Table 1. List of Genes in the Hereditary Parkinsonism Gene Set
             Gene sets                                                                    Genes
     Hereditary      PARK genes         SNCA, UCHL1, EIF4G1, VPS35, PARK7, PRKN, PLA2G6, SYNJ1, FBXO7, HTRA2, PINK1, DNAJC6, VPS13C, LRRK2,
    parkinsonism         (n=19)          ATP13A2, GIGYF2, DNAJC13, CHCHD2, TMEM230
    genes (n=96)       Non-PARK         PSEN1, APP, ANG, SLC6A3, PDYN, FTL, GRN, MAPT, SLC20A2, CSF1R, PDGFRB, POLG, PRNP, SPR, ATP1A3, PDGFB,
                            genes        TH, SLC18A2, MECP2, SLC6A8, PLP1, WDR45, ATP6AP2, RAB39B, FMR1, TAF1, TBP, GCH1, NOTCH3, UBTF, PPT1,
                            (n=77)       PSEN2, CACNA1A, VCP, DCTN1, ATXN2, SQSTM1, CHD3, SNCB, KIF5A, PDE8B, PRKRA, PPP2R2B, AFG3L2, TOR1A,
                                         XPR1, JPH3, OPA1, AAAS, VPS13A, DNAJC12, TWNK, PANK2, GBA, ATP7B, LYST, CLN3, ATXN3, ATM, SMPD1,
                                         NPC1, SLC39A14, COASY, LRP10, RNF216, PDE10A, SLC30A10, DNAJC5, GLB1, PTS, HTT, AP5Z1, C9orf72, C19orf12,
                                         CHCHD10, TMEM240, ATXN10
          PD-related genes              GRN, SNCA, GCH1, UBTF, DYRK1A, SCARB2, GBA, GALC, VPS13C, LRRK2, MCCC1, ASXL3, BAG3, BIN3, BST1,
       from meta-GWAS (n=86)             C5orf24, CAB39L, CAMK2D, CASC16, CD19, CHD9, CHRNB1, CLCN3, CRHR1, CRLS1, CTSB, DEG2, DNAH17, EL0VL7,
                                         FAM47E, FAM47E-STBD1, FAM49B, FBRSL1, FCGR2A, FGF20, FYN, GAK, GBF1, GPNMB, GS1-124K5.11, HIP1R, HLA-
                                         DRB5, IGSF9B, INPP5F, IP6K2, ITGA8, ITPKB, KCNIP3, KCNS3, KPNA1, KRTCAP2, LCORL, LINC00693, LOC100131289,
                                         MAP4K4, MBNL2, MED12L, MED13, MEX3C, MIP0L1, NOD2, NUCKS1, PAM, PMVK, RAB29, RETREG3, RIMS1, RIT2,
                                         RNF141, RPS12, RPS6KL1, SATB1, SCAF11, SETD1A, SH3GL2, SIPA1L2, SPPL2B, SPTSSB, STK39, SYT17, TMEM163,
                                         TMEM175, TRIM40, UBAP2, VAMP4, WNT3
          AD-related genes              ABCA7, ABI3, ACE, ADAM10, ADAMTS1, ADAMTS4, AGFG2, ALPK2, AP4M1, APH1B, APOC1, APOC2, APOC4, APOE,
       from meta-GWAS (n=129)            BCAM, BCKDK, BCL3, BCL7C, BIN1, BTNL2, BZRAP1, C14orf93, C1orf116, C6orf10, CASS4, CBLC, CCDC6, CD2AP,
                                         CD33, CD3EAP, CEACAM16, CEACAM19, CEACAM20, CELF1, CHRNA2, CKM, CLASRP, CLNK, CLPTM1, CLU, CNN2,
                                         CNTNAP2, CR1, CR1L, CSTF1, CYB561, DEDD, ECHDC3, EED, ENAH, EPHA1, ERCC1, ERCC2, EXOC3L2, FBXL19,
                                         FERMT2, GATS, GEMIN7, GPC2, GPR141, HESX1, HLA-DQA1, HLA-DRA, HLA-DRB1, ICA1L, IGSF23, IL34, INPP5D,
                                         IQCK, KAT8, KLC3, MARK4, MEF2C, MINDY2, MS4A2, MS4A3, MS4A4A, MS4A4E, MS4A6A, MS4A6E, NECTIN2,
                                         NKPD1, NYAP1, OARD1, PICALM, PILRA, PLCG2, PLCH1, PLD3, PPP1R37, PRL, PSMC3, PTK2B, PVR, PVRIG, PVRL2,
                                         RAB8B, RABEP1, RELB, RP11-81K2.1, SCARA3, SCIMP, SLC24A4, SLC39A13, SLTM, SORL1, SPI1, SPPL2A, STAG3,
                                         STYX, TAOK2, TMEM184A, TOMM40, TRAPPC6A, TREM2, TREML2, UNC5CL, USP6, USP6NL, WDR12, WIPI2, WWOX,
                                         ZCWPW1, ZFP3, ZKSCAN1, ZNF232, ZNF646, ZNF652, ZYX
Parkinson’s disease (PD)-related genes and Alzheimer’s disease (AD)-related genes were acquired from the meta-analysis of genome-wide association studies
(meta-GWAS): PARK genes indicate causative genes of familial PD with a locus prefix symbol, “PARK.” Non-PARK genes indicate causative genes of hereditary
atypical parkinsonian disorders accompanied by atypical features. Gene/locus Mendelian Inheritance in Man (MIM) number and phenotype MIM number for indi-
vidual genes are shown in Supplementary Table 1 (only online).

https://doi.org/10.3349/ymj.2022.63.8.724                                                                                                           725
Protein Interaction Networks of Parkinsonism Genes

DNAJC13, TMEM230, LRP10, and ATXN10,4 which are recently             lecular interaction data.17,18 An MITAB file is a tab-delimited
reported genes. Albeit somewhat controversial, DNAJC13 and           text file wherein each row represents one interaction between
TMEM230 have been assigned to the PARK21 loci [Mendelian             two proteins, reporting the features of the interaction and the
Inheritance of Man (MIM) number: %616361]. LRP10 has                 PubMed identifier. Uniprot protein identifiers were mapped to
been reported in cases with familial PD and dementia with            HGNC gene symbols using the human proteome annotation
Lewy bodies, although no PARK locus has been assigned for it.        table downloaded from Uniprot (https://www.uniprot.org/
ATXN10 mutations present with levodopa-responsive parkin-            uniprotkb?facets=model_organism%3A9606&query=Human;
sonism with presynaptic loss of dopamine, as documented with         accessed on 2020-09-01). This translation ensured that each
99m
   Tc-TRODAT-1 SPECT.12 The final gene set consisted of 19           protein was mapped to a unique gene symbol. Next, the PPI an-
PARK genes and 77 non-PARK genes. Genes with more than               notations underwent quality control and filtering, as previously
two OMIM phenotype IDs, such as assignment of PARK loci and          described.8,12 Briefly, all non-human TaxID annotations, all
hereditary atypical parkinsonian disorders (e.g., ATP13A2 and        annotations with non-assigned interaction detection methods
PLA2G6), were categorized as PARK genes. For comparison,             or PubMed identifiers, all annotations with generic specifica-
a gene set of PD risk genes (n=86 in 90 loci) was sourced from       tions, and all proteins whose transcripts were not expressed in
a meta-analysis of a genome-wide association study (meta-            the brain (https://www.proteinatlas.org/humanproteome/
GWAS),13 and a gene set of Alzheimer’s disease (AD) risk genes       brain/human+brain) were removed. Then, a threshold was de-
(n=129) was constructed based on recent meta-GWAS.14 The             termined, and the filtered interactions were scored by evaluat-
AD gene set included genes that were nearest to the GWAS loci,       ing the number of publications and detection methods report-
had rare variant association, or documented gene-based asso-         ing an interaction. A final score (number of PubMed IDs+
ciation in AD. Genes expressed in the central nervous system         number of methods) was calculated, and a score ≥2 was con-
were derived from the Human Protein Atlas.15                         sidered. We referred to this quality-controlled PPI network as
                                                                     “Human_brain_PPI.” The Human_brain_PPI network con-
Gene ontology analysis                                               tained 200398 interactions with a score ≥2 between 14326 pro-
To identify the biological processes enriched in the hereditary      teins and 55582 interactions with a score ≥3 between 9688 pro-
parkinsonism genes, we used g:Profiler, a web-based gene             teins. Here, we used Human_brain_PPI with an interaction
ontology (GO) analysis tool16 (archive: Ensembl 100, Ensembl         score ≥2 as the general PPI network. Next, we constructed sub-
Genomes 47, rev f46603d; database built on 2020-09-21). For          networks by including all protein interactions from the gene
functional annotation, we compared the enrichment results of         sets of all hereditary parkinsonism genes, PARK genes, non-
all hereditary parkinsonism genes, only PARK genes, and only         PARK genes, PD risk genes, and AD risk genes. In the heredi-
non-PARK genes with each other. The g:Profiler settings used         tary parkinsonism gene network, encoded proteins were
were as follows: GO enrichment restricted to biological pro-         identified as “seeds” and their interactions as undirected edges.
cesses (GO-BP), Fisher’s one-tailed test as the statistical meth-    We also built an extended network that comprised the seed
od, Bonferroni correction for multiple testing correction, statis-   proteins, their direct neighboring proteins, and the PPIs be-
tical domain size comprising only annotated genes, and no            tween them.
hierarchical filtering. Bonferroni corrected p1000 genes.             as the sum of the fraction of the shortest paths that pass through
                                                                     a node and measures how often a node acts as a “bridge” along
Construction of PPINs for the hereditary                             the shortest paths between two other nodes. A node with a
parkinsonism genes                                                   high BC denotes a bottleneck node that has greater control
For constructing PPINs, only direct PPIs of human proteins           over a network than a node with low BC. The CC of a node, a
were downloaded as an MITAB 2.5 file from the IntAct data-           measure of network centrality, is defined as the reciprocal of
base17 (accessed on 2020-08-27) using the PSICQUIC platform          the sum of the shortest paths from a node to all other nodes in
(http://www.ebi.ac.uk/Tools/webservices/psicquic/view/               the network. Since the sum of the distances depends upon the
main.xhtml). The IntAct database is one of the most compre-          number of nodes in a network, closeness is normalized by the
hensive databases in terms of number of PPIs, species, and mo-       total number of nodes in a network. A node with higher CC is

726                                                                                                 https://doi.org/10.3349/ymj.2022.63.8.724
Yun Joong Kim, et al.
closer to other nodes and is more central in the network. Final- (n=175 GO-BP terms) or non-PARK genes (n=90 GO-BP terms),
ly, the clustering coefficient of a node is the fraction of the pair wherein 24 GO-BP terms were commonly enriched in both
of a node’s neighbors that are adjacent to each other. A node PARK and non-PARK genes. GO-BP terms with significant en-
with a high clustering coefficient has a small “world,” and its richment only in PARK genes also included non-PARK genes
neighbors are closer to each other. and vice versa. In total, 121 of 175 (69.1%) GO-BP terms en-
Global topological measurements of a network include aver- riched in PARK genes included non-PARK genes, and 77 of 90
age degree (), which is the mean of all degrees in a network; (85.6%) GO-BP terms enriched in non-PARK genes included
diameter (D), which is the maximum shortest path length be- PARK genes. When all hereditary parkinsonism genes (both
tween a pair of nodes in a network; mean shortest path length PARK and non-PARK genes combined) were analyzed, gene
(mspl), which is the average of the path distances required to set enrichment analysis revealed an additional 62 significantly
connect every pair of nodes via their shortest path and indi- enriched GO-BP terms, which were not enriched in the analy-
cates the network’s overall connectedness; and average clus- ses using PARK gene or non-PARK genes only.
tering coefficient (acc), which is the normalized sum of all the The enriched GO-BP terms could be categorized into the
clustering coefficients of individual nodes and indicates the lo- following functional semantic clusters: 1) autophagy/cellular
cal interconnectedness of a network. According to the Watts and catabolic processes, 2) mitochondria or lysosome organiza-
Strogatz model,21 a network is referred to as a “small-world net- tion, 3) dopamine- or catecholamine-containing compound
work” if it has a high clustering coefficient and a low mspl. metabolic processes, 4) synapse organization and chemical
synaptic transmission, 5) response to oxidative stress, 6) neu-
Calculation of physical interaction enrichment ron apoptosis process/neuronal death, 7) regulation of cellu-
Physical cohesiveness of the PPINs was assessed using a PIE lar protein catabolic processes, and 8) transport of lysosomes or
analysis.22 A set of proteins of interest is more functionally co- mitochondria and vesicle-mediated transport in synapse (Table
hesive if it has a higher interaction enrichment in the PPIN. 2 and Fig. 1). Taken together, both PARK and non-PARK genes
However, PPINs show interaction enrichment biases for pro- were involved in common functional modules in the cells.
teins that are often studied. To address this, we utilized the PIE
algorithm described by Sama and Huynen,22 which extracts PPINs of proteins encoded by PARK and non-PARK
random sets of proteins from the general PPINs that have the genes
same node (protein) and edge (interaction) biases as that in a Given that enriched biological processes were shared by PARK
set of proteins of interest. The PIE algorithm then measures and non-PARK genes, we hypothesized that the PPINs formed
whether the proteins in a set of proteins of interest have more by proteins encoded by PARK or non-PARK genes (PARK or
interactions among themselves than with proteins in random non-PARK proteins) were close to each other. We first construct-
sets. The PIE score for randomly chosen proteins is 1.0. In total, ed independent PPINs using PARK, non-PARK, and both
we generated 100000 random protein sets with the same size PARK and non-PARK proteins as the seed proteins (Fig. 2 and
and degree distribution as that in the set of proteins of interest Supplementary Table 3, only online). From a total of 19 PARK
and analyzed the number of interactions in the random sets proteins, 11 proteins formed a single PPIN with 12 PPIs. After
to obtain a frequency distribution. This distribution was used removing five controversial PARK proteins (UCHL1, GIGYF2,
to calculate the physical cohesiveness (PIE score) of the set of HTRA2, EIF4G1, and TMEM230), a single PPIN with seven
proteins of interest and its significance (p-value). All calcula- proteins and eight PPIs was formed (Fig. 2A and B). The PPIN
tions and algorithms were implemented using custom Python of the non-PARK proteins (n=77) consisted of 28 proteins with
scripts. 36 PPIs and small modules, including one PPI trimer and four
PPI pairs (Fig. 2C). The PPIN comprising both PARK and non-
PARK proteins (n=96) consisted of a giant component with 51
RESULTS proteins connected via 83 PPIs and three PPI pairs (Fig. 2D).
Twenty-five (30.1%) of the 83 PPIs in the giant component were
Enriched biological processes shared by PARK and direct interactions between PARK and non-PARK proteins, and
non-PARK genes six proteins in the 25 PPIs were linked to the giant component
To investigate whether the hereditary parkinsonism genes were only when both PARK and non-PARK proteins were used. The
associated with distinct biological processes, we performed probability of degree distribution P(k) of a PPIN follows a pow-
functional annotation and gene set enrichment analyses of all er-law scaling behavior represented by P(k)~k-r, where r is an
hereditary parkinsonism genes (both PARK and non-PARK order parameter. In a hierarchical network (r3.19,23 In the PPIN consisting of PARK and non-PARK
sonism genes (Supplementary Table 2, only online). A total of proteins, the probability of degree distribution P(k) followed a
241 GO-BP terms was significantly enriched in PARK genes power-law scaling behavior, P(k)~k-γ, with degree exponent γ=
https://doi.org/10.3349/ymj.2022.63.8.724 727Table 2. Representative GO Terms of the Enriched BP of PARK Genes, Non-PARK Genes, and All Hereditary Parkinsonism Genes
728
Num-ber of Analysis with
input genes Analysis with Analysis with all hereditary
Functional GO term Population, Population, PARK genes non-PARK genes parkinsonism
represented PARK genes Non-PARK genes
clusters (GO term ID) hits total genes
by a GO
term FE p value FE p value FE p value
Autophagy/ Autophagy (go:0006914) 26 537 18017 ATP13A2, EIF4G1, FBXO7, ATM, C19ORF12, C9ORF72, 21.7 3.81.E-11 6.5 1.09.E-04 9.8 5.76.E-15
regulation of HTRA2, LRRK2, PRKN, CLN3, GBA, HTT, MAPT, NPC1,
cellular catabolic PARK7, PINK1, SNCA, UCHL1, PSEN1, RAB39B, SQSTM1,
processes VPS13C, VPS35 VCP, VPS13A, WDR45
Positive regulation of 19 395 18017 FBXO7, GIGYF2, LRRK2, PRKN, APP, ATM, ATXN3, C9ORF72, 22.1 1.71.E-07 6.3 1.58.E-02 9.7 5.06.E-10
cellular catabolic PARK7, PINK1, SNCA, FMR1, GBA, HTT, PSEN1,
process (go:0031331) VPS13C, VPS35 TAF1, VCP
Negative regulation 12 264 18017 ATP13A2, EIF4G1, HTRA2, FMR1, NPC1, PSEN1, TAF1 29.6 2.64.E-07 ns 9.2 4.41.E-05
of cellular catabolic LRRK2, PARK7, PINK1, SNCA,
process (go:0031330) VPS35
Mitochondria Mitochondrion 22 560 18017 ATP13A2, CHCHD2, FBXO7, AFG3L2, CHCHD10, GBA, HTT, 20.7 6.28.E-11 ns 7.9 2.80.E-10
or lysosome organization HTRA2, LRRK2, PRKN, PARK7, MAPT, OPA1, PANK2,
organization (go:0007005) PINK1, PLA2G6, SNCA, SQSTM1, VPS13A, WDR45
VPS13C, VPS35
Lysosome organization 8 68 18017 LRRK2, VPS35 ATP6AP2, CLN3, GBA, GRN, ns 23.5 1.17.E-03 25.7 8.46.E-06
(go:0007040) LYST, PPT1
Dopamine or Dopamine metabolic 8 39 18017 PRKN, PARK7, SNCA, VPS35 GCH1, SLC6A3, SNCB, TH 108.3 1.49.E-04 ns 49.7 7.95.E-08
catecholamine process (go:0042417)
containing Catechol-containing 8 54 18017 PRKN, PARK7, SNCA, VPS35 GCH1, SLC6A3, SNCB, TH 75.8 5.67.E-04 ns 33.5 1.26.E-06
compound compound metabolic
metabolic process process (go:0009712)
Synapse Synapse organization 17 417 18017 EIF4G1, LRRK2, SNCA, VPS35 AFG3L2, APP, CACNA1A, ns 7.8 4.44.E-05 8.2 1.56.E-07
organization and (go:0050808) CHCHD10, CLN3, DCTN1,
chemical synaptic MAPT, MECP2, OPA1, PRNP,
transmission PSEN1, RAB39B, SNCB
Chemical synaptic 29 694 18017 LRRK2, PRKN, PARK7, PINK1, APP, ATXN3, CACNA1A, CLN3, 9.7 8.61.E-03 7.9 1.03.E-10 8.4 2.18.E-15
transmission PLA2G6, SNCA, SYNJ1 DNAJC5, FMR1, JPH3, KIF5A,
(go:0007268) MAPT, MECP2, PDYN, PLP1,
PPT1, PRNP, PSEN1, RNF216,
SLC18A2, SLC6A3, SNCB,
SQSTM1, TH, TOR1A
Response to Response to oxidative 17 470 18017 ATP13A2, FBXO7, HTRA2, APP, C19ORF12, GCH1, MAPT, 16.4 2.49.E-05 ns 7.2 9.96.E-07
oxidative stress stress (go:0006979) LRRK2, PRKN, PARK7, PDGFRB, PRKRA, PRNP,
PINK1, SNCA PSEN1, TOR1A
Neuron death/ Neuron apoptotic process 16 258 18017 PRKN, PARK7, PINK1, SNCA APP, ATM, CACNA1A, CLN3, ns 11.8 1.93.E-06 12.7 1.11.E-09
neuron apoptosis (go:0051402) DNAJC5, GRN, MECP2, PPT1,
process PRNP, PSEN1, SLC30A10,
SNCB
https://doi.org/10.3349/ymj.2022.63.8.724
Protein Interaction Networks of Parkinsonism GenesYun Joong Kim, et al.
1.24, where a straight line qualified as the fitted curve for the
9.5 9.66.E-07 13.3 1.91.E-16
4.05.E-05
46.0 1.61.E-04 14.3 1.80.E-02 21.9 3.43.E-08
8.2 5.71.E-04
9.4 4.04.E-02 13.1 9.29.E-07
p value
Analysis with
PARK genes non-PARK genes parkinsonism
Analysis with Analysis with all hereditary
data points (P(k)~k-1.24) and correlation coefficient r2=0.92 (Fig.
genes 2G). In contrast, in the PPIN constructed using 86 proteins
encoded by genes associated with risk alleles,13 a single PPIN
9.3
FE
with 17 proteins, 18 PPIs, and three PPI pairs was formed (Fig.
2E). After removing seven proteins that overlapped with PARK
p value
ns
ns
or non-PARK proteins, 13 proteins were connected in small
modules, including three pairs, one trimer, and one tetramer
(Fig. 2F). A comparison of global topological measurements ob-
FE
served between the PPINs formed by PARK and/or non-PARK
26.2 2.00.E-09
22.2 4.34.E-04
21.5 5.18.E-04
25.9 2.54.E-03
p value
proteins is summarized in Supplementary Table 3 (only on-
line). In the PPIN formed by both PARK and non-PARK proteins,
the top five proteins with the highest degree connectivity (k)
FE
were LRRK2, MAPT, APP, HTT, and SNCA (Supplementary Ta-
ble 4, only online). The top five proteins with the highest BC,
PSEN1, SLC18A2, TH, TOR1A
which formed the backbone network,24 were LRRK2, APP,
MECP2, PPT1, PRNP, PSEN1,
HTRA2, LRRK2, PRKN, PARK7, DNAJC5, GBA, GRN, MAPT,
APP, ATM, CACNA1A, CLN3,
ATP13A2, LRRK2, PRKN, PARK7, ATXN3, FMR1, GBA, PSEN1,
ATP13A2, LRRK2, PRKN, PINK1, C9ORF72, CLN3, GRN, LYST,
CACNA1A, DNAJC5, FMR1,
Table 2. Representative GO Terms of the Enriched BP of PARK Genes, Non-PARK Genes, and All Hereditary Parkinsonism Genes (continued)
MAPT, HTT, and FMR1 (Supplementary Fig. 1A, only online).
Non-PARK genes
AFG3L2, CHCHD10, OPA1,
Additionally, we found two cliques comprising four proteins
SLC30A10, SNCB
(LRRK2-SNCA-MAPT-FMR1 and MAPT-APP-PRNP-PLP1),
PSEN1, PSEN2
GO, gene ontology; BP, biological processes; ID, identification; FE, fold enrichment; p-value, Bonferroni corrected p-value; ns, not significant.
where all proteins were connected with each other (Supple-
NPC1, VCP
TAF1, VCP
mentary Fig. 1B, only online). Chemical synaptic transmission
was the common GO-BP term shared by all proteins in both
cliques (Supplementary Table 2, only online). Taken together,
these results suggested that the PPIN formed by both PARK and
FBXO7, HTRA2, LRRK2, PRKN,
non-PARK proteins is a single hierarchical scale-free network,
ATP13A2, EIF4G1, FBXO7,
DNAJC6, LRRK2, SNCA,
PARK genes
where both PARK and non-PARK proteins are hub proteins in-
PINK1, SNCA, VPS35
volved in a backbone network and functional modules (Sup-
SYNJ1, VPS35
PINK1, VPS35
PINK1, VPS35
plementary Fig. 1C, only online).
Next, we constructed an extended PPIN using PARK and non-
VPS35
PARK proteins and their direct interacting neighbor proteins
(first neighbors). This single giant PPIN consisted of 4493 pro-
Population, Population,
teins connected via 75125 PPIs (Supplementary Table 3, only
18017
18017
18017
18017
18017
total
online). As expected, the probability of degree distribution of
the extended PPIN also followed a power-law scaling behav-
ior with γ=1.34 and r2=0.82 (Fig. 2H). The backbone network of
the extended PPIN consisted of the top 1% nodes with the high-
hits
371
262
108
270
188
est BC and included both PARK and non-PARK proteins, in-
cluding LRRK2, APP, PRNP, MAPT, FMR1, HTT, PLP1, DCTN1,
represented
input genes
Num-ber of
VCP, GRN, and SQSTM1 (Supplementary Table 5, only online).
by a GO
term
Next, we calculated the PIE scores and associated p-values
24
12
11
11
12
FE and p-values were calculated for all three gene sets.
for all hereditary parkinsonism proteins, PARK proteins, and
non-PARK proteins, separately (Table 3). The PIE score was sig-
mitochondria and Mitochondrial transport
nificant for PARK and non-PARK proteins, independently. No-
catabolic process process (go:1903362)
transport in synapse
Regulation of cellular
Lysosomal transport
(GO term ID)
tably, the PIE score of both PARK and non-PARK proteins as a
protein catabolic
GO term
Vesicle-mediated
single group was highly significant (p=0.00018), suggesting
(go:0070997)
(go:0007041)
(go:0006839)
(go:0099003)
Neuron death
that these proteins interacted more than randomly expected,
and this cannot be attributed to publication bias. In contrast,
analyses of PIE scores between the PD GWAS proteins and AD
GWAS proteins were not significant. On applying more strin-
vesicle mediated
cellular protein
Functional
gent data curation criteria (quality score ≥3), the results re-
clusters
lysosome or
Regulation of
transport in
mained the same except for PD GWAS proteins (before exclud-
Transport of
synapse
ing PARK and non-PARK proteins), which were marginally
significant (Supplementary Table 6, only online).
https://doi.org/10.3349/ymj.2022.63.8.724 729Protein Interaction Networks of Parkinsonism Genes
Autophagy
Positive regulation of cellular
catabolic process
Negative regulation of
cellular catabolic process
Mitochondrione organization
Familial
Parkinson’s
disease Lysosome organization
(PARK)
Dopamine metabolic process
Catechol-containing
compound metabolic process
Synapse organization
Chemical synaptic
transmission
Response to oxidative stress
Hereditary
atypical
Parkinsonian Neuron apoptotic process
disoders
(non-PARK)
Neuron death
Regulation of cellular protein
catabolic process
Lysosomal transport
Mitochondrial transport
Vesicle-mediated transport
in synapse
Fig. 1. Schematic representation of a tripartite network of hereditary parkinsonian disorders, biological processes, and genes. The first layer repre-
sents two groups of hereditary parkinsonian disorders: familial Parkinson’s disease (PD) associated with PARK genes and hereditary atypical parkin-
sonian disorders caused by mutations in non-PARK genes. The second layer represents the major gene ontology-biological process terms (GO-BP),
which were significantly enriched in either PARK or non-PARK genes. GO-BP terms enriched in PARK genes were connected to the familial PD node,
whereas those enriched in the non-PARK genes were connected to the hereditary atypical parkinsonian disorder node. The third layer represents the
causative genes of hereditary parkinsonian disorders. Nodes and edges of PARK genes are red and those of non-PARK genes are blue.
730 https://doi.org/10.3349/ymj.2022.63.8.724Yun Joong Kim, et al.
A C
B
D E
F
G Scale-free network degree distribution (PARK_Non-PARK PPIN) H Scale-free network degree distribution (PARK_Non-PARK_FIRST PPIN)
-0.6
-0.8 -1
-1.0
-1.2 -2
log(P(k))
log(P(k))
-1.4
-1.6 -3
-1.8
-2.0 -4
-2.2
0.0 0.2 0.4 0.6 0.8 1.0 1.2 0.0 0.5 1.0 1.5 2.0 2.5 3.0
Log (degree) Log (degree)
Fig. 2. Protein-protein interaction networks (PPINs) of PARK (red) and/or non-PARK proteins (blue). Nodes represent the proteins that encode Parkin-
son’s disease (PD)-related genes, and edges represent known protein-protein interactions with a quality score ≥2. Each PPIN was constructed using
Cytoscape v3.8.2. with the following proteins: PARK proteins (A), PARK proteins excluding those encoded by controversial genes (B), non-PARK pro-
teins (C), all hereditary parkinsonism proteins i.e., both PARK and non-PARK proteins (D), proteins encoded by PD-related genes (gray) from meta-anal-
ysis of genome-wide association studies (GWAS) (E), and proteins encoded by PD-related genes, with PARK and non-PARK proteins excluded (F).
Probabilities of degree distribution P(k) with the degree exponent (γ) and correlation coefficient values (r2) of the PPIN formed by PARK and non-PARK
proteins (G) and the PPIN formed by PARK, non-PARK, and direct interacting first neighbor proteins (H).
https://doi.org/10.3349/ymj.2022.63.8.724 731Protein Interaction Networks of Parkinsonism Genes
Table 3. Physical Cohesiveness between the Proteins Encoded by PD-Related Genes and AD-Related Genes
Category No. of nodes Means of interactions PIE score p value
PARK proteins 19 1.26 1.53 0.00058
PARK proteins excluding controversial genes 14 1.14 1.43 0.01083
Non-PARK proteins 77 1.09 1.21 0.00587
Both PARK and non-PARK proteins 96 1.79 1.28 0.00018
Both PARK and non-PARK proteins excluding controversial genes 91 1.67 1.22 0.00225
Proteins encoded by PD-related genes from meta-GWAS 86 0.54 1.07 0.18961
Proteins encoded by PD-related genes from meta-GWAS excluding PARK and non-PARK proteins 79 0.23 1.06 0.18617
Proteins encoded by AD-related genes from meta-GWAS 129 0.25 1.07 0.09377
PD, Parkinson’s disease; AD, Alzheimer’s disease; meta-GWAS, meta-analysis of genome-wide association studies.
Physical cohesiveness in a gene set was measured by protein interaction enrichment score and p-value. Protein-protein interactions with a quality score of two or
more were subjected to further analysis.
DISCUSSION exclusion did not affect our results.
Our results suggested that the PPINs of PARK and non-PARK
To the best of our knowledge, this is the first study to systemati- proteins are a part of a single scale-free hierarchical network,
cally analyze the PPINs and PIE scores of PARK and non-PARK rather than two independent networks. In the gigantic compo-
proteins and demonstrate that both PARK and non-PARK pro- nent of the PPIN consisting of both PARK and non-PARK pro-
teins are highly connected at the PPI level and form a hierar- teins, the network topology measures and probability of degree
chical scale-free PPIN. Moreover, GO functional enrichment distribution, which followed a power-law scaling behavior,
analysis revealed that both PARK and non-PARK proteins are strongly suggested that these proteins were nodes of a single
involved in shared functional modules. Several studies corre- hierarchical network. The PIE results revealed that after merging
lating genotype with phenotype have shown that mutations in the PARK and non-PARK proteins, they interacted 1.28 times
non-PARK genes may present with idiopathic PD.25-27 At the more than what is randomly expected, supporting the fact that
pathological level as well, there are overlapping features be- these proteins form a single hierarchical PPIN. As PIE analysis
tween PARK and non-PARK gene mutations: for instance, loss precludes any publication biases, this interaction enrichment
of dopaminergic neurons is common in hereditary parkinso- was not due to a bias of proteins that have been studied often.22
nian disorders caused by non-PARK mutations. Lewy body pa- Further, the close relationship between PARK and non-PARK
thology, which is a pathological hallmark of idiopathic PD, is proteins at the PPIN level adhered to the results of our GO func-
found in some hereditary atypical parkinsonian disorders.28-32 tional enrichment analysis. Both PARK and non-PARK genes
Furthermore, a close relationship between PARK and non- belonged to all eight major functional clusters of the enriched
PARK genes has also been found in other system layers. At the GO terms. In contrast to that in the PARK and non-PARK pro-
gene expression level, meta-analyses have shown that PARK teins, there was no enrichment of the PPIs in proteins encoded
and non-PARK genes are overrepresented in dysregulated by PD-related risk alleles, regardless of the inclusion/exclusion
genes in the substantia nigra of patients with idiopathic PD, of the PARK and non-PARK genes in the GWAS-related genes.
particularly as downregulated genes.2,3 Recent studies have This may be because genes near statistically-associated risk
suggested that the burden of rare coding variants in non-PARK alleles, which we selected as PD-related genes, were not nec-
and PARK genes is increased in idiopathic PD genome, thereby essarily candidate genes for a disease.14,34 Another possible ex-
supporting the possible role of non-PARK genes in the patho- planation is that the risk alleles modulate PD-related genetic
genesis of idiopathic PD.4 network indirectly, but are not a part of it per se. Recently, Li, et
The purpose, methods, and results of the PPIN analysis in al.33 showed that PD-associated risk alleles influence innate-im-
our study differ from those in previous studies. The primary mune mechanisms by modulating gene expression in mono-
aim of our study was to explore the relationship between PARK cytes and lysosomal function via changes in gene expression
and non-PARK proteins in a PPIN; whereas, previous studies or RNA splicing in dorsolateral prefrontal cortex.
have constructed PPINs to find novel PD-related genes8,9 or to In biological networks, degree, CC, and BC have been used to
explore the functional connectivity of newly identified genes identify influential nodes that can be used for biomarker dis-
with PD-related genes.33 In previous studies, the criteria for covery, drug designing, and drug repurposing.35,36 In the gigan-
defining PD genes were unclear, and only a small number of tic component of the PPIN formed by PARK and non-PARK
non-PARK genes was included in the analyses. In contrast, we proteins, LRRK2, MAPT, APP, HTT, SNCA, and FMR1 were
performed systematic curation from public databases and lit- identified as hub proteins. Among these, LRRK2 had the high-
erature to accumulate an unbiased set of 77 non-PARK genes. est degree and BC; thus, we suggest that LRRK2 may be the
Although we considered controversial genes, their inclusion/ best target for designing and repurposing drugs for parkinso-
732 https://doi.org/10.3349/ymj.2022.63.8.724Yun Joong Kim, et al.
nian disorders. An unstable trinucleotide repeat expansion in AUTHOR CONTRIBUTIONS
the 5'-UTR of FMR1 causes fragile X syndrome or fragile X trem-
or/ataxia syndrome.37 The relationship between FMR1 and idio- Conceptualization: Yun Joong Kim. Data curation: Heonwoo Lee,
pathic PD has been studied previously. Reduced FMR1 expres- Junbeom Jeon, and Jinwoo Lee. Formal analysis: Yun Joong Kim, Ki-
yong Kim, and Jeehee Yoon. Funding acquisition: Jeehee Yoon. Inves-
sion and reduced FMRP encoded by FMR1 have been observed tigation: Yun Joong Kim, Kiyong Kim, and Jeehee Yoon. Methodology:
in the substantia nigra of idiopathic PD and in incidental Lewy Yun Joong Kim, Kiyong Kim, and Jeehee Yoon. Project administration:
body disease, which is considered as a preclinical stage of idio- Yun Joong Kim and Jeehee Yoon. Resources: Public data. Software:
pathic PD.2,38 FMRP reduction is mediated by inhibition of PKC- Heonwoo Lee, Junbeom Jeon, Jinwoo Lee, Kiyong Kim, and Jeehee
CREB signaling by alpha-synuclein.38 Yoon. Supervision: Yun Joong Kim, Kiyong Kim, and Jeehee Yoon.
Validation: Yun Joong Kim, Kiyong Kim, and Jeehee Yoon. Visualiza-
Although there are exceptions, patients with non-PARK gene
tion: Kiyong Kim. Writing—original draft: Yun Joong Kim, Kiyong Kim,
mutations generally present with broader phenotypes of par- and Jeehee Yoon. Writing—review & editing: Yun Joong Kim, Kiyong
kinsonism and additional movement disorders with or without Kim, and Jeehee Yoon. Approval of final manuscript: all authors.
cognitive dysfunction. Given the close physical connectivity in
the PPIN between PARK and non-PARK proteins and shared
ORCID iDs
functional modules (i.e., overlapping clinical features between
“pure” parkinsonism and parkinsonism with additional fea- Yun Joong Kim https://orcid.org/0000-0002-2956-1552
tures, as well as shared biological processes), lumping a group Kiyong Kim https://orcid.org/0000-0003-3175-8132
of hereditary parkinsonian disorders caused by PARK or non- Heonwoo Lee https://orcid.org/0000-0001-9306-5716
Junbeom Jeon https://orcid.org/0000-0002-3901-3242
PARK gene mutations mimics a recently suggested a concept of
Jinwoo Lee https://orcid.org/0000-0001-8968-5867
ataxia-spasticity disease spectrum.39 Hereditary ataxias and Jeehee Yoon https://orcid.org/0000-0002-4327-3135
hereditary spastic paraplegias share common phenotypes,
pathophysiological pathways, mechanisms, and PPINs.39,40 The
REFERENCES
concept suggests a descriptive, unbiased approach of modular
phenotyping, instead of divisive diagnosis-driven ataxia and 1. Blauwendraat C, Nalls MA, Singleton AB. The genetic architec-
hereditary spastic paraplegia classification system. Therefore, ture of Parkinson’s disease. Lancet Neurol 2020;19:170-8.
it may be reasonable to include non-PARK genes in the PD-re- 2. Kim YJ, Jeon J, Shin J, Kim NY, Hong JH, Oh JM, et al. Dysregulation
of the causative genes for hereditary parkinsonism in the midbrain
lated genome along with PARK genes and PD risk alleles discov-
in Parkinson’s disease. Mov Disord 2017;32:1211-20.
ered by GWAS, although mutations in non-PARK genes in idio- 3. Phung DM, Lee J, Hong S, Kim YE, Yoon J, Kim YJ. Meta-analysis
pathic PD have not been systematically studied. of differentially expressed genes in the substantia nigra in Parkin-
The limitations of our study must be acknowledged. Although son’s disease supports phenotype-specific transcriptome chang-
IntAct is frequently used as a gold standard in various applica- es. Front Neurosci 2020;14:596105.
tions, this was the only PPI database we used in this study. We 4. Kim YJ, Lee J, Kim NY, Hong S, Cho YS, Yoon J. The burden of rare
damaging variants in hereditary atypical parkinsonism genes is in-
analyzed proteins that are expressed only in the brain. Given creased in patients with Parkinson’s disease. Neurobiol Aging 2021;
that molecular functions and biological processes of genes in- 100:118.e5-13.
volved in the hereditary parkinsonism are not necessarily limit- 5. Dittrich MT, Klau GW, Rosenwald A, Dandekar T, Müller T. Identi-
ed to the brain level, PPINs and related pathogeneses in non- fying functional modules in protein-protein interaction networks:
nervous tissue might have been missed. Further, a functional an integrated exact approach. Bioinformatics 2008;24:i223-31.
6. Hao T, Wang Q, Zhao L, Wu D, Wang E, Sun J. Analyzing of molec-
analysis of the PPIN of PARK and non-PARK proteins was not
ular networks for human diseases and drug discovery. Curr Top
included in this study. Despite these limitations, we believe that Med Chem 2018;18:1007-14.
our PPIN comprising PARK and non-PARK proteins can be used 7. Bandres-Ciga S, Saez-Atienzar S, Kim JJ, Makarious MB, Faghri F,
in future studies to explore novel PD-related genes or for drug Diez-Fairen M, et al. Large-scale pathway specific polygenic risk and
discovery and repurposing. transcriptomic community network analysis identifies novel func-
tional pathways in Parkinson disease. Acta Neuropathol 2020;140:
In conclusion, our results suggest that both PARK and non-
341-58.
PARK proteins constitute a single hierarchical PPIN and share 8. Ferrari R, Kia DA, Tomkins JE, Hardy J, Wood NW, Lovering RC, et
molecular mechanisms in the pathogenesis of idiopathic PD. al. Stratification of candidate genes for Parkinson’s disease using
weighted protein-protein interaction network analysis. BMC Ge-
ACKNOWLEDGEMENTS nomics 2018;19:452.
9. Siitonen A, Kytövuori L, Nalls MA, Gibbs R, Hernandez DG, Yliko-
tila P, et al. Finnish Parkinson’s disease study integrating protein-
This research was supported by the Basic Science Research
protein interaction network data with exome sequencing analy-
Program through the National Research Foundation of Korea sis. Sci Rep 2019;9:18865.
(NRF) funded by the Ministry of Education (NRF-2018R1D- 10. Goh KI, Cusick ME, Valle D, Childs B, Vidal M, Barabási AL. The
1A3B07047212) and by a NRF grant funded by the Korean gov- human disease network. Proc Natl Acad Sci U S A 2007;104:8685-
ernment (MSIT) (No. NRF-2020R1F1A1050128). 90.
https://doi.org/10.3349/ymj.2022.63.8.724 733Protein Interaction Networks of Parkinsonism Genes
11. Amberger JS, Bocchini CA, Scott AF, Hamosh A. OMIM.org: lever- 2015;21:1294-5.
aging knowledge across phenotype-gene relationships. Nucleic 26. Mencacci NE, Isaias IU, Reich MM, Ganos C, Plagnol V, Polke JM,
Acids Res 2019;47(Database issue):D1038-43. et al. Parkinson’s disease genomics consortium and UCL-exomes
12. Fabiani G, Martins R, Ashizawa T, Germiniani FMB, Teive HAG. consortium. Parkinson’s disease in GTP cyclohydrolase 1 mutation
99mTc-TRODAT-1 SPECT showing dopaminergic deficiency in a carriers. Brain 2014;137(Pt 9):2480-92.
patient with spinocerebellar ataxia type 10 and parkinsonism. Mov 27. Sidransky E, Nalls MA, Aasly JO, Aharon-Peretz J, Annesi G, Barbo-
Disord Clin Pract 2019;6:85-7. sa ER, et al. Multicenter analysis of glucocerebrosidase mutations
13. Nalls MA, Blauwendraat C, Vallerga CL, Heilbron K, Bandres-Ciga in Parkinson’s disease. N Engl J Med 2009;361:1651-61.
S, Chang D, et al. Identification of novel risk loci, causal insights, 28. Gibb WR. Idiopathic Parkinson’s disease and the Lewy body disor-
and heritable risk for Parkinson’s disease: a meta-analysis of ge- ders. Neuropathol Appl Neurobiol 1986;12:223-34.
nome-wide association studies. Lancet Neurol 2019;18:1091-102. 29. Hartig MB, Iuso A, Haack T, Kmiec T, Jurkiewicz E, Heim K, et al.
14. Andrews SJ, Fulton-Howard B, Goate A. Interpretation of risk loci Absence of an orphan mitochondrial protein, c19orf12, causes a
from genome-wide association studies of Alzheimer’s disease. Lan- distinct clinical subtype of neurodegeneration with brain iron accu-
cet Neurol 2020;19:326-35. mulation. Am J Hum Genet 2011;89:543-50.
15. Sjöstedt E, Zhong W, Fagerberg L, Karlsson M, Mitsios N, Adori C, 30. Schneider SA, Alcalay RN. Neuropathology of genetic synucle-
et al. An atlas of the protein-coding genes in the human, pig, and inopathies with parkinsonism: review of the literature. Mov Disord
mouse brain. Science 2020;367:eaay5947. 2017;32:1504-23.
16. Raudvere U, Kolberg L, Kuzmin I, Arak T, Adler P, Peterson H, et al. 31. Takao M, Aoyama M, Ishikawa K, Sakiyama Y, Yomono H, Saito Y, et
g:Profiler: a web server for functional enrichment analysis and con- al. Spinocerebellar ataxia type 2 is associated with Parkinsonism
versions of gene lists (2019 update). Nucleic Acids Res 2019;47(Web and Lewy body pathology. BMJ Case Rep 2011;2011:bcr0120113685.
server issue):W191-8. 32. Wilson GR, Sim JC, McLean C, Giannandrea M, Galea CA, Riseley
17. Orchard S, Ammari M, Aranda B, Breuza L, Briganti L, Broackes- JR, et al. Mutations in RAB39B cause X-linked intellectual disability
Carter F, et al. The MIntAct project--IntAct as a common curation and early-onset Parkinson disease with α-synuclein pathology. Am
platform for 11 molecular interaction databases. Nucleic Acids J Hum Genet 2014;95:729-35.
Res 2014;42(Database issue):D358-63. 33. Li YI, Wong G, Humphrey J, Raj T. Prioritizing Parkinson’s disease
18. Kerrien S, Aranda B, Breuza L, Bridge A, Broackes-Carter F, Chen genes using population-scale transcriptomic data. Nat Commun
C, et al. The IntAct molecular interaction database in 2012. Nucle- 2019;10:994.
ic Acids Res 2012;40(Database issue):D841-6. 34. Gallagher MD, Chen-Plotkin AS. The post-GWAS era: from asso-
19. Barabási AL, Oltvai ZN. Network biology: understanding the cell’s ciation to function. Am J Hum Genet 2018;102:717-30.
functional organization. Nat Rev Genet 2004;5:101-13. 35. Ashtiani M, Salehzadeh-Yazdi A, Razaghi-Moghadam Z, Hennig H,
20. Ran J, Li H, Fu J, Liu L, Xing Y, Li X, et al. Construction and analy- Wolkenhauer O, Mirzaie M, et al. A systematic survey of centrality
sis of the protein-protein interaction network related to essential measures for protein-protein interaction networks. BMC Syst Biol
hypertension. BMC Syst Biol 2013;7:32. 2018;12:80.
21. Watts DJ, Strogatz SH. Collective dynamics of ‘small-world’ net- 36. Csermely P, Korcsmáros T, Kiss HJ, London G, Nussinov R. Struc-
works. Nature 1998;393:440-2. ture and dynamics of molecular networks: a novel paradigm of
22. Sama IE, Huynen MA. Measuring the physical cohesiveness of pro- drug discovery: a comprehensive review. Pharmacol Ther 2013;
teins using physical interaction enrichment. Bioinformatics 2010; 138:333-408.
26:2737-43. 37. Salcedo-Arellano MJ, Dufour B, McLennan Y, Martinez-Cerdeno V,
23. Nafis S, Kalaiarasan P, Brojen Singh RK, Husain M, Bamezai RN. Hagerman R. Fragile X syndrome and associated disorders: clini-
Apoptosis regulatory protein-protein interaction demonstrates hi- cal aspects and pathology. Neurobiol Dis 2020;136:104740.
erarchical scale-free fractal network. Brief Bioinform 2015;16:675- 38. Tan Y, Sgobio C, Arzberger T, Machleid F, Tang Q, Findeis E, et al.
99. Loss of fragile X mental retardation protein precedes Lewy pathol-
24. Goñi J, Esteban FJ, de Mendizábal NV, Sepulcre J, Ardanza-Trevi- ogy in Parkinson’s disease. Acta Neuropathol 2020;139:319-45.
jano S, Agirrezabal I, et al. A computational analysis of protein- 39. Synofzik M, Schüle R. Overcoming the divide between ataxias and
protein interaction networks in neurodegenerative diseases. BMC spastic paraplegias: shared phenotypes, genes, and pathways. Mov
Syst Biol 2008;2:52. Disord 2017;32:332-45.
25. Gan-Or Z, Orr-Urtreger A, Alcalay RN, Bressman S, Giladi N, Rou- 40. Eidhof I, van de Warrenburg BP, Schenck A. Integrative network and
leau GA. The emerging role of SMPD1 mutations in Parkinson’s brain expression analysis reveals mechanistic modules in ataxia. J
disease: implications for future studies. Parkinsonism Relat Disord Med Genet 2019;56:283-92.
734 https://doi.org/10.3349/ymj.2022.63.8.724You can also read