Total Maximum Daily Load - For Designated Streams in the Tombigbee River Basin - Mississippi Department of ...
←
→
Page content transcription
If your browser does not render page correctly, please read the page content below
FINAL REPORT
                                  January 2021

Total Maximum Daily Load
For Designated Streams in the
Tombigbee River Basin
For Impairment
Jasper Creek HUC 080302010404
due to Sediment

Prepared By:
Mississippi Department of
Environmental Quality
Office of Pollution Control
TMDL/WLA Branch

MDEQ
P.O. Box 10385
Jackson, MS 39289-0385
(601) 961- 5171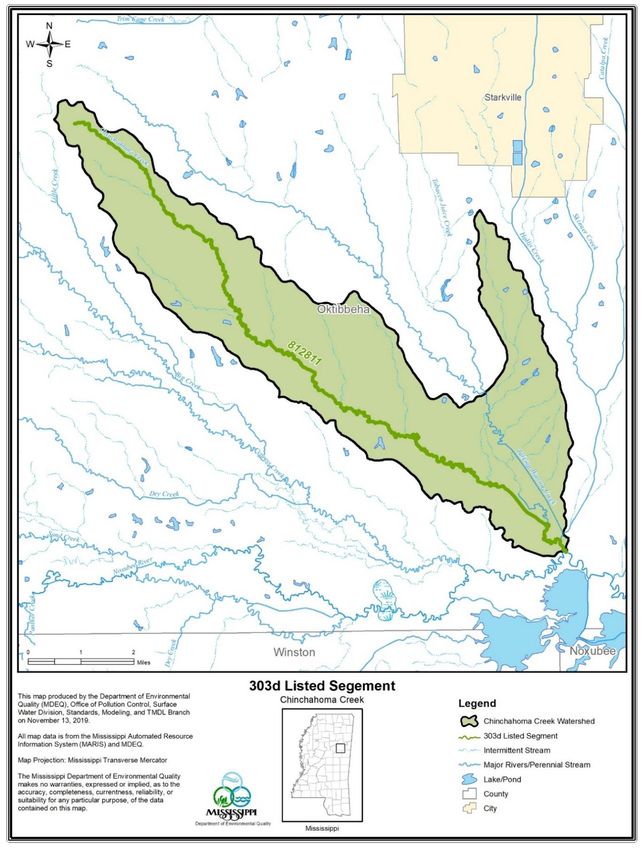
_________________________________Sediment TMDL for Tombigbee River Basin
TMDL Fact Sheet
Tombigbee River Basin Sediment TMDL
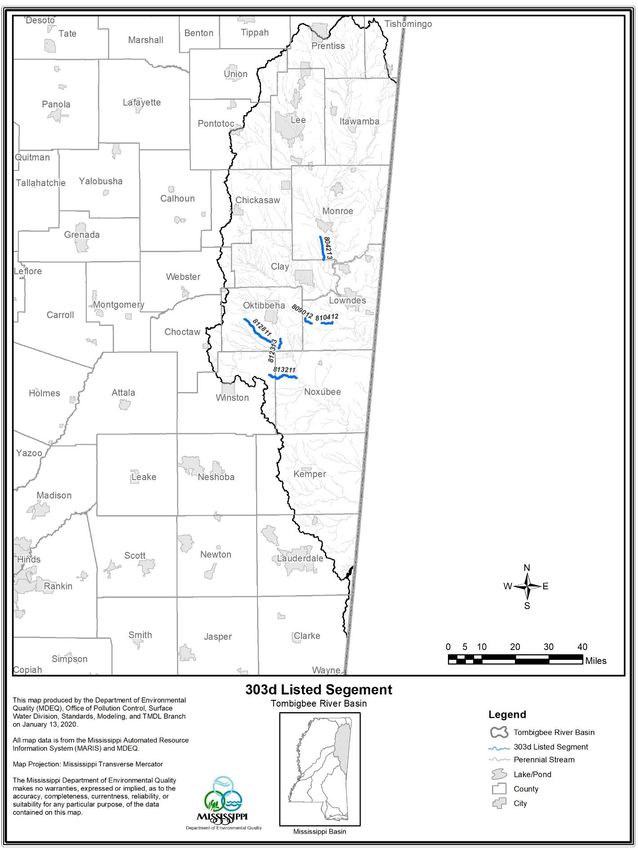
The following waterbodies within the Tombigbee River Basin have been identified impaired due to
sediment; Chinchahoma Creek, Unnamed Tributary to Catalpa Creek, Unnamed Tributary to Gilmer
Creek, Shaw Creek, Spring Creek, and Yellow Creek (Waterbody ID’s 812811, 809012, 810412, 812313,
804213, and 813211). This TMDL addresses impairment due to sediment/siltation located in Hydrologic
Unit Codes (HUCs); 31601080207, 31601040603, 31601060101, 31601080208, 31601011302, and
31601080304 respectively. An estimated 62% to 98.6% reduction in sediment load across all basins is
required to meet TMDL target loads. Best management practices are encouraged to reduce loads from
non- point sources.
Subwatershed Ecoregion Area (Acres) Estimated Load* TMDL* %
Reduction
Chinchahoma Creek 65 15,610.34 31.22 to 842.96 11.7 62.5% to
98.6%
Unnamed Tributary to Catalpa 65 2,410.08 4.82 to 130.14 1.8 62.7% to
Creek 98.6%
Unnamed Tributary to Gilmer 65 1,730.90 3.46 to 93.47 1.2 62.3% to
Creek 98.6%
Shaw Creek 65 2,290.45 4.58 to 123.68 1.7 62.9% to
98.6%
Spring Creek 65 7,350.81 14.70 to 396.94 5.5 62.6% to
98.6%
Yellow Creek 65 28,023.30 56.05 to 1,513.26 21.0 62.5% to
98.6%
*tons per day at the effective discharge
Tombigbee River Basin____________________________________________________________ ii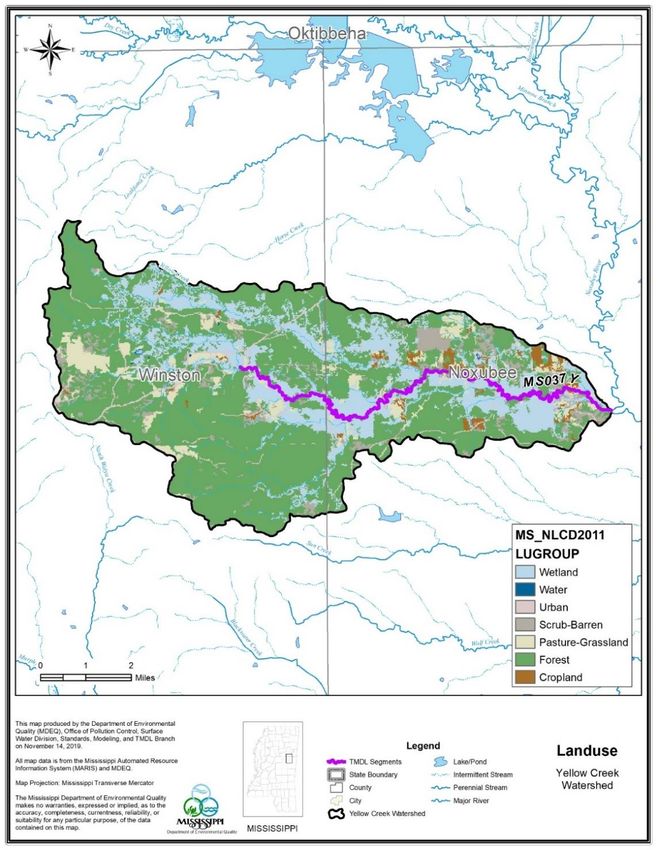
_________________________________Sediment TMDL for Tombigbee River Basin

                                                          CONTENTS
TMDL FACT SHEET…………………………………………………………………………….ii
TMDL INFORMATION ................................................................................................................ v
EXECUTIVE SUMMARY ........................................................................................................... vi
1.0 INTRODUCTION .................................................................................................................... 2
   1.1 Background ........................................................................................................................... 2
   1.2 Applicable Waterbody Segment Classification .................................................................... 3
   1.3 Applicable Waterbody Segment Standard ............................................................................ 3
2.0 TMDL ENDPOINT AND WATER QUALITY ASSESSMENT .......................................... 10
   2.1 Selection of a TMDL Endpoint and Critical Condition ...................................................... 10
3.0 SOURCE ASSESSMENT and LOAD ESTIMATION .......................................................... 11
   3.1 Assessment of Point Sources .............................................................................................. 11
   3.2 Assessment of Nonpoint Sources ....................................................................................... 11
   3.3 Existing Load Estimation.................................................................................................... 19
4.0 DETERMINING THE TARGET SEDIMENT LOAD .......................................................... 20
   4.1 Selecting a Reference Condition (Simon, et al., 2002a) ..................................................... 20
   4.2 Analysis of Available Suspended-Sediment Data (Simon, et al., 2002a)........................... 22
   4.3 Target Sediment Yields ...................................................................................................... 23
5.0 ALLOCATION ....................................................................................................................... 31
   5.1 Wasteload Allocations ........................................................................................................ 31
   5.2 Load Allocations ................................................................................................................. 31
   5.3 Incorporation of a Margin of Safety (MOS) ....................................................................... 32
   5.4 Calculation of the TMDL ................................................................................................... 32
   5.5 Seasonality .......................................................................................................................... 32
6.0 CONCLUSION ....................................................................................................................... 33
   6.1 Future Activities ................................................................................................................. 33
   6.2 Public Participation ............................................................................................................. 34
DEFINITIONS .............................................................................................................................. 35
ABBREVIATIONS ...................................................................................................................... 43
REFERENCES ............................................................................................................................. 44

Tombigbee River Basin____________________________________________________________ iii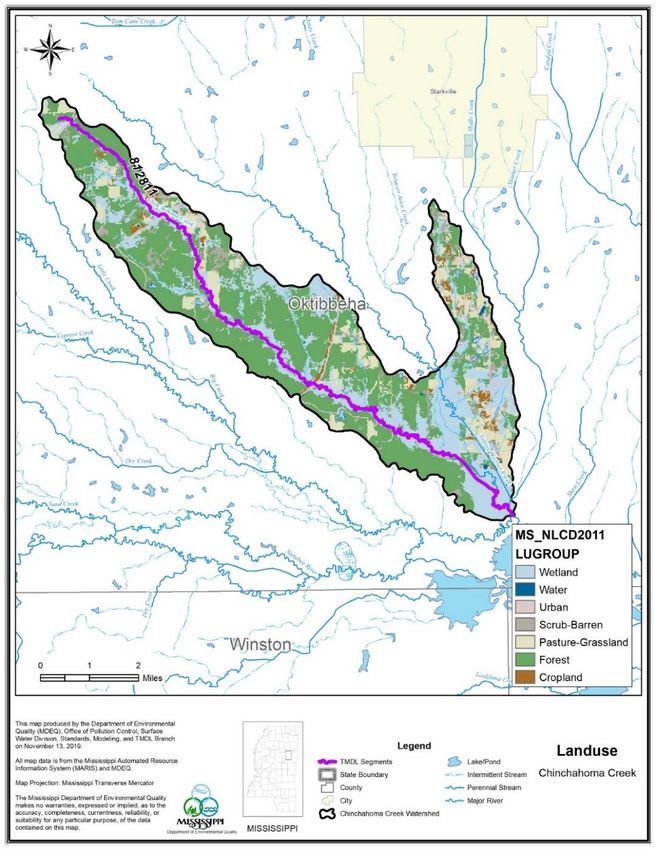
_________________________________Sediment TMDL for Tombigbee River Basin
FIGURES
Figure 1: §303(d) Listed Segments Tombigbee River Basin.......................................................... 1
Figure 2: §303(d) Listed Segment Chincahoma Creek................................................................... 4
Figure 3: §303(d) Listed Segment Unnamed Tributary to Catalpa Creek ...................................... 5
Figure 4: §303(d) Listed Segment Unnamed Tributary to Gilmer Creek ....................................... 6
Figure 5: §303(d) Listed Segment Shaw Creek .............................................................................. 7
Figure 6: §303(d) Listed Segment Spring Creek ............................................................................ 8
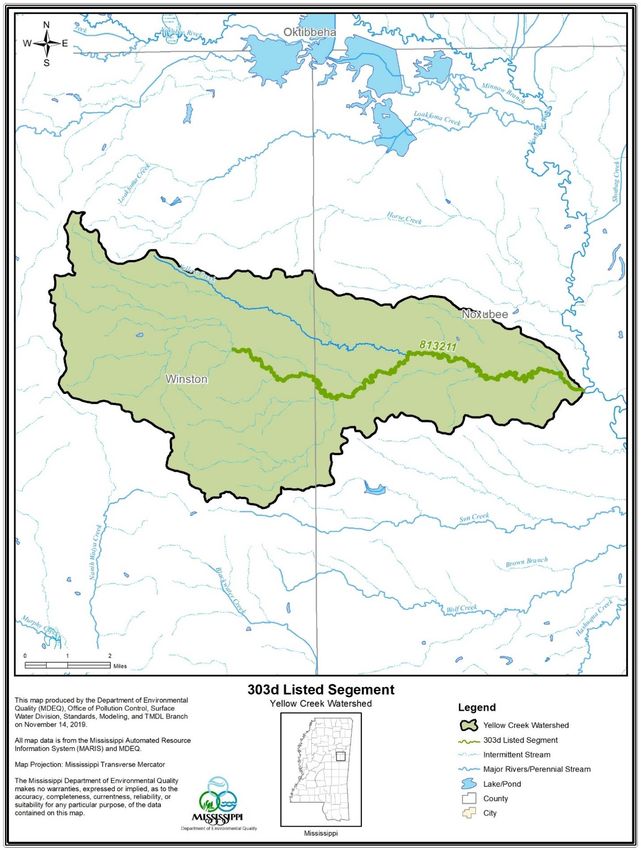
Figure 7: §303(d) Listed Segment Yellow Creek ........................................................................... 9
Figure 8: Chinchahoma Creek Landuse Distribution Map ........................................................... 13
Figure 9: Unnamed Tributary to Catalpa Creek Landuse Distribution Map ................................ 14
Figure 10: Unnamed Tributary to Gilmer Creek Landuse Distribution Map ............................... 15
Figure 11: Shaw Creek Landuse Distribution Map ...................................................................... 16
Figure 12: Spring Creek Landuse Distribution Map..................................................................... 17
Figure 13. Yellow Creek Landuse Distribution Map.................................................................... 18
Figure 14: Six Stages of Channel Evolution ................................................................................. 22
Figure 15: Listed Segments in the Tombigbee River Basin with Level III Ecoregions ............... 24
Figure 16: Chinchahoma Creek with Level III Ecoregions .......................................................... 25
Figure 17: Unnamed Tributary to Catalpa Creek with Level III Ecoregions ............................... 26
Figure 18: Unnamed Tributary to Gilmer Creek with Level III Ecoregions ................................ 27
Figure 19: Shaw Creek with Level III Ecoregions ....................................................................... 28
Figure 20: Spring Creek with Level III Ecoregions...................................................................... 29
Figure 21: Yellow Creek with Level III Ecoregions .................................................................... 30
TABLES
Table 1: Listing Information ........................................................................................................... v
Table 2: Water Quality Standard .................................................................................................... v
Table 3: Chinchahoma Creek Landuse Distribution Table........................................................... 13
Table 4: Unnamed Tributary to Gilmer Creek Landuse Distribution Table ................................. 14
Table 5: Unnamed Tributary to Gilmer Creek Landuse Distribution Table ................................. 15
Table 6: Shaw Creek Landuse Distribution Table ........................................................................ 16
Table 7: Spring Creek Landuse Distribution Table ...................................................................... 17
Table 8: Yellow Creek Landuse Distribution Table ..................................................................... 18
Table 9: Unstable Stream Sediment Yield Ranges for Level III Ecoregion 65 ............................ 19
Table 10: Estimated Existing Loads for Tombigbee River Basin ................................................ 19
Table 11: Stable Stream Sediment Yield Ranges for Level III Ecoregion 65 .............................. 23
Table 12: Tombigbee River Basin Sediment Total Maximum Daily Load .................................. 32
Table 13: Tombigbee River Basin Sediment Loads ..................................................................... 33
Tombigbee River Basin____________________________________________________________ iv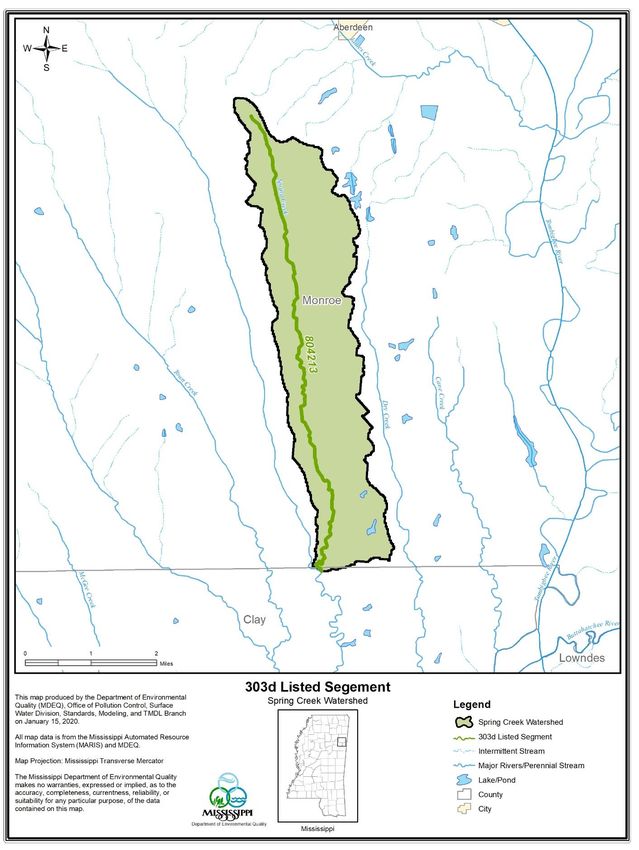
_________________________________Sediment TMDL for Tombigbee River Basin

                                TMDL INFORMATION

                                      Table 1: Listing Information
           ID                Name               County                   Cause                Ecoregion

         812811        Chinchahoma Creek       Oktibbeha                Sediment                  65

                      Unnamed Tributary to
         809012                                 Lowndes                 Sediment                  65
                         Catalpa Creek

                      Unnamed Tributary to
         810412                                 Lowndes                 Sediment                  65
                         Gilmer Creek

                                               Oktibbeha/
         812313            Shaw Creek                                   Sediment                  65
                                                Winston/
                                                Noxubee

         804213           Spring Creek        Monroe/ Clay              Sediment                  65

                                                Winston/
         813211           Yellow Creek                                  Sediment                  65
                                                Noxubee

                                    Table 2: Water Quality Standard
    Parameter            Beneficial use                      Narrative Water Quality Criteria
 Sediment/Siltation    Aquatic Life Support   Waters shall be free from materials attributable to municipal,
                                              industrial, agricultural, or other dischargers producing color, odor,
                                              taste, total suspended solids, or other conditions in such degree as to
                                              create a nuisance, render the waters injurious to public health,
                                              recreation, or to aquatic life and wildlife, or adversely affect the
                                              palatability of fish, aesthetic quality, or impair the waters for any
                                              designated uses.

Tombigbee River Basin____________________________________________________________ v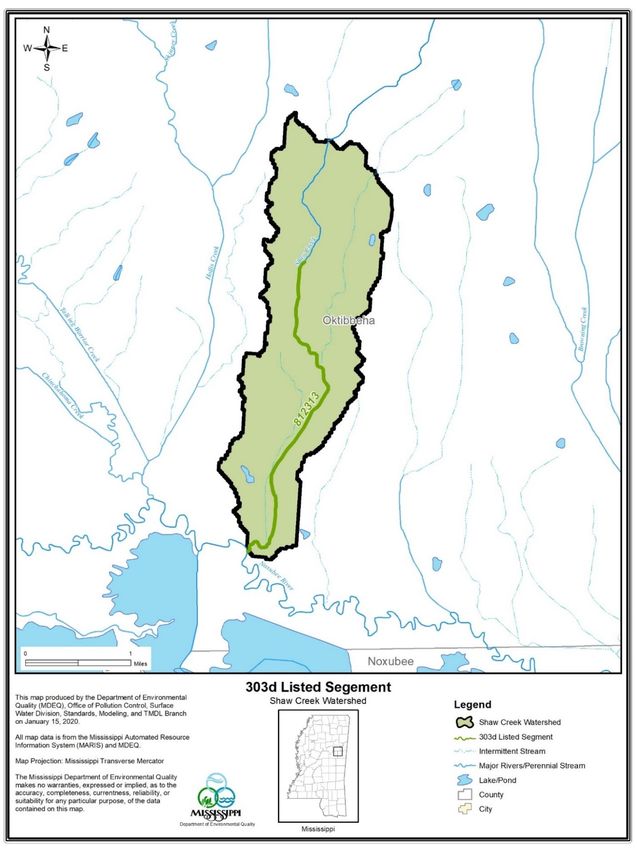
_________________________________Sediment TMDL for Tombigbee River Basin

                                 EXECUTIVE SUMMARY

The following waterbodies within the Tombigbee River Basin have been identified impaired due to
sediment; Chinchahoma Creek, Unnamed Tributary to Catalpa Creek, Unnamed Tributary to Gilmer Creek,
Shaw Creek, Spring Creek, and Yellow Creek (Waterbody ID’s 812811, 809012, 810412, 812313, 804213,
and 813211). This TMDL addresses impairment due to sediment/siltation located in Hydrologic Unit Codes
(HUCs); 31601080207, 31601040603, 31601060101, 31601080208, 31601011302, and 31601080304
respectively (Figure 1). The waterbodies were identified as biologically impaired on the 2018 Mississippi
Section 303(d) List of Impaired Waterbodies. Sediment was identified as a probable primary stressor for
these biological impairments through a stressor identification process.

This TMDL is for clean sediment. The State of Mississippi Water Quality Criteria for Intrastate, Interstate,
and Coastal Waters regulation does not include a numeric water quality standard for aquatic life protection
due to sediment (MDEQ, 2016). The narrative standard for the protection of aquatic life is sufficient for
justification of TMDL development, but does not provide a quantifiable TMDL target. The target for this
TMDL is based on reference sediment yields developed by the Channel and Watershed Processes Research
Unit (CWPRU) at the National Sedimentation Laboratory (NSL).

The CWPRU developed reference sediment yields, or targets, for each level III ecoregion within
Mississippi. These yields were derived from the empirical analysis of historical flow and suspended
sediment concentrations for stable streams in each level III ecoregion. The methods used to develop the
level III reference yields are described in detail in the reports titled “Reference” and “Impacted” Rates of
Suspended-Sediment Transport for Use in Developing Clean Sediment TMDLs: Mississippi and the
Southeastern United States (Simon, et al., 2002b) and Actual and Reference Sediment Yields for the James
Creek Watershed – Mississippi (Simon, et al., 2002a). The ecoregion(s) for the streams referenced in this
TMDL in HUC 080302010404 is the Southeastern Plains Ecoregion (65). The TMDL targets are based on
the sediment yield at the effective discharge (bankfull flow or Q1.5).

According to 40 CFR §130.2 (i), TMDLs can be expressed in terms of mass per time, toxicity, or other
appropriate measure. This TMDL is expressed as the tons of sediment that can be discharged from a
subwatershed during a day (tons/day) at the effective discharge and still attain the applicable water quality
standard.
The TMDL is expressed at the effective discharge. The effective discharge is the channel-forming flow or
the flow that moves the most sediment. The effective discharge is obtained by combining flow frequency
data with sediment transport relationships (Simon, et al., 2002b).           The effective discharge occurs
statistically once every one and a half years (Q1.5) and not on a daily basis. However, because the effective
discharge is the critical condition, compliance with the TMDL at the effective discharge will result in the
attainment of the water quality standards at all times. For many of the §303(d) listed streams in the
Tombigbee River Basin sediment data were either not available or were insufficient to calibrate a water
quality model for prediction of existing sediment loads. A range of unstable values was assigned based on
the level III ecoregion. The unstable range stream values within ecoregion 65 is 0.002 to 0.054 tons per
acre per day at the effective discharge. This is representative of the existing loads expected for the
waterbody within HUCs 31601080207, 31601040603, 31601060101, 31601080208, 31601011302, and
31601080304.

The unstable yields are larger than the target yields for these waterbodies, therefore, a reduction is
Tombigbee River Basin____________________________________________________________ vi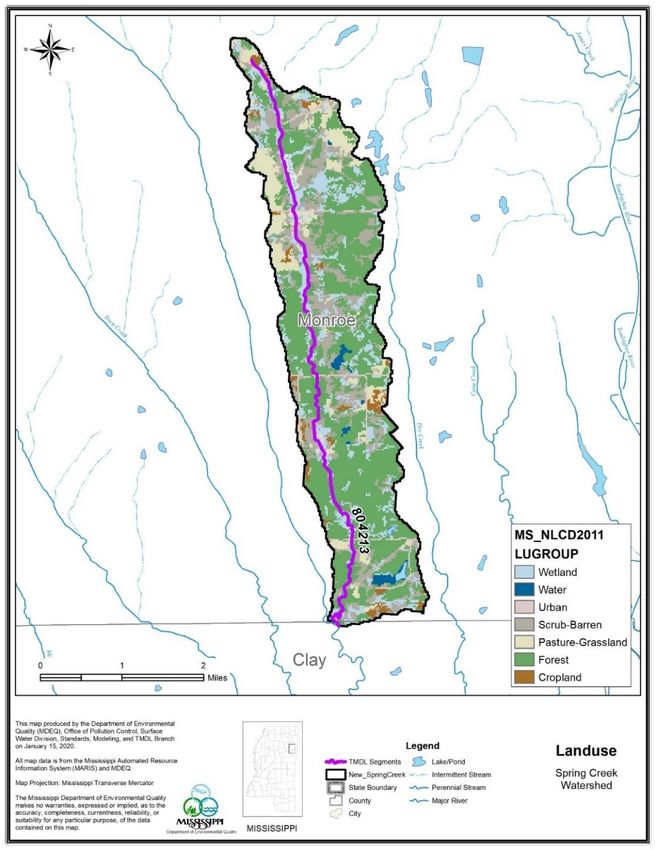
_________________________________Sediment TMDL for Tombigbee River Basin

recommended for Chinchahoma Creek, Unnamed Tributary to Catalpa Creek, Unnamed Tributary to
Gilmer Creek, Shaw Creek, Spring Creek, and Yellow Creek.

Tombigbee River Basin____________________________________________________________ vii
_________________________________Sediment TMDL for Tombigbee River Basin

                    Figure 1: §303(d) Listed Segments Tombigbee River Basin

Tombigbee River Basin____________________________________________________________ 1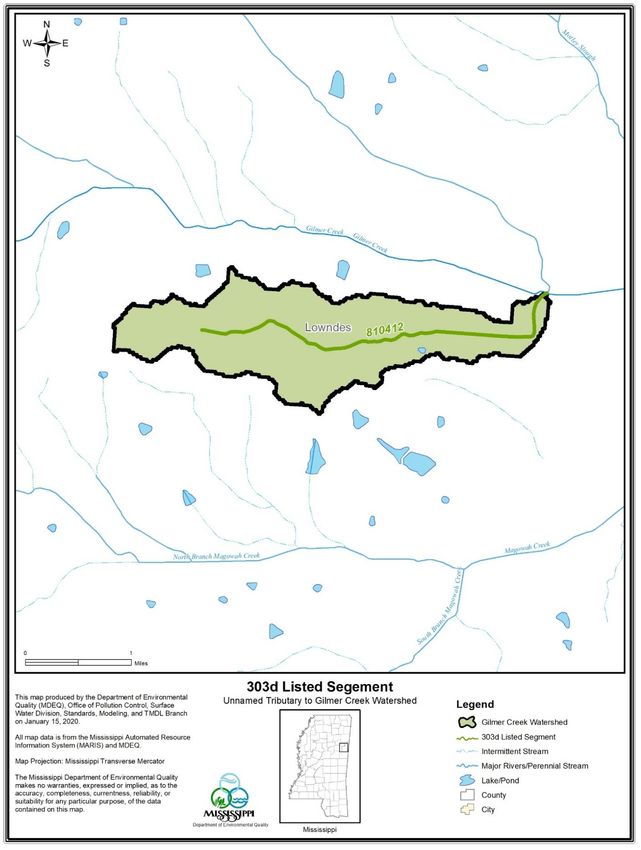
_________________________________Sediment TMDL for Tombigbee River Basin

                                    1.0 INTRODUCTION

1.1 Background

The identification of waterbodies not meeting their designated use and the development of total maximum
daily loads (TMDLs) for those waterbodies are required by Section 303(d) of the Clean Water Act (CWA)
and the Environmental Protection Agency’s (EPA) Water Quality Planning and Management Regulations
(40 CFR part 130). The TMDL process is designed to restore and maintain the quality of those impaired
waterbodies through the establishment of pollutant specific allowable loads. The pollutant of concern for
this TMDL is sediment from landuse runoff and in-channel sediment processes. The waterbodies included
in this TMDL is located within United States Geological Survey (USGS) Hydrologic Unit Codes (HUCs);
31601080207, 31601040603, 31601060101, 31601080208, 31601011302, and 31601080304. These HUCs
are located in Oktibbeha, Lowndes, Winston, Noxubee, Monroe, and Clay Counties.

The entire Chichahoma Creek subwatershed covers 15,610 acres and located in Oktibbeha County. The
watershed contains many landuse types including agricultural land, pastureland, wetland, and forest areas.
However, the dominant landuse within the HUC is Forest. The location of the §303(d) listed segment is
shown in Figure 2.

The Unnamed Tributary to Catalpa Creek watershed located in Lowndes County has an area of
approximately 2,410 acres. The watershed has urban, pasture, and wetlands, but consists mostly of pasture
land (Figure 3).

Located in Lowndes County the Unnamed Tributary to Gilmer watershed covers 1,730 acres. The landuse
of the watershed consists mostly of forest, pasture, and wetland. With the majority of the area used for
Pasture (Figure 4).

Shaw Creek lies in Oktibbeha County and covers more than 2,290 acres. In the watershed the landuse is
predominantly forest, pasture, and wetland; with pasture being the largest in area (Figure 5).

Spring Creek watershed lies on the Monroe and Clay County border. The area of the watershed is about
7,351 acres, with a landuse consisting mostly of scrub, pasture, and wetland. Forest covers the largest
percentage of landuse cover (Figure 6).

The Yellow Creek watershed covers about 28,023 acres and is in both Winstoon and Noxubee Counties.
The landuse in the watershed is pasture, scrubland, and wetland. With forest covering the vast amount of
this watershed (Figure 7).

These waterbodies were listed due to failure to meet minimum water quality criteria for biological use
support based on biological sampling. A detailed assessment of the watershed and potential point sources,
called a stressor identification, was completed for the waterbody. The results of the stressor identification
indicated that sediment was a probable primary stressor.

Tombigbee River Basin____________________________________________________________ 2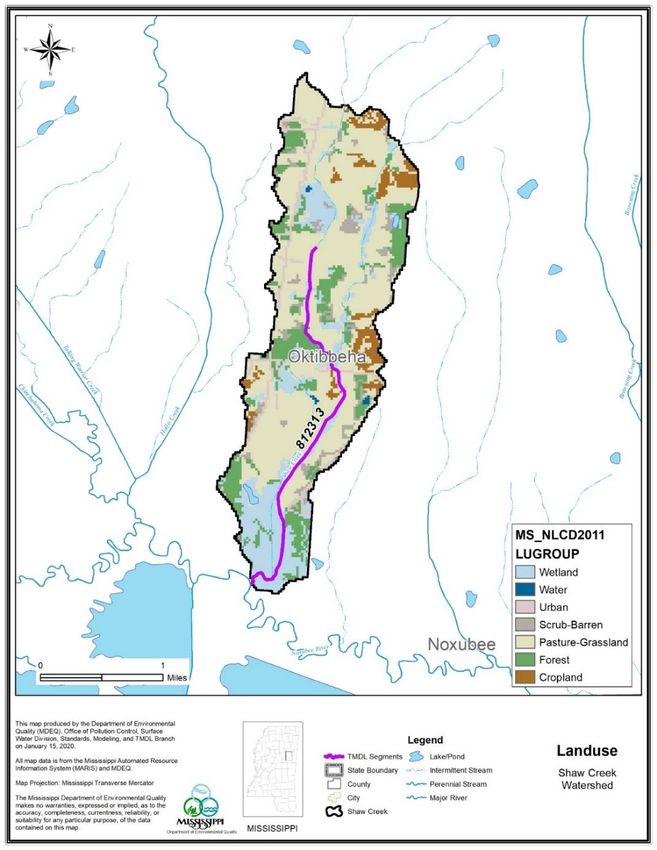
_________________________________Sediment TMDL for Tombigbee River Basin

1.2 Applicable Waterbody Segment Classification

The waterbody classification for all the waterbodies listed, as established by the State of Mississippi Water
Quality Criteria for Intrastate, Interstate, and Coastal Waters regulation, is Fish and Wildlife Support
(MDEQ, 2016). Waters with this classification are intended for fishing and propagation of fish, aquatic
life, and wildlife. Waters that meet the Fish and Wildlife classification should also be suitable for secondary
contact, which is defined as incidental contact with water including wading and occasional swimming.

1.3 Applicable Waterbody Segment Standard

The State of Mississippi Water Quality Criteria for Intrastate, Interstate, and Coastal Waters do not include
a water quality standard applicable to aquatic life protection due to sediment (MDEQ, 2016). However, a
narrative standard for the protection of aquatic life was interpreted to determine an applicable target for this
TMDL. The narrative standard is that waters shall be free from materials attributable to municipal,
industrial, agricultural, or other dischargers producing color, odor, taste, total suspended solids, or other
conditions in such degree as to create a nuisance, render the waters injurious to public health, recreation, or
to aquatic life and wildlife, or adversely affect the palatability of fish, aesthetic quality, or impair the waters
for any designated uses.

Tombigbee River Basin____________________________________________________________ 3
_________________________________Sediment TMDL for Tombigbee River Basin

                     Figure 2: §303(d) Listed Segment Chinchahoma Creek

Tombigbee River Basin____________________________________________________________ 4
_________________________________Sediment TMDL for Tombigbee River Basin
Figure 3: §303(d) Listed Segment Unnamed Tributary to Catalpa Creek
Tombigbee River Basin____________________________________________________________ 5_________________________________Sediment TMDL for Tombigbee River Basin
Figure 4: §303(d) Listed Segment Unnamed Tributary to Gilmer Creek
Tombigbee River Basin____________________________________________________________ 6_________________________________Sediment TMDL for Tombigbee River Basin
Figure 5: §303(d) Listed Segment Shaw Creek
Tombigbee River Basin____________________________________________________________ 7_________________________________Sediment TMDL for Tombigbee River Basin
Figure 6: §303(d) Listed Segment Spring Creek
Tombigbee River Basin____________________________________________________________ 8_________________________________Sediment TMDL for Tombigbee River Basin
Figure 7: §303(d) Listed Segment Yellow Creek
Tombigbee River Basin____________________________________________________________ 9_________________________________Sediment TMDL for Tombigbee River Basin 2.0 TMDL ENDPOINT AND WATER QUALITY ASSESSMENT 2.1 Selection of a TMDL Endpoint and Critical Condition One of the major components of a TMDL is the establishment of target endpoints, which are used to evaluate the attainment of acceptable water quality. Target endpoints, therefore, represent the water quality goals that are to be achieved by meeting the load and wasteload allocations specified in the TMDL. The endpoints allow for a comparison between observed conditions and conditions that are expected to restore designated uses. For the waterbodies listed there is an acceptable range of sediment loadings at the effective discharge of the waterbody. The range was developed from suspended sediment concentration (SSC) data measured at stable streams in the same ecoregion. The target range for the waterbodies within ecoregion 65 is 0.0004 to 0.0019 tons per acre per day at the effective discharge. The midpoint of the range was selected to calculate the TMDL yields for the waterbody. The effective discharge is the discharge which moves the most sediment, or is the channel-forming flow. This discharge has been selected as the critical condition for this TMDL (Simon, et al., 2002b). Calculating the effective discharge is a matter of integrating a flow- frequency curve with a sediment transport rating to obtain the discharge (range of discharges) that transports the most sediment. For these waterbodies in Mississippi, the Q1.5 is on average, a good approximation. Therefore, the Q1.5 was used as a measure of establishing the effective discharge at the site. If the sediment target applicable for sediment in the waterbody is maintained during critical conditions, then the health of the stream should improve. Tombigbee River Basin____________________________________________________________ 10
_________________________________Sediment TMDL for Tombigbee River Basin

         3.0 SOURCE ASSESSMENT and LOAD ESTIMATION

An important part of the TMDL analysis is the identification of individual sources, source categories, or
source subcategories of sedimentation in the watershed and the amount of pollutant loading contributed by
each of these sources. Under the CWA, sources are broadly classified as either point or nonpoint sources.
Under 40 CFR §122.2, a point source is defined as a discernable, confined, and discrete conveyance from
which pollutants are or may be discharged to surface waters. The National Pollutant Discharge Elimination
System (NPDES) program regulates point source discharges. Point sources can be described by two broad
categories: 1) NPDES regulated municipal and industrial wastewater treatment plants (WWTPs) and 2)
NPDES regulated industrial activities, which include construction activities and municipal storm water
discharges (Municipal Separate Storm Sewer Systems [MS4s]). For the purposes of this TMDL, all sources
of sediment loading not regulated by NPDES permits are considered nonpoint sources.

3.1 Assessment of Point Sources

The TSS component of municipal and sanitary sewer treatment discharges is generally composed of organic
material and not siltation, and therefore would not have a direct impact on the biological integrity of a
stream whose probable primary stressor is sediment which is impacted by soil erosion during wet weather
events. The pollutant of concern for this TMDL is sediment from landuse runoff and in-channel processes.
There are no MS4 permits within the watersheds listed in this TMDL. As of March 2003, discharge of
storm water from construction activities disturbing more than one acre must obtain an NPDES permit. The
purpose of the NPDES permit is to eliminate or minimize the discharge of pollutants (sediment) from
construction activities. Since construction activities at a site are of a temporary, relatively short term nature,
the number of construction sites covered by the general permit varies. A general permit authorizes a
category of discharges, rather than tailoring an individual permit to a specific facility. The target for these
areas is the same range as the TMDL target for the watershed. Properly designed and well-maintained
BMPs are expected to provide attainment of water quality standards.

3.2 Assessment of Nonpoint Sources

Nonpoint loading of sediment in a waterbody results from the transport of the material into receiving
waters by the processes of mass wasting, head cutting, gullying, and sheet and rill erosion.
Sources of sediment include:

    •   Agriculture
    •   Silviculture
    •   Rangeland
    •   Construction sites
    •   Roads
    •   Urban areas
    •   Mass wasting areas
    •   Gullies
    •   Surface mining not covered by an NPDES or general permit
    •   In-channel and instream sources

Tombigbee River Basin____________________________________________________________ 11
_________________________________Sediment TMDL for Tombigbee River Basin
• Historical landuse activities and channel alterations
The watersheds listed contain many different landuse types, including forest, cropland, pasture, wetland,
scrub land, and urban as shown in Figures 8-13 and Tables 3-8. The landuse information for the watershed
is based on the National Landcover Database 2011 (NLCD 2011). This data set is based on 2011 Landsat
satellite data.
Tombigbee River Basin____________________________________________________________ 12_________________________________Sediment TMDL for Tombigbee River Basin
Figure 8. Chinchahoma Creek Landuse Distribution Map
Table 3: Landuse Distribution Table Chinchahoma Creek
Chichahoma Creek HUC 31601080207
Land Use Distribution
Landuse Acres Percent
Water 59.16 0.40%
Landuse for the entire
Urban 458.80 2.90%
drainage area
Forest 7661.28 49.10%
Scrub Barren 754.81 4.80%
Pasture/Grass 1812.96 11.60%
Cropland 324.03 2.10%
Wetland 4539.30 29.10%
Total 15610.34 100.00%
Tombigbee River Basin____________________________________________________________ 13_________________________________Sediment TMDL for Tombigbee River Basin
Figure 9. Unnamed Tributary of Catalpa Creek Landuse Distribution Map
Table 4: Landuse Distribution Table UNT Catalpa Creek
UNT to Catalpa Creek HUC 31601040603
Land Use Distribution
Landuse Acres Percent
Water 14.23 0.60%
Landuse for the entire
Urban 303.79 12.60%
drainage area
Forest 103.19 4.30%
Scrub Barren 32.47 1.30%
Pasture/Grass 1137.99 47.30%
Cropland 697.65 28.90%
Wetland 120.76 5.00%
Total 2410.08 100.00%
Tombigbee River Basin____________________________________________________________ 14_________________________________Sediment TMDL for Tombigbee River Basin
Figure 10. Unnamed Tributary of Gilmer Creek Landuse Distribution Map
Table 5: Landuse Distribution Table UNT Gilmer Creek
UNT to Gilmer Creek HUC 31601060101
Land Use Distribution
Landuse Acres Percent
Water 25.80 1.50%
Landuse for the entire
Urban 106.97 6.20%
drainage area
Forest 375.62 21.70%
Scrub Barren 173.25 10.00%
Pasture/Grass 438.56 25.30%
Cropland 337.60 19.50%
Wetland 273.10 15.80%
Total 1730.90 100.00%
Tombigbee River Basin____________________________________________________________ 15_________________________________Sediment TMDL for Tombigbee River Basin
Figure 11. Shaw Creek Landuse Distribution Map
Table 6: Landuse Distribution Table Shaw Creek
Shaw Creek HUC 31601080208
Land Use Distribution
Landuse Acres Percent
Water 5.12 0.22%
Landuse for the entire
Urban 99.86 4.36%
drainage area
Forest 315.13 13.76%
Scrub Barren 116.09 5.07%
Pasture/Grass 1247.64 54.47%
Cropland 124.54 5.44%
Wetland 382.07 16.68%
Total 2290.45 100.00%
Tombigbee River Basin____________________________________________________________ 16_________________________________Sediment TMDL for Tombigbee River Basin
Figure 12. Spring Creek Landuse Distribution Map
Table 7: Landuse Distribution Table Spring Creek
Spring Creek HUC 31601011302
Land Use Distribution
Landuse Acres Percent
Water 60.27 1.20%
Landuse for the entire
Urban 100.52 2.00%
drainage area
Forest 2553.54 50.10%
Scrub Barren 1013.45 19.90%
Pasture/Grass 503.95 9.90%
Cropland 2386.07 2.50%
Wetland 733.01 14.40%
Total 7350.81 100.00%
Tombigbee River Basin____________________________________________________________ 17_________________________________Sediment TMDL for Tombigbee River Basin
Figure 13. Yellow Creek Landuse Distribution Map
Table 8: Landuse Distribution Table Yellow Creek
Yellow Creek HUC 31601080304
Land Use Distribution
Landuse Acres Percent
Water 19.79 0.10%
Landuse for the entire
Urban 689.42 2.50%
drainage area
Forest 16961.39 60.50%
Scrub Barren 1655.95 5.90%
Pasture/Grass 1708.44 6.10%
Cropland 507.28 1.80%
Wetland 6481.03 23.10%
Total 28023.30 100.00%
Tombigbee River Basin____________________________________________________________ 18_________________________________Sediment TMDL for Tombigbee River Basin
3.3 Existing Load Estimation
Due to lack of data for calibration it was determined that a modeling exercise to quantify the load from each
source and estimate the total existing load would be ineffective. Instead an ecoregion approach was utilized
to estimate existing load ranges. The CWPRU estimated the typical range for unstable streams within the
level III ecoregion in the Tombigbee River Basin. That range was then used to estimate an existing load
for subwatersheds within Ecoregion 65.
A range of unstable values was assigned based on the level III ecoregion values in Table 9. Therefore,
the existing load for ecoregion 65 is 0.002 to 0.054 tons per acre per day at the effective discharge. The
Estimated Existing Loads are shown in Table 10.
Table 9: Unstable Stream Sediment Yield Ranges for Level III Ecoregion 65
Level III Ecoregion Unstable Streams Sediment Yield Range*
Ecoregion 65 0.002 to 0.054
*tons per acre per day at the effective discharge
Table 10: Estimated Existing Loads for Tombigbee River Basin
Subwatershed Area (Acres) Estimated Load*
Chinchahoma Creek 15,610.34 31.22 to 842.96
Unnamed Tributary to Catalpa Creek 2,410.08 4.82 to 130.14
Unnamed Tributary to Gilmer Creek 1,730.90 3.46 to 93.47
Shaw Creek 2,290.45 4.58 to 123.68
Spring Creek 7,350.81 14.70 to 396.94
Yellow Creek 28,023.30 56.05 to 1,513.26
*tons per day
Tombigbee River Basin____________________________________________________________ 19_________________________________Sediment TMDL for Tombigbee River Basin
4.0 DETERMINING THE TARGET SEDIMENT LOAD
The information and methodologies described in the following sections are based on research efforts
conducted by the CWPRU of the National Sedimentation Laboratory in Oxford, Mississippi. The primary
sources of the information presented in this section are:
· Actual and Reference Sediment Yields for the James Creek Watershed – Mississippi (Simon, et al.,
2002a)
· “Reference” and “Impacted” Rates of Suspended-Sediment Transport for Use in Developing Clean
Sediment TMDLs: Mississippi and the Southeastern United States (Simon, et al., 2002b)
4.1 Selecting a Reference Condition (Simon, et al., 2002a)
Sediment loads (transport rates) in streams vary by orders of magnitude over time and by location. Controls
such as geology and channel-boundary materials, land use, channel stability, and the type and timing of
precipitation events make prediction of sediment loads difficult and complex. Still, in order to determine
the amount of sediment that impairs a given waterbody (TMDL), one must first be able to determine the
sediment load that would be expected in an unimpaired stream of a given type and location. However,
baseline conditions of flow, sediment concentrations, and transport rates for streams in the wide variety of
physiographic provinces and under a wide variety of land uses are poorly understood.
There is no reason to assume that “natural” or background rates of sediment transport will be consistent
from one region to another. Within the context of clean sediment TMDLs, it follows that there is no reason
to assume that “target” values should be consistent on a nationwide basis. Similarly, there is no reason to
assume that channels within a given region will have consistent rates of sediment transport. For example,
unstable channel systems or those draining disturbed watersheds will produce and transport more sediment
than stable channel systems in the same region. This reflects differences in the magnitude and perhaps type
of erosion processes that dominate a subwatershed or stream reach.
To be useful for TMDL practitioners, sediment transport relations must be placed within a conceptual and
analytic framework such that they can be used to address sediment-related problems at sites where no such
data exist. To accomplish this, sediment transport characteristics and relations need to be regionalized
according to attributes of channels and drainage basins that are directly related to sediment production,
transport, and potential impairment. In a general way, these attributes include among others, physiography,
geology, climate and ecology, differentiated collectively as an ecoregion.
In order to identify those sediment transport conditions that represent impacted or impaired conditions, it
is essential to first define a non-disturbed, stable, or “reference” condition for the particular stream reach.
In some schemes the “reference” condition simply means “representative” of a given category of classified
channel forms or morphologies and as such, may not be analogous with a “stable”, “undisturbed”, or
“background” rate of sediment production and transport.
The Rosgen (1985) stream classification system is widely used to describe channel form. In this
classification system, stream types D, F, and G are by definition, unstable (Rosgen, 1996). These stream
reaches, therefore, would be expected to produce and transport enhanced amounts of sediment and represent
“impacted”, if not “impaired” conditions. Thus, although it may be possible to define a “representative”
Tombigbee River Basin____________________________________________________________ 20_________________________________Sediment TMDL for Tombigbee River Basin reach of stream types D, F, and G, for the purpose of TMDL development, a “reference” condition transporting “natural” or “background” rates of sediment will be difficult to find. As an alternative scheme for TMDL practitioners, the channel evolution framework set out by Simon and Hupp (1986) is proposed in Figure 14. In most alluvial channels, disruption of the dynamic equilibrium generally results in a certain degree of upstream channel degradation and downstream aggradation. If the predisturbed channel is considered as the initial stage (stage I) of channel evolution and the disrupted channel as an instantaneous condition (stage II), rapid channel degradation can be considered stage III. Degradation flattens channel gradients and consequently reduces the available stream power for given discharges with time. Concurrently, bank heights are increased and bank angles are often steepened by fluvial undercutting and by pore-pressure induced bank failures near the base of the bank. Thus, the degradation stage (stage III) is directly related to destabilization of the channel banks and to channel widening by mass-wasting processes (stage IV) once bank heights and angles exceed the critical conditions of the bank material (as determined by shear-strength characteristics). As degradation migrates further upstream, aggradation (stage V) becomes the dominant trend in previously degraded downstream sites because the flatter gradient and lower hydraulic radius at the degraded site cannot transport the heightened sediment loads originating from degrading reaches upstream. This secondary aggradation occurs at rates roughly 60% less than the associated degradation rate (Simon and Hupp, 1992). These reduced aggradation rates indicate that bed-level recovery will not be complete and that attainment of a new dynamic equilibrium will take place through (1) further channel widening, (2) the establishment of riparian vegetation that adds roughness elements and reduces the stream power for given discharges, and (3) further gradient reduction by meander extension and elongation. The lack of complete bed-level recovery often results in a two-tiered channel configuration with the original floodplain surface becoming a terrace. Flood flows are, therefore, constrained within this enlarged channel below the terrace level. Without proliferation of riparian vegetation within the channel, this results in a given flow having greater erosive power than if an equivalent flow could dissipate energy by spreading across the floodplain. Where vegetation does re-establish, the additional roughness limits the erosive power of flood events within the incised channel and constrains shear-stress values to near bankfull levels. Aggrading conditions (stage V) are also common in reaches downstream from the area of maximum disturbance immediately after the disturbance is imposed on the stream channel. With stages of channel evolution tied to discrete channel processes and not strictly to specific channel shapes, they have been successfully used to describe systematic channel-stability processes over time and space in diverse environments subject to various disturbances such as stream response to: channelization in the Southeast US Coastal Plain; volcanic eruptions in the Cascade Mountains; and dams in Tuscany, Italy (Rinaldi and Simon, 1998). Because the stages of channel evolution represent shifts in dominant channel processes, they are systematically related to suspended-sediment and bed-material discharge (Simon, 1989; Kuhnle and Simon, 2000), fish-community structure, rates of channel widening (Simon and Hupp, 1992), and the density and distribution of woody riparian vegetation (Hupp, 1992). Tombigbee River Basin____________________________________________________________ 21
Stage I. Sinuous, Prem odified                     h c = critical bank height
                                                                                  h
_________________________________Sediment TMDL for Tombigbee River Basin
the sediment load at the effective discharge. To normalize the data for differences in basin size, the sediment
load was divided by drainage area to obtain sediment yield (in tons/acre/day).
4.3 Target Sediment Yields
Target values for suspended-sediment are based on the concept that stable channel conditions can be
represented by channel evolution Stages I and VI. Therefore, the effective discharge sediment yields for
Stage I and VI in a given ecoregion represent background or natural transport rates shown in Figure 14
(Simon, et al., 2002b). The targeted sediment yield for an ecoregion is based on the sediment yield values
obtained for Stage I and VI sites within that ecoregion. The targeted sediment yield range for ecoregion 65
is 0.0004 to 0.0019 tons per acre per day at the effective discharge (Q1.5) shown in Table 11 and Figures
15- 21. A stable stream sediment load was calculated for the subwatershed using the mean value in the
range for the appropriate ecoregion over the area.
Table 11: Stable Stream Sediment Yield Ranges for Level III Ecoregion 65
Level III Ecoregion Stable Streams Sediment Yield Range*
Ecoregion 65 0.0004 to 0.0019
*tons per acre per day at the effective discharge
Tombigbee River Basin____________________________________________________________ 23_________________________________Sediment TMDL for Tombigbee River Basin
Figure 15. Listed Segments in the Tombigbee River Basin with Level III Ecoregion
Tombigbee River Basin____________________________________________________________ 24_________________________________Sediment TMDL for Tombigbee River Basin
Figure 16. Chinchahoma Creek with Level III Ecoregion
Tombigbee River Basin____________________________________________________________ 25_________________________________Sediment TMDL for Tombigbee River Basin
Figure 17. Unnamed Tributary to Catalpa Creek with Level III Ecoregions
Tombigbee River Basin____________________________________________________________ 26_________________________________Sediment TMDL for Tombigbee River Basin
Figure 18. Unnamed Tributary to Gilmer Creek with Level III Ecoregions
Tombigbee River Basin____________________________________________________________ 27_________________________________Sediment TMDL for Tombigbee River Basin
Figure 19. Shaw Creek with Level III Ecoregions
Tombigbee River Basin____________________________________________________________ 28_________________________________Sediment TMDL for Tombigbee River Basin
Figure 20. Spring Creek with Level III Ecoregions
Tombigbee River Basin____________________________________________________________ 29_________________________________Sediment TMDL for Tombigbee River Basin
Figure 21. Yellow Creek with Level III Ecoregions
Tombigbee River Basin____________________________________________________________ 30_________________________________Sediment TMDL for Tombigbee River Basin
5.0 ALLOCATION
According to 40 CFR §130.2 (i), TMDLs can be expressed in terms of mass per time, toxicity, or other
appropriate measure. This TMDL is expressed as the tons of sediment that can be discharged from a
subwatershed during a day (tons/day) at the effective discharge and still attain the applicable water quality
standard. It is appropriate to apply the same target yield to permitted (WLA) and unpermitted (LA)
watershed areas. For load TMDLs the WLA and LA are summed to calculate the TMDL. This TMDL is
expressed as the load at the effective discharge. The WLAs and LAs set in this TMDL are to be met at the
effective discharge. The sediment targets used in the TMDL are based on suspended sediment
concentrations. The methods used to develop these values are described in detail in the reports titled,
“Reference” and “Impacted” Rates of Suspended-Sediment Transport for Use in Developing Clean
Sediment TMDLs: Mississippi and the Southeastern United States (Simon, et al., 2002b) and Actual and
Reference Sediment Yields for the James Creek Watershed – Mississippi (Simon, et al., 2002a).
5.1 Waste load Allocations
The WLA for the sub watersheds was set to zero tons of sediment per day. The TSS component of any
NPDES municipal or sanitary sewer treatment facility is different from the pollutant addressed within this
TMDL and the categorical TSS limit given in the NPDES permit will comply with this TMDL. The TSS
component of municipal and sanitary sewer treatment discharges is composed of organic material and not
stream sedimentation due to soil erosion during wet weather events. The pollutant of concern for this TMDL
is sediment from landuse runoff and in-channel processes, consistent with discharges associated with
construction activities and MS4s. There are no facilities whose effluent have the potential to be relevant to
this TMDL.
5.2 Load Allocations
The LA developed for this TMDL is an estimation of the acceptable contribution of all nonpoint sources in
the watershed. Channel processes and upland sources both contribute to the sediment loading of the
waterbody. Examples of potential nonpoint sources of sediment include agricultural activities, silviculture
activities, surface mining activities, gullies, in-channel and instream sources, roads, and construction
activities not regulated by NPDES permits.
For the waterbody to attain the applicable narrative water quality standard for sediment, the allowable range
of sediment loads is 0.0004 to 0.0019 tons per acre per day at the effective discharge for ecoregion 65.
Tombigbee River Basin____________________________________________________________ 31_________________________________Sediment TMDL for Tombigbee River Basin
5.3 Incorporation of a Margin of Safety (MOS)
The two types of MOS development are to implicitly incorporate the MOS using conservative assumptions
or to explicitly specify a portion of the total TMDL as the MOS. The MOS selected for this TMDL is
implicit. The use of conservative procedures provides a sufficient implicit MOS. These conservative
procedures include the use of a stable stream as the target and the use of the effective discharge flow, the
flow that produces the most sediment transport.
5.4 Calculation of the TMDL
As stated above, the pollutant of concern for this TMDL is sediment from landuse runoff and in-channel
processes. The LA includes the contributions from the channel and surface runoff from the watershed. The
MOS for this TMDL is implicit and derived from the conservative assumptions incorporated into this
methodology. This TMDL is given in Table 12.
Table 12: Tombigbee River Basin Sediment Total Maximum Daily Load
Subwatershed WLA LA MOS TMDL
Chinchahoma Creek 0 11.7 Implicit 11.7
Unnamed Tributary to Catalpa Creek 0 1.8 Implicit 1.8
Unnamed Tributary to Gilmer Creek 0 1.2 Implicit 1.2
Shaw Creek 0 1.7 Implicit 1.7
Spring Creek 0 5.5 Implicit 5.5
Yellow Creek 0 21.0 Implicit 21.0
*tons per day at the effective discharge
5.5 Seasonality
The use of data collected throughout the year at multiple stations in each ecoregion to set the target
addresses seasonal variation. Instantaneous flow and suspended-sediment data were used to develop the
TMDL targets for each ecoregion. These data were collected throughout the year and would account for
all seasons of the calendar year, changing atmospheric conditions (including rainy and dry seasons and high
and low temperatures), and the periods representative of critical conditions.
Tombigbee River Basin____________________________________________________________ 32_________________________________Sediment TMDL for Tombigbee River Basin
6.0 CONCLUSION
The estimated existing loading of sediment for the listed waterbodies are higher than the TMDL target loads
seen in Table 13. Therefore, it is recommended that the waterbody be considered for streambank and
riparian buffer zone restoration and any sediment reduction BMPs, especially for the road crossings,
agricultural activities, and construction activities. The implementation of these BMP activities should
reduce the sediment load to the waterbody. The reduction of the sediment load to equal that of a relatively
stable stream will allow the stream to approach stable conditions. This will provide improved habitat for
the support of aquatic life in the waterbody and will result in the attainment of the applicable water quality
standards.
Table 13: Tombigbee River Basin Sediment Loads
Subwatershed Ecoregion Area (Acres) Estimated TMDL* %
Load* Reduction
Chinchahoma Creek 65 15,610.34 31.22 to 11.7 62.5% to
842.96 98.6%
Unnamed Tributary to 65 2,410.08 4.82 to 130.14 1.8 62.7% to
Catalpa Creek 98.6%
Unnamed Tributary to Gilmer 65 1,730.90 3.46 to 93.47 1.2 62.3% to
Creek 98.6%
Shaw Creek 65 2,290.45 4.58 to 123.68 1.7 62.9% to
98.6%
Spring Creek 65 7,350.81 14.70 to 5.5 62.6% to
396.94 98.6%
Yellow Creek 65 28,023.30 56.05 to 21.0 62.5% to
1,513.26 98.6%
*tons per day at the effective discharge
This TMDL recommends that BMPs used to control the sediment be analyzed using SSC methodologies to
ensure attainment of the target yields, which were established using SSC methodologies. While it is
understood that monitoring is not a part of general permits for construction activities, the TMDL
recommends that samples collected on sediment-impaired streams be analyzed for SSC as ecoregion loads
derived by the National Sedimentation Laboratory were used to derive the target for this sediment TMDL.
6.1 Future Activities
MDEQ has adopted the Basin Management Approach, a plan that divides Mississippi’s major drainage
basins into four groups. Each of these basin groups is configured to represent approximately one-fourth of
the state. The Basin Management Approach strategy is supported by various water quality monitoring
activities that take place as part of the program support monitoring conducted by MDEQ and other
resource partners that augments the statewide ambient monitoring network with supplemental monitoring
sites in the large drainage basins. One objective of program support monitoring is to increase the total
coverage of waters monitored in Mississippi and fill data gaps identified in the planning phase of the
basin cycle. Concentrating monitoring and assessment resources in specific drainage basins maximizes
sampling efficiency to achieve this objective and enhances collaboration among participating resource
agencies. These waterbodies in the Tombigbee River Basin may receive additional monitoring to identify
Tombigbee River Basin____________________________________________________________ 33_________________________________Sediment TMDL for Tombigbee River Basin any changes or improvements in water quality. MDEQ recommends that any monitoring conducted in conjunction with the implementation of BMPs in this watershed be analyzed for SSC to ensure consistency with the TMDL target. For land disturbing activities related to silviculture, construction, and agriculture, it is recommended that practices, as outlined in Mississippi’s BMPs: Best Management Practices for Forestry in Mississippi (MFC, 2000), Planning and Design Manual for the Control of Erosion, Sediment, and Stormwater (MDEQ, et. al, 2011), and Field Office Technical Guide (NRCS, 2000) be followed, respectively. 6.2 Public Participation This TMDL will be published for a 30-day public notice. During this time, the public will be notified by publication in both a statewide and local newspaper. The public will be given an opportunity to review the TMDL and submit comments. MDEQ also distributes all TMDLs at the beginning of the public notice to those members of the public who have requested to be included on a TMDL mailing list. TMDL mailing list members may request to receive the TMDL reports through either, email or the postal service. Anyone wishing to become a member of the TMDL mailing list should contact Shawn Clark at sclark@mdeq.ms.us. At the end of the 30-day period, MDEQ will determine the level of interest in the TMDL and make a decision on the necessity of holding a public meeting. All comments received during the public notice period and at any public meeting become a part of the record of this TMDL. All comments will be considered in the ultimate completion of this TMDL for submission of this TMDL to EPA Region 4 for final approval. Tombigbee River Basin____________________________________________________________ 34
_________________________________Sediment TMDL for Tombigbee River Basin

                                          DEFINITIONS

Aggradation: The raising of the bed of a watercourse by the deposition of sediment.

Allocations: That portion of a receiving water’s loading capacity that is attributed to one of its existing or
future pollution sources (nonpoint or point) or to natural background sources.

Ambient Stations: A network of fixed monitoring stations established for systematic water quality
sampling at regular intervals, and for uniform parametric coverage over a long-term period.

Anthropogenic: Pertains to the [environmental] influence of human activities.

Assimilative Capacity: The amount of contaminant load that can be discharged to a specific stream or
river without violating the provisions of the State of Mississippi Water Quality Criteria for Intrastate,
Interstate, and Coastal Waters and Water Quality regulations. Assimilative capacity is the extent to which
a body of water can receive wastes without significant deterioration of beneficial uses.

Background: Ambient pollutant concentrations due to natural sources, nearby sources other than the one
currently under consideration, and unidentified anthropogenic sources.

Background Levels: Levels representing the chemical, physical, and biological conditions that would
result from natural geomorphological processes such as weathering or dissolution.

Bank Full Stage: Stage of flow at which a stream fills its channel up to level of its bank. Recurrence interval
averages 1.5 to 2 years.

Bedload Sediment: Portion of sediment load transported downstream by sliding, rolling, bouncing along
the channel bottom. Generally consists of particles >1 mm.

Best Management Practices (BMPs): (1) The methods, measures, or practices selected by an agency to
meet its nonpoint source control needs. BMPs include but are not limited to structural and nonstructural
controls and operation and maintenance procedures. BMPs can be applied before, during, or after pollution-
producing activities to reduce or eliminate the introduction of pollutants into receiving waters. (2) Methods
have been determined to be the most effective, practical means of preventing or reducing pollution from
nonpoint sources.

Tombigbee River Basin____________________________________________________________ 35
_________________________________Sediment TMDL for Tombigbee River Basin Calibration: Testing and tuning of a model to a set of field data. Also includes minimization of deviations between measured field conditions and output of a model by selecting appropriate model coefficients. Channel: (1) A natural stream that conveys water; a ditch or channel excavated for the flow of water. (2) The water-filled groove through which runoff water flows. In a narrow valley the channel may include the entire valley floor, but ordinarily it occupies only a small fraction of the valley. Channel Improvement: The improvement of the flow characteristics of a channel by clearing, excavation, realignment, lining, or other means in order to increase its capacity. Sometimes used to connote channel stabilization. Channel Stabilization: Erosion prevention and stabilization of velocity distribution in a channel using jetties, drops, revetments, vegetation, and other measures. Channelization: Straightening and deepening streams so that water will move faster, a marsh-drainage tactic that can interfere with waste assimilation capacity, disturb fish and wildlife habitats, and aggravate flooding. Clean Sediment: Sediment that is not contaminated by chemical substances. Pollution caused by clean sediment refers to the quantity of sediment, as opposed to the presence of pollutant-contaminated sediment. Critical Condition: The critical condition can be thought of as the “worst case” scenario of environmental conditions in the waterbody in which the loading expressed in the TMDL for the pollutant of concern will continue to meet water quality standards. Critical conditions are the combination of environmental factors (e.g., flow, temperature, etc.) that results in attaining and maintaining the water quality criterion and has an acceptably low frequency of occurrence. Cross-Sectional Area: Wet area of a waterbody normal to the longitudinal component of the flow. Daily Discharge: The discharge of a pollutant measured during a 24-hour period that reasonably represents the day for purposes of sampling. For pollutants with limitations expressed in units of mass, the daily discharge is calculated as the total mass of the pollutant discharged over the day. For pollutants with limitations expressed in other units of measurement, the daily discharge is calculated as the average measurement of the pollutant over the day. Tombigbee River Basin____________________________________________________________ 36
You can also read