Transport Coefficients of Quark Gluon Plasma - Viljami Leino Péter Petreczky, Indico

Page created by Chris Reid
 
CONTINUE READING
Transport Coefficients of Quark Gluon Plasma - Viljami Leino Péter Petreczky, Indico
Transport Coefficients
                 of
        Quark Gluon Plasma

                       Viljami Leino
Nora Brambilla,         Péter Petreczky,         Antonio Vairo
  Technische Universität München, Brookhaven National Laboratory

          RU-A: Fundamental Particles and Forces
                     Research Day
                      20.10.2020
Transport Coefficients of Quark Gluon Plasma - Viljami Leino Péter Petreczky, Indico
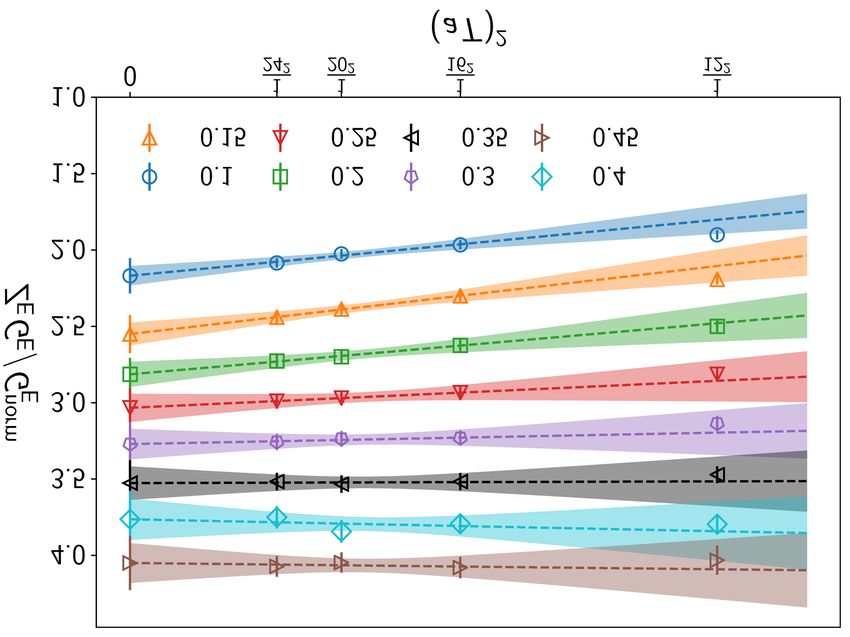
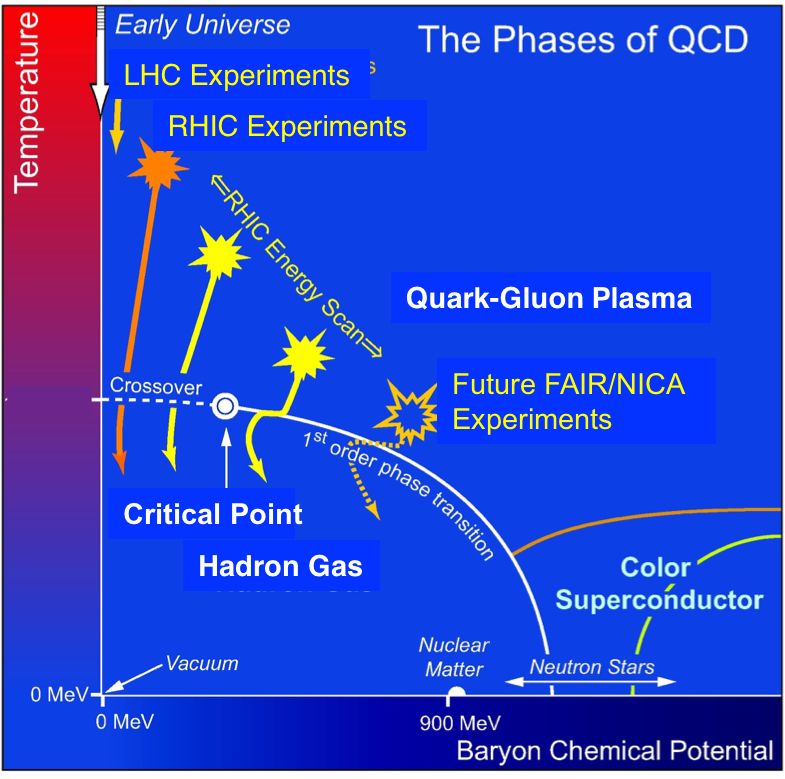
Heavy Ion Collisions and Phase Diagram

 • Understanding  the  strongly
   coupled Quark Gluon Plasma
   (QGP) generated at particle
   accelerators

 • Ultra-relativistic collisions of hea-
   vy nuclei at particle accelerators
   produce hot and dence fireball

 • A strongly coupled medium

Figure from: T. Nayak (2020)               1 / 15
Transport Coefficients of Quark Gluon Plasma - Viljami Leino Péter Petreczky, Indico
Transport Coefficients

• The QGP can be described in terms of transport coefficients such as:
   • Shear viscosity          • Electric conductivity
   • Diffusion coefficient    • Transverse momentum distribution q̂

• Usually real time quantities, need special attention on lattice:
    • Only Euclidean observables can be defined on lattice
   → need to invert spectral function
    • Transport peaks make measurements difficult,
      especially at higher quark masses the peaks become sharp
• Related to observables measured experimentally such as RAA and ν2

                                                                         2 / 15
Transport Coefficients of Quark Gluon Plasma - Viljami Leino Péter Petreczky, Indico
Diffusion Coefficient

 • We don’t have RAA and ν2 direct-

                                           2 πTD s
                                                                                                                T)
                                                                                                            α s(
                                                          Lattice QCD                                  LO
                                                                                                  D
                                                                                                C                pQCD LO α S=0.4
   ly in our theories, instead different                   Ding et al.
                                                           Banerjee et al.
                                                                                             pQ

                                                     30
   (hydrodynamical) models depend                          Kaczmarek et al.

   on spatial diffusion coefficient Dx                                                   T-Matrix V=
                                                                                                     F
                                                     20

                                                                                                                                       - LV
 • Observed ν2 is larger than expec-                                                                                       (Cata
                                                                                                                                nia)

                                                               D-
                                                                                                                     QPM

                                                                 m
                                                                    es
                                                          D-

                                                                      on
                                                                                                                    PHSD
   ted from kinetic models but in                    10

                                                           m

                                                                         (T
                                                                                                      =U                    ia) - B
                                                                                                                                    M

                                                            es
                                                                                              trix V

                                                                            AM
                                                                                         T-Ma                        (Catan

                                                               on
                                                                                                                 QPM

                                                                             U)
                                                                                                                            ayesian)

                                                                 (O
                                                                                                                    Duke (B

                                                                    zv
   good agreement with hydrodyna-

                                                                      en
                                                                         c
                                                                         hu
                                                                                         MC@sHQ                                AdS/CFT

                                                                           k)
                                                      0
   mic models                                                                1     1.5                          2
                                                                                  T/T c
 • Indicates the medium has fluidlike properties

 • RAA tells how heavy quarks see the nuclear medium

Figure from: X. Dong CIPANP (2018)                                                                                           3 / 15
Transport Coefficients of Quark Gluon Plasma - Viljami Leino Péter Petreczky, Indico
Heavy Quark in medium

   • Heavy quark energy doesn’t change much in collision with a
     thermal quark                     √
                       Ek ∼ T , p ∼ MT  T

   • HQ momentum is changed by random kicks from the medium
      → Brownian motion; Follows Langevin dynamics
              dpi      κ
                  =−      pi + ξi (t) , hξ(t)ξ(t 0 )i = κδ(t − t 0 )
              dt      2MT
   • Heavy quark momentum diffusion coefficient κ related to many
     interesting phenomena
          Such as: Spatial diffusion coefficient Ds = 2T 2 /κ,
                   Drag coefficient ηD = κ/(2MT ),
                                                        −1
                   Heavy quark relaxation time τQ = ηD

Moore and Teaney PRC71 (2005), Caron-Huot and Moore JHEP02 (2008)      4 / 15
Transport Coefficients of Quark Gluon Plasma - Viljami Leino Péter Petreczky, Indico
Quarkonium in medium
 • Quarkonium in QGP (environment energy scale πT )
                         1
                 M         πT  E , τR  τE ∼ 1/π
                        a0
 • HQ mass M, Bohr radius a0 , binding energy E , correlation time τE
 • Quarkonium in fireball can be described by Limbland equation
                                                             
           dρ                X
                                        n   m†   1 m† n
              = −i[H, ρ] +       hnm Li ρLi − {Li Li , ρ}
           dt                n,m
                                                 2

 • All terms depend on two free parameters κ and γ
 • κ turns out to be the heavy quark diffusion coefficient and related to
   thermal width Γ(1S) = 3a02 κ
 • γ is correction to the heavy quark-antiquark potential and related to
   mass shift δM(1S) = 2a02 γ/3
 • Unquenched lattice measurements of Γ(1S) and δM(1S) available

Brambilla et.al.PRD96 (2017), Brambilla et.al.PRD97 (2018)                  5 / 15
Transport Coefficients of Quark Gluon Plasma - Viljami Leino Péter Petreczky, Indico
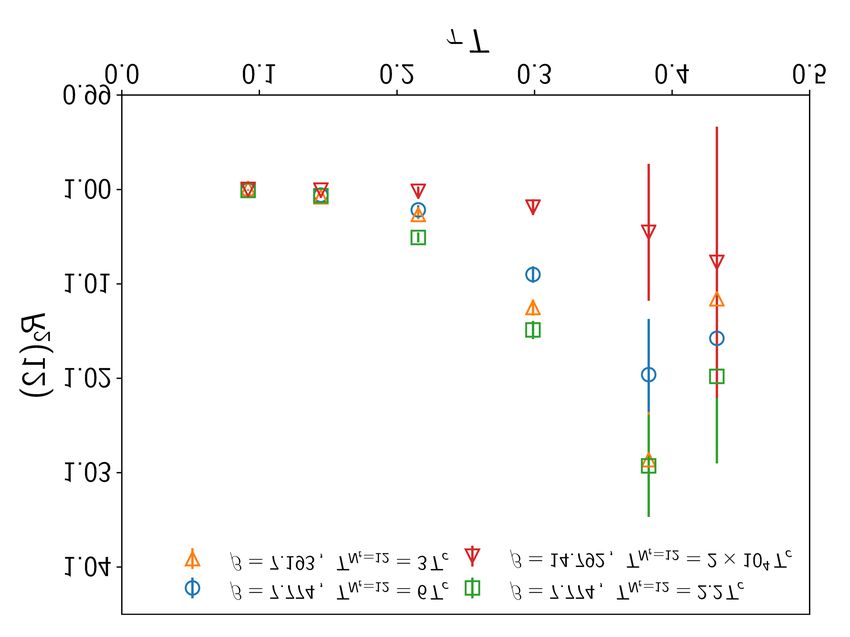
Importance of non-perturbative κ determination

                                                            g 4 Cf Nc
                                                                                           
                                                       κ                         2T      mE
                                                        3
                                                          =                   ln    +ξ +    C
                                                      T        18π               mE      T
                                                            ξ ' −0.64718 ,           C NLO ' 2.3302

                                                                   κ ∈ {κL (T),κC (T),κU (T)}, γ = -1.75, Tf = 250 MeV
                                                            1.0
                                                                                                                       Υ(1s)
                                                                                                                       Υ(2s)
                                                            0.8
                                                                                                                       Υ(3s)

 • Huge perturbative variation                              0.6

                                                      RAA
   ⇒ needs non-perturbative measu-
                                                            0.4
   rements
 • Also large scale dependence                              0.2

   trough mE = g (µ)T                                       0.0
 • κ has considerable effect on RAA                            0           100             200             300                400
                                                                                           Npart

Moore and Teaney PRC71 (2005), Caron-Huot and Moore JHEP02 (2008), RAA fig by P. Vander Griend                       6 / 15
Heavy quark diffusion from lattice

• Traditional approach using current correlators has transport peak
• HQEFT inspired Euclidean correlator free of transport peaks
                                3
                                X hRe Tr [U(1/T , τ )Ei (τ, 0)U(τ, 0)Ei (0, 0)]i
                GE (τ ) = −
                                            3 hRe Tr U(1/T , 0)i
                                i =1

• To get momentum diffusion coefficient κ, a spectral function ρ(ω)
  needs to be reversed:
                                                                            ω            1
                    ∞
                                                                                             
                                                                    cosh          τT −
                Z
                        dω                                                  T            2
    GE (τ ) =              ρ(ω, T )K (ω, τ T ) ,    K (ω, τ T ) =                  ω
                                                                                     
                0        π                                                 sinh   2T

                                                  2T ρ(ω)
                                       κ = limω→0
                                                     ω
• Measure using the multilevel algorithm in pure gauge (quenched)
• Compared to earlier studies we measure extremely wide range of
  temperatures
• Create model ρ(ω) by matching to perturbation theory at high T
• Invert the spectral function equation by varying the model ρ
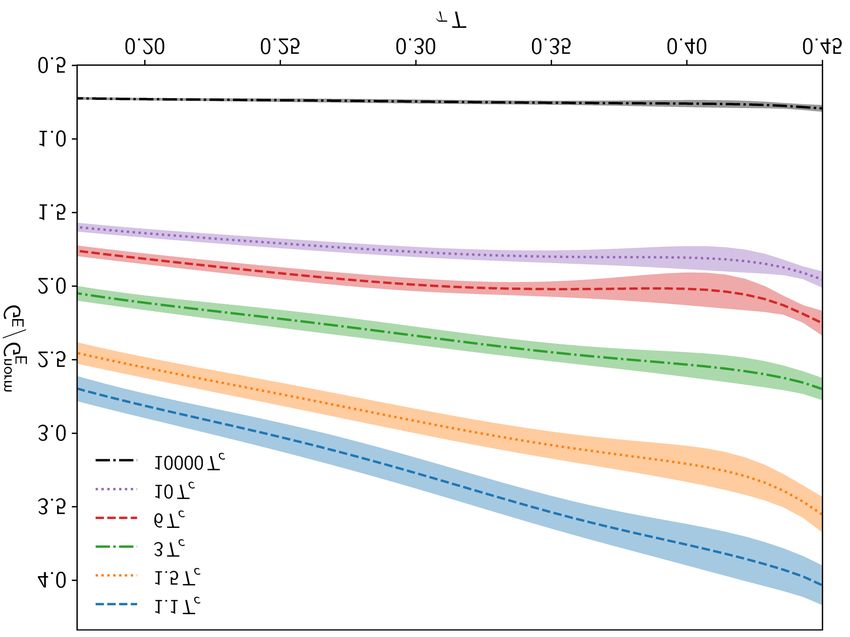
                                                                                                  7 / 15
Lattice correlator

          105
                                         483×24   T   =1.1Tc
                                         483×24   T   =1.5Tc
          104                            483×24   T   =3Tc
                                         483×24   T   =6Tc
                                         483×24   T   =10Tc
          103
                                         483×24   T   =10000Tc
 ZE G E

          102

          101

          100
            0.0   0.1   0.2        0.3            0.4            0.5
                              τT

          • Normalize lattice data with the LO Perturbative result:

                                                              cos2 (πτ T )
                                                                                             
                                                                                    1
                              GEnorm = π 2 T 4                             +
                                                              sin4 (πτ T )   3 sin2 (πτ T )

          • Perform tree-level improvement by matching lattice and continuum
            perturbation theories
Caron-Huot et.al.JHEP04 (2009), Francis et.al.PoSLattice (2011)                                   8 / 15
When do thermal effects start

                                          
                            GE (Nt , β)       GE (2Nt , β)
                  R2 (Nt ) = norm                           .
                            GE (Nt )          GEnorm (2Nt )
 • On small physical separation every T shares a scaling
   (apart from finite size effects)
 • Thermal effect nonexistent for τ < 0.10, then grow
                                                                9 / 15
Continuum limit and finite size effects

 • Use 3 largest lattices for continuum limit
 • Systematic include tadpole and extrapolations with and without
   Nt = 12 point or a4 term.
 • Finite size effects are in control, we can go without extrapolation.

                                                                          10 / 15
High Temperature

                                                0.68
                                                              Continuum limit / 1.2
                                                0.66          ρNLO
                                                              step LO
                                                0.64

                                    GE/GEnorm
                                                0.62

                                                0.60

                                                0.58

                                                0.56
                                                       0.20        0.25       0.30    0.35   0.40       0.45
                                                                                 τT

 • NLO spectral function works only at very high temperatures
 • Different ansatze have different ω ∼ T behavior
 • Good matching between perturbation theory and lattice

                                                                                                    11 / 15
κ extraction

                  1.10                                                                 1.01
                                 ρNLO
                                  step
                                 ρNLO
                                  line (0.01,2.2)                                      1.00
                  1.05
ZEGE/(CNGENLO+)

                                                                     ZEGE/(CNGENLO+)
                                                                                       0.99
                  1.00
                                                                                       0.98

                  0.95                                                                 0.97

                                                                                       0.96
                  0.90
                                                                                       0.95         ρNLO
                                                                                                     step
                  0.85                                                                              ρNLO
                                                                                                     line (0.01,2.2)
                                                                                       0.94
                         0.1               0.2           0.3   0.4                            0.1             0.2           0.3     0.4
                                                    τT                                                                 τT

                               • Take continuum limit of the lattice data
                               • Normalize with different models for spectral function
                               • Extract κ as all values that normalize to unity in
                                 0.19 ≥ τ T ≥ 0.45

                                                                                                                                  12 / 15
Lattice results for Ds

                    30                                      NLO              Brambilla 2019
                                                            Banerjee 2012    ALICE 2018
                                                            Francis 2015     Our result
                                                            Ding 2012
                    20
            2πDsT

                    10

                     0
                         1.0           1.5              2.0            2.5          3.0
                                                        T /Tc

      • On low temperature close to Tc , agreement with other results,
        including ALICE

Brambilla et al 2020: Accepted to PRD, hep-lat/2007.10078                                     13 / 15
Lattice results for κ

                    5                                                            fit
                                                                                 NLO
                    4                                                            Our result
            κ/T 3

                    3

                    2

                    1

                    0
                        100            101                  102          103            104
                                                        T /Tc

 • Unprecedented temperature range:                         κNLO   g 4 CF Nc
                                                                             
                                                                                 2T      mE
                                                                                            
                                                                 =            ln    +ξ+C      .
   T = 1.1 − 104 Tc                                          T3       18π        mE      T

 • Can fit temperature dependence C = 3.81(1.33)
Brambilla et al 2020: Accepted to PRD, hep-lat/2007.10078                                         14 / 15
Conclusions and Future prospects

 • We have measured κ in wide range of temperatures and fitted the
   temperature dependence

 • Observe κ/T 3 decreasing when T increases, similar to perturbation
   theory

 • Future prospects:
     • Measure γ
     • Implement gradient flow to go un-quenched
     • 1/M corrections
     • Other operators?

                                                                     15 / 15
Thank You

            15 / 15
You can also read