Trophic position and foraging ecology of Ross, Weddell, and crabeater seals revealed by compound-specific isotope analysis
←
→
Page content transcription
If your browser does not render page correctly, please read the page content below
Vol. 611: 1–18, 2019 MARINE ECOLOGY PROGRESS SERIES
Published February 14
https://doi.org/10.3354/meps12856 Mar Ecol Prog Ser
OPEN
ACCESS
FEATURE ARTICLE
Trophic position and foraging ecology of Ross,
Weddell, and crabeater seals revealed by
compound-specific isotope analysis
Emily K. Brault1,*, Paul L. Koch2, Daniel P. Costa3, Matthew D. McCarthy1,
Luis A. Hückstädt3, Kimberly T. Goetz4, Kelton W. McMahon5, Michael E. Goebel6,
Olle Karlsson7, Jonas Teilmann8, Tero Harkonen7, 9, Karin C. Harding10
1
Ocean Sciences Department, University of California, Santa Cruz, 1156 High Street, Santa Cruz, CA 95064, USA
2
Earth and Planetary Sciences Department, University of California, Santa Cruz, 1156 High Street, Santa Cruz, CA 95064, USA
3
Ecology and Evolutionary Biology, University of California, Santa Cruz, 100 Shaffer Road, Santa Cruz, CA 95064, USA
4
National Institute of Water and Atmospheric Research, 301 Evans Bay Parade, Wellington 6021, New Zealand
5
Graduate School of Oceanography, University of Rhode Island, 215 S Ferry Rd, Narragansett, RI 02882, USA
6
Antarctic Ecosystem Research Division, NOAA Fisheries, Southwest Fisheries Science Center, 8901 La Jolla Shores Dr.,
La Jolla, CA 92037, USA
7
Department of Environmental Research and Monitoring, Swedish Museum of Natural History, Box 50007, 104 05 Stockholm, Sweden
8
Department of Bioscience - Marine Mammal Research, Aarhus University, Frederiksborgvej 399, 4000 Roskilde, Denmark
9
Martimas AB, Höga 160, 442 73 Kärna, Sweden
10
Department of Biological and Environmental Sciences, University of Gothenburg, Box 463, 405 30 Gothenburg, Sweden
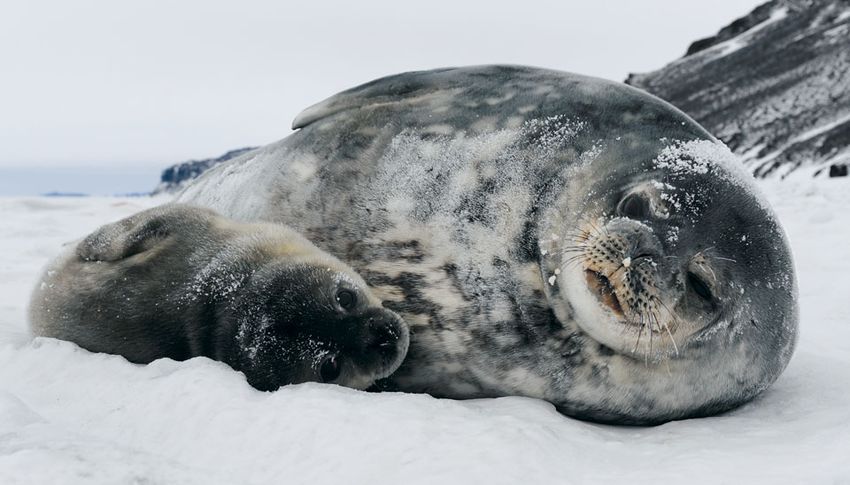
ABSTRACT: Ross seals Ommatophoca rossii are one
of the least studied marine mammals, with little
known about their foraging ecology. Research to date
using bulk stable isotope analysis suggests that Ross
seals have a trophic position intermediate between
that of Weddell Leptonychotes weddellii and crab-
eater Lobodon carcinophaga seals. However, con-
sumer bulk stable isotope values not only reflect
trophic dynamics, but also variations in baseline
isotope values, which can be substantial. We used
compound-specific isotope analysis of amino acids
(CSI-AA) to separate isotopic effects of a shifting
Weddell seal female and her pup in McMurdo Sound,
baseline versus trophic structure on the foraging Antarctica.
ecology of these ecologically important Antarctic Photo: Daniel P. Costa
pinnipeds. We found that Ross seals forage in an
open ocean food web, while crabeater and Weddell
seals forage within similar food webs closer to shore. with a krill-dominated diet. Our results redefine the
However, isotopic evidence suggests that crabeater view of the trophic dynamics and foraging ecology of
seals are likely following sea ice, while Weddell seals the Ross seal, and also highlight the importance of
target productive areas of the continental shelf of quantifying baseline isotope variations in foraging
West Antarctica. Our CSI-AA data indicate that Ross studies.
seals have a high trophic position equivalent to that
of Weddell seals, contrary to prior conclusions from KEY WORDS: Ross seal · Weddell seal · Crabeater
nitrogen isotope results on bulk tissues. CSI-AA indi- seal · Compound-specific isotopes · Amino acids ·
cates that crabeater seals are at a trophic position Antarctica · Foraging ecology · Trophic dynamics
lower than that of Ross and Weddell seals, consistent
© The authors 2019. Open Access under Creative Commons by
Attribution Licence. Use, distribution and reproduction are un-
*Corresponding author: ebrault@ucsc.edu restricted. Authors and original publication must be credited.
Publisher: Inter-Research · www.int-res.com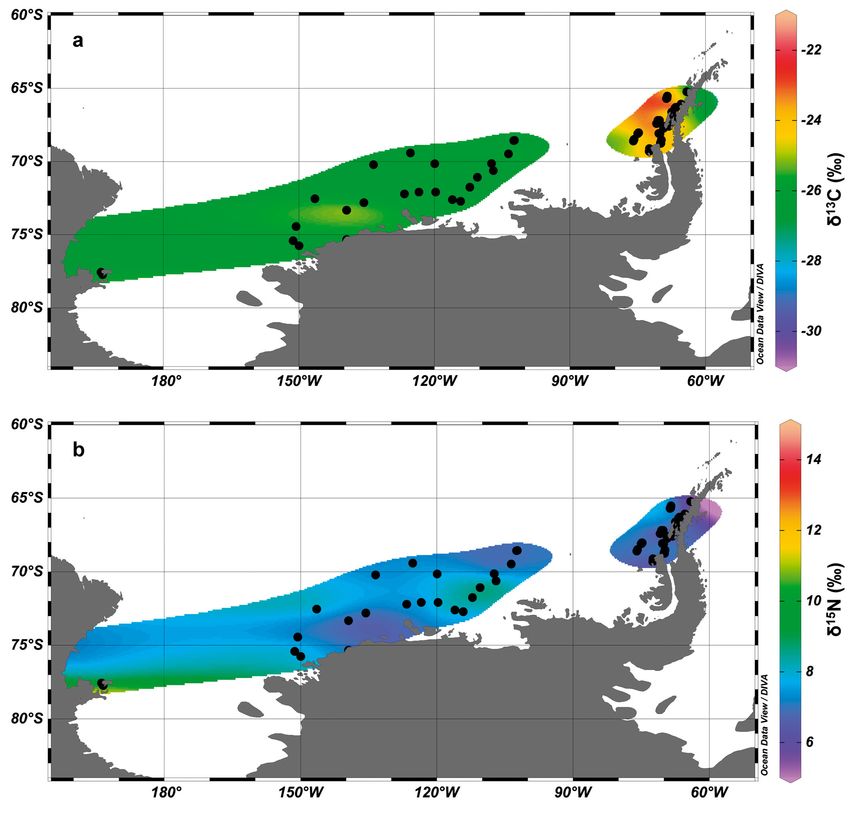
2                                        Mar Ecol Prog Ser 611: 1–18, 2019

                1. INTRODUCTION                            predator’s diet, perhaps 1 to 2 d (Dellinger & Trill-
                                                           mich 1988, Burns et al. 1998). In addition, soft tissues
   The Ross seal Ommatophoca rossii is one of the          are more completely digested than hard tissues, re-
least studied marine mammals (Bengtson et al. 2011,        sulting in biases towards prey with indigestible hard
Würsig et al. 2018). The total population estimate for     parts (Burns et al. 1998, Staniland 2002, Arim & Naya
this species is around 200 000, considerably less than     2003, Yonezaki et al. 2003). Given these drawbacks,
the estimates for other Antarctic true seals, which are    recent research on Antarctic seal ecology has often
approximately one million individuals for Weddell          used bulk stable isotope values.
seals Leptonychotes weddellii and 10 to 15 million            Measurements of bulk tissue stable carbon (δ13C)
individuals for crabeater seals Lobodon carcino-           and nitrogen (δ15N) isotope values (i.e. the weighted
phaga (Laws 1977, Bengtson et al. 2011, Würsig et al.      average of all components within a tissue) have been
2018). All 3 of these pinniped species have circum-        used to indicate a predator’s foraging region and
polar distributions (Laws 1977, Würsig et al. 2018).       trophic position (Boecklen et al. 2011). The δ13C and
Ross seals have fairly small and narrow bodies (with       δ15N values of a consumer are the isotopic values of
body masses up to about 250 kg) with short snouts          primary producers, the base of the food web, with
and small mouths. Weddell and crabeater seals are          modifications resulting from each trophic transfer,
generally larger than Ross seals, having body masses       when energy is transferred from one trophic level to
up to about 600 kg (Würsig et al. 2018). Weddell seals     another (e.g. Lorrain et al. 2009, Graham et al. 2010,
have bulkier bodies with small heads relative to their     Jaeger et al. 2010, Brault et al. 2018). These modifica-
body sizes and short snouts, while crabeater seals         tions are predictable and described further below
have slender bodies with long, upturned snouts. Ross       (Minagawa & Wada 1984). Stable isotope analysis
seals are not commonly observed, which is likely           has the advantage of providing an integrated view of
because they spend most of their time at sea and in        an animal’s diet over longer time scales (weeks to
habitats that are logistically challenging to access       years depending on the tissue) than the traditional
(Laws 1977, Würsig et al. 2018). Thus, several key         procedures (Vander Zanden et al. 2015). Carbon iso-
aspects of Ross seal biology remain poorly under-          tope values show little 13C-enrichment with trophic
stood, including their preferred prey, foraging habi-      transfer. Thus, consumer δ13C values are often thought
tat, and behavior. In contrast, many studies have          to closely reflect values at the base of food webs,
been conducted on crabeater and Weddell seals, and         making them useful for studying the foraging areas
thus more information is available on their ecology        of a predator. Spatial changes in the δ13C of primary
(Hückstädt et al. 2012a, Arcalís-Planas et al. 2015,       producers (often referred to as ‘baseline’ δ13C values)
Goetz et al. 2017).                                        may reflect variations in their environmental condi-
   Diets of Antarctic predators, such as Ross, Weddell,    tions, such as dissolved inorganic carbon δ13C values,
and crabeater seals, may consist of various fish,          dissolved CO2 concentrations, CO2 drawdown, and
cephalopods, and zooplankton species (Laws 1977,           temperature (reviewed in McMahon et al. 2013).
Pinkerton et al. 2010). Possible fish prey include         They may also reflect physiological characteristics of
Antarctic toothfish Dissotichus mawsoni, Antarctic         the primary producers, including internal biological
silverfish Pleuragamma antarcticum, and cod ice-           parameters (e.g. growth rate) and structure (e.g. cell
fishes Trematomus spp. Glacial squid Psychroteuthis        size and geometry of phytoplankton) (McMahon et
glacialis is a cephalopod and known diet component         al. 2013). Provided the primary processes driving
of some Antarctic consumers. Antarctic krill Euphau-       variation are known, bulk δ13C values of an animal
sia superba are key prey for an array of predators.        can give valuable information on its foraging habitat.
Other krill species, such as ice krill E. crystal-         The Southern Ocean is known to have considerable
lorophias may contribute to their diets. In the sub-       spatial variation in baseline δ13C (δ13Cbaseline) values
sequent text, ‘krill’ refers to various species within     (Rau et al. 1982, Quillfeldt et al. 2010, Brault et al.
the order Euphausiacea. Krill are crustaceans that         2018). Several studies have observed decreasing
are largely herbivorous and form the link between          δ13C values with increasing latitude, with offsets be-
primary producers (phytoplankton in marine systems)        tween about 55 and 79° S of approximately 3 ‰,
and apex predators.                                        largely reflecting variations in sea surface tempera-
   Conventional techniques for studying an animal’s        ture (Rau et al. 1982, Graham et al. 2010, Quillfeldt et
diet, such as scat and stomach content analysis, have      al. 2010, Magozzi et al. 2017, Brault et al. 2018).
significant limitations when applied to Antarctic pin-        In contrast to carbon isotopes, trophic transfers
nipeds. These methods capture only a snapshot of a         have a considerable affect on an animal’s δ15N val-
Brault et al.: Antarctic seal foraging ecology                                3

ues. Since a consumer’s tissues become enriched in             studies suggesting that D. mawsoni may comprise
15
  N by ~2−5 ‰ with each trophic transfer (e.g. pri-            nearly the entire daily diet of Weddell seals during
mary producers to herbivores to carnivores) due to             the spring and summer in McMurdo Sound (Plötz
the preferential loss of 14N during amino acid metab-          1986, Ponganis & Stockard 2007, Ainley & Siniff
olism (Minagawa & Wada 1984), δ15N values are                  2009, Goetz et al. 2017). Hard parts of D. mawsoni
often used to indicate an animal’s trophic position.           are not consumed and thus not detected via scat and
Yet variations in baseline (i.e. primary producer) δ15N        stomach content analyses, techniques that have been
(δ15Nbaseline) values also occur and are passed on, with       used for much of the prior research on Weddell seal
additional change due to trophic transfers, to upper           foraging ecology (see Goetz et al. 2017). Recently,
trophic level predators (McMahon et al. 2013). Nutri-          Goetz et al. (2017) assessed Weddell seal foraging
ent source (e.g. nitrate, ammonium, or N2 fixation),           ecology with bulk δ13C and δ15N measurements of
microbial transformations (e.g. denitrification), and          vibrissae and red blood cells from Ross Sea speci-
extent of nitrogen pool drawdown in a given environ-           mens. They reported considerable individual vari-
ment can all strongly impact primary producers and,            ability in diet, and that P. antarcticum and Trema-
therefore, the δ15Nbaseline values (reviewed in Mc-            tomus spp. were the primary prey consumed by
Mahon et al. 2013). If variations in these factors are         Weddell seals. Overall, D. mawsoni contribute less
well understood, then the bulk δ15N values of a con-           than 2% to the Weddell seal diet. However, D. maw-
sumer can provide insights into its foraging region            soni may become increasingly important with age
and trophic position (Post 2002). As with carbon,              and at certain times in the life cycle, such as during
substantial spatial variations in δ15Nbaseline values          reproduction and molting, since this fish has a high
occur in the Southern Ocean (DiFiore et al. 2006,              fat content and energy density (Goetz et al. 2017).
2009, Somes et al. 2010, Jaeger et al. 2010, Brault et         Additionally, Goetz et al. (2017) noted temporal diet
al. 2018). Much of the Southern Ocean has low                  shifts—likely in response to sea ice dynamics affect-
δ15Nbaseline values, likely due to less complete nutrient      ing prey abundances.
drawdown (Somes et al. 2010, Brault et al. 2018).                 Crabeater seals occupy a much lower trophic level
However, areas near the Antarctic continent have               than Weddell seals, with diets dominated by E.
extensive coastal open water polynyas, which are               superba, as evidenced by the results of both scat and
often productivity ‘hot spots’ (Arrigo & van Dijken            stomach content analyses as well as bulk isotopic
2003). These ‘hot spots’ experience more complete              analysis (Laws 1977, Rau et al. 1992, Burns et al.
nutrient drawdown and, thus, higher δ15Nbaseline               2004, 2008, Zhao et al. 2004, Aubail et al. 2011).
values (DiFiore et al. 2006, 2009, Brault et al. 2018).        Recent work by Hückstädt et al. (2012a) revealed
Indeed, coastal regions may have δ15Nbaseline values           temporal variability in crabeater seal diet composi-
that are up to ~3 ‰ higher than those in open ocean            tion via bulk δ13C and δ15N measurements of vibris-
regions (DiFiore et al. 2006, 2009, Brault et al. 2018).       sae. The E. superba contribution ranged from 81 to
In summary, a gradient of increasing δ15Nbaseline val-         95%, likely in response to climate shifts affecting its
ues from open ocean to coastal Antarctic areas likely          abundances. The authors also reported significant
derives from increasing nutrient drawdown due to               variation in δ13C values with body mass (increasing
enhanced primary productivity, the main process                δ13C values with increasing body mass) and season
influencing δ15Nbaseline values in the Southern Ocean          (highest δ13C values in the austral winter) that they
since it is a high-nutrient−low-chlorophyll (HNLC)             suggested might result from changes in δ13Cbaseline
region (Brault et al. 2018).                                   values associated with temporal and/or spatial shifts
   Although much remains unknown, especially re-               between open ocean phytoplankton and sea ice dia-
garding the behaviors and movements of the Ross                toms (Hückstädt et al. 2012a). As sea ice diatoms have
seal, recent studies have furthered our understand-            higher δ13C values than those of open ocean diatoms,
ing of Antarctic seal ecology. Isotopic measurements,          increasing δ13C values with increasing crabeater seal
coupled with traditional ecological methods, have              body mass may indicate a greater use with age of a
indicated that Weddell seals forage near the top of            food web based on sea ice diatoms rather than open
the Antarctic food web, consuming diverse diets of             ocean diatoms (Hückstädt et al. 2012a). Likewise,
fish, cephalopods, and invertebrates (Burns et al. 1998,       high crabeater seal δ13C values in the austral winter
Plötz et al. 2001, Lake et al. 2003, Goetz et al. 2017).       may show heavy use of a sea ice diatom based food
Researchers have debated the contribution of upper             web during this season (Hückstädt et al. 2012a).
trophic level prey species, in particular D. mawsoni,             Only a small number of studies have examined
to Weddell seal diets (Goetz et al. 2017), with some           Ross seal foraging ecology. Dive records suggest that
4                                          Mar Ecol Prog Ser 611: 1–18, 2019

these animals typically dive from 100 to 300 m (max-         δ15N values can be disentangled using this technique
imum depth of 792 m) in search of mesopelagic squid          (Ohkouchi et al. 2017). Glutamic acid + glutamine
and fish, depths that are similar to those undertaken        (Glu) and phenylalanine (Phe) are widely considered
by Weddell seals and greater than those typically            the most representative trophic and source amino
performed by crabeater seals (Bengtson & Stewart             acids, respectively, with Phe δ15N values typically
1997, Blix & Nordøy 2007). Analysis of Ross seal             used as a proxy for baseline isotope values, and Phe
stomach contents showed that P. antarcticum and P.           and Glu δ15N values (δ15NPhe and δ15NGlu, correspond-
glacialis were found in varying proportions (Skinner         ingly) of a consumer used together to estimate its
& Klages 1994). Arcalís-Planas et al. (2015) sug-            trophic position (TP) based on the unique δ15Nbaseline
gested little use of sea ice by Ross seals, based on         value of its environment (Ohkouchi et al. 2017). Pro-
telemetry and remote sensing data. Seals tracked by          line (Pro) has also been shown to be a reliable trophic
Arcalís-Planas et al. (2015) generally remained in the       amino acid, with less variability than Glu for trophic
                                                             15
open ocean except for haul outs on ice to molt (from           N-enrichment factors between organisms (McMa-
December to January) and breed (from late October            hon et al. 2015). As a consequence, Pro and Phe may
to mid-November). During their open ocean period of          represent a new CSI-AA combination that provides
February to mid-October, Ross seals remained an              more ecologically realistic TP estimates for higher
average of ~840 km (range 587 to 1282 km) seaward            trophic level consumers, including marine mammals,
from the ice edge (Arcalís-Planas et al. 2015). Bulk         although we do not yet understand the underlying
δ13C and δ15N isotope measurements place the Ross            mechanism (McMahon & McCarthy 2016). As men-
seal a trophic level intermediate between Weddell            tioned above, trophic discrimination factors (TDFs)
seals and crabeater seals (Rau et al. 1992, Zhao et al.      using Pro appear to be less variable than those with
2004, Aubail et al. 2011). Thus, bulk stable isotope         Glu (McMahon et al. 2015). This difference may be
results to date suggest that Ross seals consume              a result of Pro having a more consistent metabolic
mostly squid and fish, such as P. antarcticum and P.         pathway through the internal nitrogen cycle than
glacialis, but with a contribution from lower trophic        Glu (McMahon & McCarthy 2016)
level prey like E. superba (Rau et al. 1992, Zhao et            Here, we report the first CSI-AA data for modern
al. 2004, Aubail et al. 2011).                               Ross, Weddell, and crabeater seals to refine our
  While these bulk stable isotope approaches have            understanding of the trophic dynamics and foraging
shed new light on the foraging ecology of Antarctic          ecology of these important Antarctic predators. In
pinnipeds, it is critical to remember that the Southern      particular, CSI-AA allows us to directly examine
Ocean exhibits strong spatial gradients in both              changes in δ15Nbaseline values linked to these seals’
δ13Cbaseline and δ15Nbaseline values (DiFiore et al. 2006,   diets, to gain information on their foraging regions in
2009, Jaeger et al. 2010, Somes et al. 2010, Brault et       conjunction with their trophic dynamics. Comparison
al. 2018), suggesting that we likely need to explicitly      of amino acid isotope data from these 3 Antarctic
tease apart the relative influences of trophic dynam-        seals will also further our understanding of present
ics and baseline variation on seal isotope values. For       Antarctic food web structures, which will provide
instance, Ross seals may spend more time in the open         valuable ecosystem baselines in light of ongoing cli-
ocean than other Antarctic seals (Arcalís-Planas et al.      mate change (Atkinson et al. 2004, Ducklow et al.
2015), and thus forage in areas with lower δ15Nbaseline      2007, 2012, Montes-Hugo et al. 2009).
values than the nearshore regions used by Weddell
and crabeater seals (DiFiore et al. 2006, 2009, Brault
et al. 2018). If so, not accounting for spatial variation               2. MATERIALS AND METHODS
in the δ15Nbaseline values would result in Ross seals
being assigned a lower trophic position than species                           2.1. Sample collection
foraging nearer the continent.
  Compound-specific isotopic analysis of amino                 Tissue samples from Ross (n = 15), Weddell (n = 38),
acids (CSI-AA) has opened new doors to studying the          and crabeater seals (n = 41) were collected along
foraging ecology and trophic dynamics of marine              Western Antarctica from the West Antarctic Penin-
predators (e.g. Graham et al. 2010). Since only              sula (WAP) to the Ross Sea during multiple field
certain amino acids become enriched in 15N with              seasons in the austral summers of 2008/2009 and
increasing trophic level (‘trophic’ amino acids),            2010/2011 aboard the RV ‘Oden’. These animal cap-
while others (‘source’ amino acids) do not, impacts of       tures were conducted in accordance with the reg-
δ15Nbaseline variation and trophic position on consumer      ulations of the Swedish Polar Research Secretariat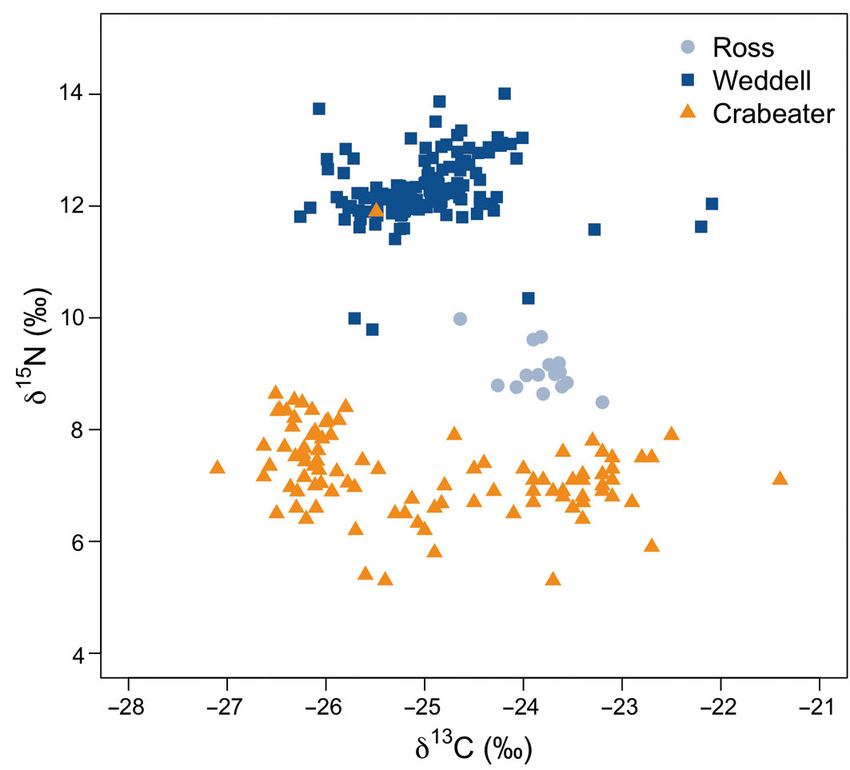
Brault et al.: Antarctic seal foraging ecology                                 5

(Registration No. 2010-112). All other samples were           from 3 recently deceased juvenile crabeater seals that
obtained from animal captures conducted under                 were found on the seasonal pack ice around Cape
National Marine Fisheries Service permit No. 87-              Royds in the austral summer of 2009/2010. Whole
1851-00. In most cases, body mass, age class (juve-           blood was sampled, using the protocol of Goetz et
nile, subadult, and adult), gender, and location were         al. (2017), from a male adult crabeater seal found in
recorded for each sampled seal (Table S1 in the               Erebus Bay during the austral summer of 2010/2011.
Supplement at www.int-res.com/articles/suppl/m611
p001_supp.pdf). Additionally, the Institutional Ani-
mal Care and Use Committee (IACUC) at the Univer-                              2.2. Sample preparation
sity of Santa Cruz (UC Santa Cruz) approved all pro-
tocols for these samples.                                        After sample collection, all samples were kept
   Whole blood samples were obtained from most                frozen at −20°C. Blood samples were freeze-dried
seals, and in some cases, clot (blood with serum              with a Labconco Freeze Dry System (Lyph Lock 4.5)
removed), red blood cells (RBCs; whole blood                  and homogenized manually prior to isotope analysis.
exposed to an anticoagulant, heparin, before having           Lipid extraction was not performed on the blood
plasma removed), and hair samples were also col-              samples, as blood has a relatively low lipid content. A
lected (Tables S1 & S2). The sampling protocols are           test set of blood samples with and without lipid
described in Aubail et al. (2011) and Goetz et al.            extraction revealed no significant effect of lipid
(2017). Whiskers were taken from crabeater seals              extraction on blood δ13C values (Table S3), though
during multiple cruises on the RV ‘Lawrence M.                lipid extraction did have an undesired impact on δ15N
Gould’ along the WAP during fall 2001 (n = 7), winter         values (Table S3).
2001 (n = 7), fall 2002 (n = 15), winter 2002 (n = 14),          Since hair and whisker samples are known to have
and fall 2007 (n = 9). Plasma was also obtained from          surficial contaminants that may affect δ13C values,
a few of the fall 2007 individuals (G105, G110, and           these samples were lipid extracted as described
G112) (Hückstädt et al. 2012a). In addition, serum or         in Hückstädt et al. (2012a). These samples were
plasma was obtained from 2 Weddell seals during the           washed with Milli-Q water (Thermo Fisher Scientific)
fall 2007 sampling in this region, and whiskers were          and then rinsed 3 times in an ultrasonic bath with
taken from 2 WAP Weddell seals in the austral sum-            petroleum ether for 15 min.
mer of 2009/2010. Whisker samples were also col-
lected from Weddell seals during the summer 2009/
2010 (n = 11), summer 2010/2011 (n = 10), summer                          2.3. Bulk stable isotope analysis
2011/2012 (n = 18) (Goetz et al. 2017). Hückstädt et
al. (2012a) described the procedure for sampling the             For all blood and hair samples, ~1 mg was weighed
whiskers, and Goetz et al. (2017) described the proto-        into tin cups (Costech; 3 × 5 mm) for bulk stable
col used for collecting seal blood.                           carbon and nitrogen isotope analysis. For hair, the
   Several blood samples were obtained from Weddell           follicle was removed since prior work has shown it to
seals in the McMurdo Sound region, Ross Sea,                  have a different biochemical and isotopic composi-
Antarctica over multiple field seasons. A total of 12         tion than the rest of the hair (Hückstädt et al. 2012b).
whole blood samples were taken from juvenile Wed-             This analysis was performed at the Stable Isotope
dell seals near Inexpressible Island (74.9° S, 163.7° E)      Lab (SIL) of the University of California, Santa Cruz
during the austral summer of 2010/2011. Whole blood           (UCSC) on a Carlo Erba EA 1108 elemental analyzer
samples were taken from Weddell seals in the austral          coupled to a Thermo-Finnigan DeltaPlus XP isotope
summer of 2010/2011 (n = 5) and austral spring of             ratio mass spectrometer. The δ13C values were refer-
2012 (n = 5). RBCs were sampled in the austral sum-           enced to the V-PDB standard, and δ15N values were
mer of 2009/2010 (n = 5), austral summer of 2011/             referenced to air. PUGel and Acetanilide standards
2012 (n = 5), and austral spring of 2012 (n = 5). Whole       were analyzed in each instrument session in order to
blood, plasma, and serum were obtained from 5 Wed-            correct for variations in mass across samples and
dell seals sampled in the austral spring of 2015, and         instrument drift. Across 10 analytical sessions, the
whole blood from an additional 7 Weddell seals was            standard deviations were 0.1 ‰ (n = 139) for δ13C,
also acquired during this time. Goetz et al. (2017) de-       0.1 ‰ (n = 139) for δ15N, and 0.1 (n = 139) for C/N
scribed the sampling protocol for these Weddell seals.        (atomic) for PUGel and 0.2 ‰ (n = 38) for δ13C, 0.2 ‰
   Lastly, a few samples were obtained from crabeater         (n = 38) for δ15N, and 0.4 (n = 38) for C/N (atomic) for
seals in McMurdo Sound. Hair samples were taken               acetanilide.
6                                       Mar Ecol Prog Ser 611: 1–18, 2019

     2.4. Compound-specific isotope analysis              whole blood that had significant isotopic offsets from
                                                          whole blood. An isotopic offset > 0.2 ‰ was consid-
  To obtain the δ15N values of amino acids from mod-      ered significant, since the instrument error is ≤0.2 ‰.
ern seal tissues, CSI-AA was performed at UCSC via        Bulk stable isotope data pre- and post-application of
gas chromatography-combustion-isotope ratio mass          correction factors are presented in Table S8. No cor-
spectrometry (GC-C-IRMS). All samples were pre-           rection factors were applied to CSI-AA data since
pared for GC-C-IRMS analysis using the methods            these values are for individual amino acids, isolated
described in McCarthy et al. (2007, 2013). In brief,      from different tissues, typically whole blood (Table S2).
samples (~1 mg) were hydrolyzed (6 N HCl for 20 h           All data analyses were performed in R statistical
at 110°C) and converted to trifluoro-acetylated iso-      software (R Core Team 2014). Tests of normality and
propyl amino acid derivatives. Samples were stored        equal variance were conducted to assure test as-
at −20°C in a 1:3 TFAA:DCM (trifluoroacetic anhy-         sumptions were met. In a few cases, an assumption
dride: methylene chloride) solution until analysis.       was violated and a data transformation was applied,
Immediately before the analysis, the TFAA/DCM             as noted in ‘Results’. Bulk stable isotope values of the
mixture was evaporated under N2 and samples were          3 different seal species were compared with a 1-way
diluted in ethyl acetate.                                 analysis of variance (ANOVA) and post hoc Bonfer-
  Amino acid δ15N values were measured on a               roni pairwise comparisons. Data were Box-Cox trans-
Thermo Trace GC coupled to a Thermo-Finnigan              formed (Box & Cox 1964). A 4-way ANOVA with post
DeltaPlus XP isotope-ratio-monitoring mass spectrom-      hoc Bonferroni pairwise comparisons was used to test
eter (oxidation furnace at 980°C and reduction fur-       for significant effects of gender, sampling period, age
nace at 650°C) using an SGE Analytical Science            class, and region (WAP, Amundsen Sea, and Ross
BPX5 column (60 m by 0.32 mm with a 1 μm film             Sea) on the bulk isotopic values of Ross, Weddell, and
thickness). The injector temperature was 250°C with       crabeater seals. Both Weddell and crabeater seal
a split He flow of 2 ml min−1. The GC temperature         data were Box-Cox transformed. Linear regression
program was as follows: initial temperature of 70°C       analyses were used to test for significant relation-
for 1 min; ramp 1 = 10°C min−1 to 185°C, hold for         ships between bulk δ13C and δ15N values and body
2 min; ramp 2 = 2°C min−1 to 200°C, hold for 10 min;      mass for each species.
ramp 3 = 30°C min−1 to 300°C, hold for 6 min. Directly      A 1-way ANOVA with post hoc Bonferroni pair-
measured amino acid δ15N values were corrected            wise comparisons was used to test for significant dif-
based on bracketed external standards of amino            ferences in the δ15N values of each amino acid among
acids with known isotopic composition, as described       the 3 seal species. This same procedure was con-
in McCarthy et al. (2013). The δ15N values of 11          ducted to compare the δ15N values for each category
amino acids were quantified: alanine (Ala), glycine       of amino acid (i.e. source or trophic) among the dif-
(Gly), threonine (Thr), serine (Ser), valine (Val),       ferent seal species. For both Weddell and crabeater
leucine (Leu), isoleucine (Iso), Pro, aspartic acid +     seals, a 2-tailed Student’s t-test was used to compare
asparagine (Asp), Glu, Phe, and lysine (Lys). We note     the δ15N values of Pro, Glu, and Phe for the WAP to
that hydroxyproline (Hpro) may have co-eluted with        those of a combined Amundsen and Ross Sea region
Pro during our amino acid δ15N analysis. However,         (‘Amundsen/Ross Sea’ in the subsequent text). Amino
Hpro was either not present in, or composed a small       acid δ15N values for seals from the Amundsen/Ross
portion of (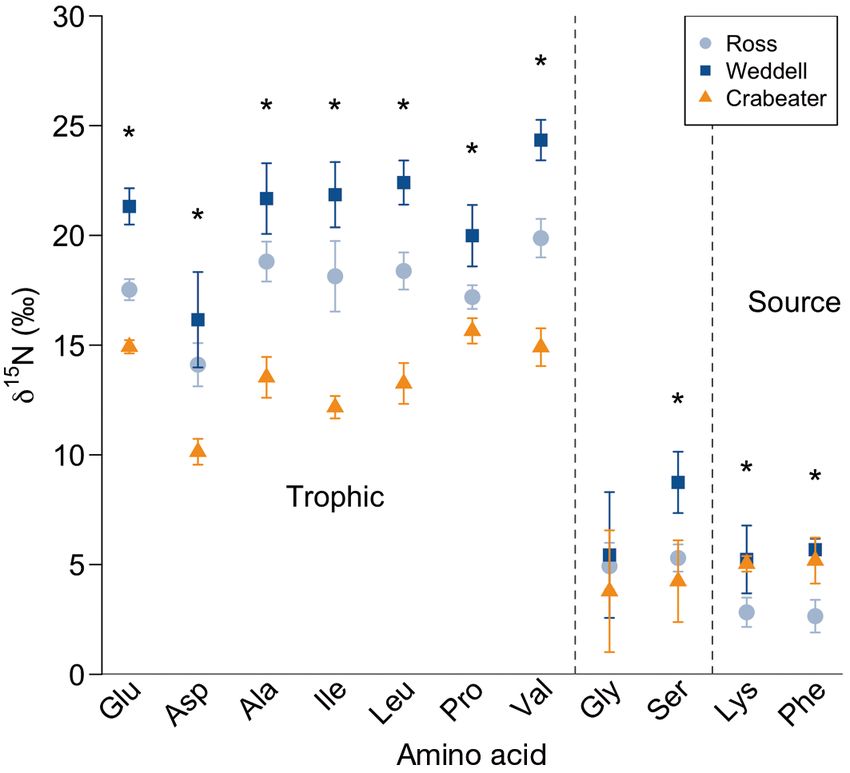
Brault et al.: Antarctic seal foraging ecology                                         7

originally proposed by Chikaraishi et al. (2009).                 using Data Interpolating Variational Analysis (DIVA)
Here, we substituted Pro for Glu as the trophic amino             gridding software (Barth et al. 2010) to show spatial
acid, as suggested by the comparative synthesis of                patterns in bulk δ13C and δ15N values, as well as
TPCSI-AA methods in McMahon & McCarthy (2016),                    δ15NPhe and δ15NPro. The DIVA gridding is highly opti-
because Pro trophic discrimination appears to be                  mized, relying on a finite-element resolution that
less variable across variations in diet. McMahon &                accounts for the distance between analysis and data
McCarthy (2016) suggest that this new equation                    (observation constraint), the regularity of the analysis
will likely produce more ecologically realistic TP                (smoothness constraint) and physical laws (behavior
estimates for marine mammals. TPCSI-AA was, there-                constraint).
fore, calculated as follows:
TPCSI–AA = 1 + [(δ15NPro – δ15NPhe – βPro/Phe) / TDFPro-Phe]
                                                                                         3. RESULTS
where δ15NPro is the seal Pro δ15N value, βPro/Phe is the
isotopic difference between Pro and Phe in marine                   3.1. Bulk δ13C and δ15N values of Ross, Weddell,
phytoplankton (3.1 ‰; Chikaraishi et al. 2009), and                               and crabeater seals
TDFPro-Phe is the trophic discrimination between diet
and consumer for Pro minus the same for Phe (Δ15NPro                Multiple tissue types for Antarctic seals were used
− Δ15NPhe = 4.5 ‰; McMahon & McCarthy 2016). Dif-                 to measure bulk δ13C and δ15N values. Corrections
ferences in TPCSI-AA, as well as the offsets between              were applied to all bulk stable isotope data from tis-
δ15NPro and δ15NPhe (δ15NPro-Phe) values, among the 3             sues that were not whole blood, the most common
seal species were determined with a 1-way ANOVA                   sample type, that had significant isotopic offsets
with post hoc Bonferroni pairwise comparisons using               from whole blood (see ‘Materials and methods’ and
data for individuals only from the Ross and Amundsen              Tables S4−S7 for further details). Bulk δ13C and δ15N
Seas to reduce the effect of location on our findings.            values varied significantly among the 3 species
Differences in TPCSI-AA and δ15NPro-Phe values between            (Fig. 1, Tables 1 & S8). Ross seals had significantly
the WAP versus Amundsen and Ross Seas were de-                    higher δ13C values than both Weddell seals and
termined with a 2-tailed Student’s t-test for Weddell             crabeater seals (Bonferroni p < 0.001; Fig. 1, Table 1).
and crabeater seals. For all statistical analyses, a              All seals had δ15N values significantly different from
result was considered significant if p < 0.05.                    each other: crabeater seals < Ross seals < Weddell
  Lastly, color-shaded contour maps were produced                 seals (Bonferroni p < 0.001; Fig. 1, Table 1). We found
in Ocean Data View (ODV) v.4.7.4 (Schlitzer 2015)                 no consistent relationships between bulk stable

Table 1. Measurements, mean ± SD (n), for Antarctic seals from study sites in West Antarctica. WAP: West Antarctic Peninsula;
Phe: phenylalanine; Pro: Proline; TPCSI-AA: trophic position estimates using compound-specific isotope analysis of amino
                                                acids; –: data not available

 Measurement            Region                            Ross seal               Weddell seal              Crabeater seal

 Bulk δ13C (‰)          All                           −23.8 ± 0.3 (15)            −25.0 ± 0.6 (125)         −25.0 ± 1.4 (97)
                        WAP                                 –                     −22.9 ± 0.9 (4)           −24.0 ± 1.1 (52)
                        Amundsen Sea                  −23.8 ± 0.3 (14)            −24.7 ± 0.4 (21)          −26.1 ± 0.4 (35)
                        Ross Sea                        −23.8 (1)                 −25.1 ± 0.5 (100)         −26.1 ± 0.5 (10)
 Bulk δ15N (‰)          All                              9.1 ± 0.4 (15)            12.3 ± 0.6 (125)           7.2 ± 0.8 (97)
                        WAP                                  –                     11.4 ± 0.7 (4)             6.8 ± 0.6 (52)
                        Amundsen Sea                     9.1 ± 0.4 (14)            12.3 ± 0.9 (21)            7.6 ± 0.6 (35)
                        Ross Sea                            8.6 (1)                12.3 ± 0.5 (100)           8.0 ± 1.4 (10)
 Phe δ15N (‰)           All                              2.7 ± 0.7 (6)              5.7 ± 0.5 (6)             5.2 ± 1.0 (6)
                        WAP                                  –                      5.7 ± 0.4 (3)             4.3 ± 0.4 (3)
                        Amundsen/Ross Sea                2.7 ± 0.7 (6)              5.7 ± 0.7 (3)             6.0 ± 0.7 (3)
 Pro δ15N (‰)           All                             17.2 ± 0.5 (6)             20.0 ± 1.4 (6)            15.6 ± 0.6 (6)
                        WAP                                  –                     19.1 ± 1.5 (3)            15.9 ± 0.5 (3)
                        Amundsen/Ross Sea               17.2 ± 0.5 (6)             20.9 ± 0.5 (3)            15.4 ± 0.6 (3)
 TPCSI-AA               All                              3.5 ± 0.2 (6)              3.5 ± 0.4 (6)             2.6 ± 0.3 (6)
                        WAP                                  –                      3.3 ± 0.4 (3)             2.9 ± 0.1 (3)
                        Amundsen/Ross Sea                3.5 ± 0.2 (6)              3.7 ± 0.1 (3)             2.4 ± 0.2 (3)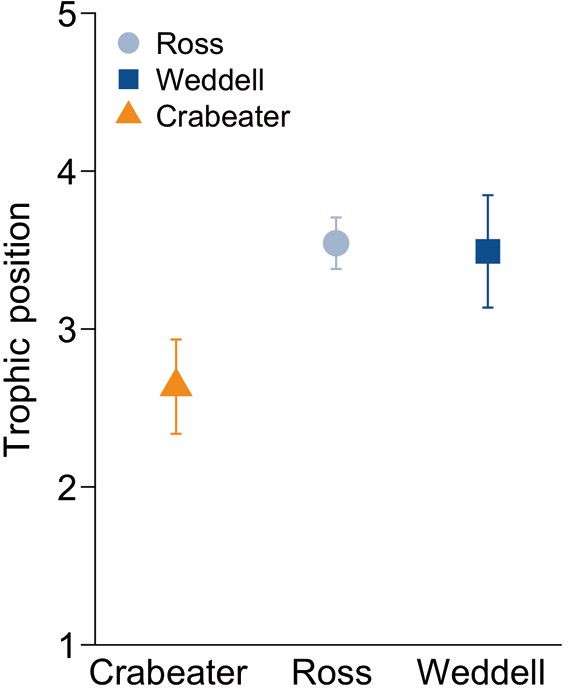
8                                             Mar Ecol Prog Ser 611: 1–18, 2019

                                                                     3.3. Compound-specific δ15N values of Ross,
                                                                            Weddell, and crabeater seals

                                                                   As mentioned above, CSI-AA data were derived
                                                                 from multiple tissue types; see Tables S1, S2 & S9 for
                                                                 details. We did not apply corrections to these data as
                                                                 with bulk stable isotope data since these isotopic val-
                                                                 ues were from individual amino acids, isolated from
                                                                 different tissues, most commonly from whole blood.
                                                                 The nitrogen isotope values were significantly differ-
                                                                 ent among at least 2 of the 3 seal species for all amino
                                                                 acids, except Gly (Figs. 4 & S2, Tables S9 & S10). For
                                                                 most trophic amino acids (Glu, Ala, Ile, Leu, Pro, and
                                                                 Val), the δ15N values differed significantly among all 3
                                                                 species, with Weddell seals > Ross seals > crabeater
                                                                 seals (Tables S8 & S9). For example, the δ15NPro values
                                                                 of Weddell seals were significantly greater than those
                                                                 of Ross and crabeater seals (Bonferroni p < 0.001 for
                                                                 both tests; Table 1). The δ15NPro values of Ross seals
Fig. 1. Bulk δ15N values versus δ13C values for Ross, Weddell,   were significantly greater than those of crabeater
and crabeater seals in the West Antarctic. The bulk δ15N val-    seals (Bonferroni p = 0.035; Table 1). For the trophic
ues are from whole blood, with the application of stable iso-    amino acid Asp, crabeater seals had significantly
tope corrections for isotope values from tissues that were not   lower δ15N values (mean ± SD: 10.1 ± 0.6 ‰, n = 6)
                          whole blood
                                                                 than Weddell (16.2 ± 2.2 ‰, n = 6) and Ross seals (14.1
                                                                 ± 1.0 ‰, n = 6) (Bonferroni p < 0.001 for both tests). Ad-
isotope values of seals and measures of sampling                 ditionally, the δ15N values among all trophic amino
period, gender, age class, or body mass (see the                 acids were significantly different among all 3 seal
Supplement).                                                     species (Bonferroni p < 0.001 for all tests) with these
                                                                 values decreasing in the manner: Weddell seals
                                                                 (21.1 ± 2.7 ‰, n = 42) > Ross seals (17.7 ± 1.9 ‰, n = 41)
    3.2. Spatial patterns of bulk δ13C and δ15N values           > crabeater seals (13.5 ± 1.9 ‰, n = 42).
                    for Antarctic seals                            The δ15N values were significantly different be-
                                                                 tween at least 2 seal species for both commonly
  Both Weddell and crabeater seals showed signifi-               defined source amino acids: Lys and Phe (Fig. 4,
cant spatial variation in their δ13C values. Weddell             Tables S9 & S10). For Lys, Ross seals had significantly
seal δ13C values were significantly less in the Ross             lower δ15N values (2.8 ± 0.7 ‰, n = 6) than Weddell
Sea and the Amundsen Sea than in the WAP (Bonfer-                (5.2 ± 1.5 ‰, n = 6) and crabeater seals (5.0 ± 0.4 ‰,
roni p ≤ 0.002 for all tests; Fig. 2a, Table 1). Likewise,       n = 6) (Bonferroni p = 0.005 and 0.009, respectively).
the δ13C values of crabeater seals along the WAP                 Likewise, Ross seals had significantly lower δ15NPhe
were significantly higher than those in the Amund-               values than Weddell and crabeater seals (Bonferroni
sen Sea and Ross Sea (Bonferroni p < 0.001 for both              p < 0.001 for both tests; Table 1).
tests; Fig. 3a, Table 1).                                          While Gly and Ser are challenging to accurately
  Unlike their bulk δ13C values, Weddell seals                   categorize in terms of conventional trophic and source
showed no significant differences in bulk δ15N values            groupings (McMahon & McCarthy 2016), we do note
across the 3 regions (Fig. 2b, Table 1). In contrast,            that Ser δ15N values of Weddell seals (8.7 ± 1.4‰, n = 6)
crabeater seals from the WAP had significantly lower             were significantly higher than those of both crabeater
δ15N values than those from the Amundsen Sea and                 (4.2 ± 1.9 ‰, n = 6) and Ross seals (5.3 ± 0.6 ‰, n = 6)
the Ross Sea (Bonferroni p < 0.001 for both tests;               (Bonferroni p < 0.001 and 0.002, respectively; Fig. 4,
Fig. 3b, Table 1). Note that spatial variation in bulk           Tables S9 & S10). No significant differences among
δ13C and δ15N values of Ross seals across West                   the 3 seal species occurred for Gly δ15N values (Fig. 4,
Antarctica could not be examined because all but                 Tables S9 & S10). Ross, Weddell, and crabeater seals
one of the individuals were from the Amundsen Sea                had Gly δ15N values of 4.9 ± 1.1 ‰ (n = 6), 5.4 ± 2.9 ‰
(Fig. S1).                                                       (n = 6), and 3.8 ± 2.8 ‰ (n = 6), respectively.
Brault et al.: Antarctic seal foraging ecology 9
Fig. 2. Spatial variation in the bulk (a) δ13C and (b) δ15N values of Weddell seals. Black dots: sampling locations. Figures were
produced in Ocean Data View v.4.7.4 (Schlitzer 2015)
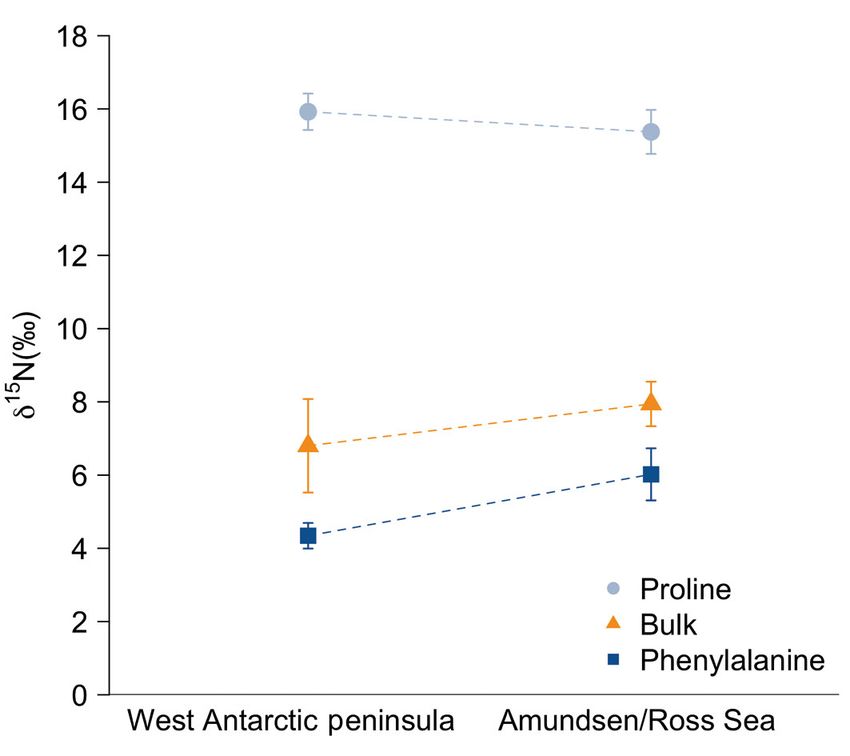
3.4. Spatial patterns of Phe, Pro, and Glu δ15N significantly different between the WAP (15.9 ± 0.5
values for Antarctic seals and 15.0 ± 0.2 ‰, respectively, n = 3 for both) and the
Amundsen/Ross Sea region (15.4 ± 0.6 and 14.8 ±
The δ15NPhe, δ15NPro, and δ15NGlu values of Weddell 0.4 ‰, correspondingly, n = 3 for both; Table 1). As
seals did not differ significantly between the Amund- with the bulk stable isotope values, spatial variation
sen/Ross Sea region and the WAP (Fig. S3, Tables 1, in the δ15N values of source amino acids for Ross seals
S9 & S10). In contrast, crabeater seals had signifi- could not be examined since all but one individual
cantly lower δ15NPhe values in the WAP relative to were from the Amundsen Sea (Fig. S4).
those from the Amundsen/Ross Sea region (2-tailed Crabeater and Weddell seals had similar δ15NPhe for
Student’s t-test p = 0.037; Figs. 5 & 6, Table 1). The animals sampled in the Amundsen/Ross Sea region,
δ15NPro and δ15NGlu values of crabeater seals were not but they were significantly higher than the δ15NPhe for10 Mar Ecol Prog Ser 611: 1–18, 2019
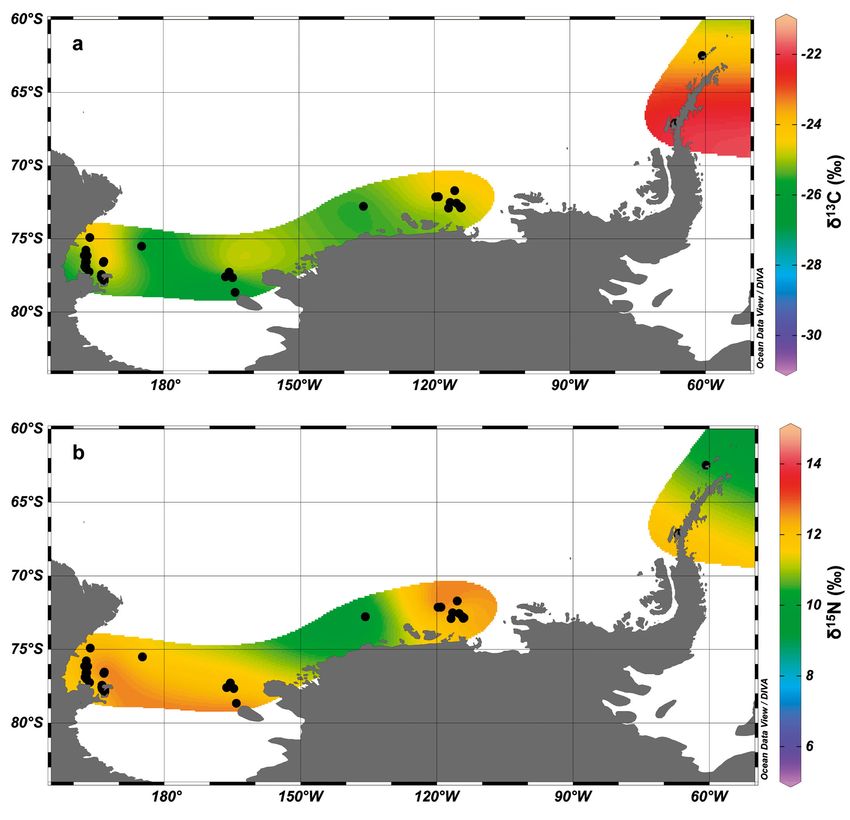
Fig. 3. Spatial variation in the bulk (a) δ13C and (b) δ15N values of crabeater seals. Black dots: sampling locations. Figures were
produced in Ocean Data View v.4.7.4 (Schlitzer 2015)
Ross seals (Bonferroni p < 0.001 for all tests; Table 1). n = 3) seals were significantly greater than that of crab-
However, crabeater seals had significantly lower eater seals (9.4 ± 0.8 ‰, n = 3) (Bonferroni p < 0.001 for
δ15NPhe than Weddell seals for the WAP (2-tailed all tests, restricted to the Amundsen/Ross Sea region
Student’s t-test p = 0.011; Table 1). where all species were collected). Likewise, both Ross
seals and Weddell seals were over a full trophic level
higher than crabeater seals (Bonferroni p < 0.001 for
3.5. TPs of Ross, Weddell, and crabeater seals both tests, restricted to the Amundsen/Ross Sea region
where all species were collected) (Fig. 7, Table 1).
Offsets between δ15NPro and δ15NPhe, indicative of TP, Within species, Weddell seals sampled in the WAP
of Ross (14.5 ± 0.7 ‰, n = 6) and Weddell (15.2 ± 0.7 ‰, (13.4 ± 1.9 ‰, n = 6) had similar δ15NPro-Phe values toBrault et al.: Antarctic seal foraging ecology 11
4. DISCUSSION
Bulk stable isotope values that have been reported
in earlier work on Ross, Weddell, and crabeater seals
support the data in our study (Burns et al. 1998, Zhao
et al. 2004, Aubail et al. 2011, Goetz et al. 2017, Lehn-
ert et al. 2017, Botta et al. 2018), after correction for
isotopic offsets for different tissue types (Table S11).
Our new bulk stable isotope results are especially
valuable for Ross seals since very little isotopic meas-
urements exist to date. Our bulk δ15N values, like
those of prior studies (Rau et al. 1992, Burns et al.
1998, Zhao et al. 2004, Aubail et al. 2011, Cipro et al.
2012, Hückstädt et al. 2012a), all point to Ross seals
being at an intermediate TP between those of Wed-
dell and crabeater seals. In the following discussion
we explore the trophic positions, diets, and foraging
habitats of these 3 seal species using our bulk stable
Fig. 4. Mean (±1 SD) δ15N values of amino acids for Ross, isotope and CSI-AA data. Our CSI-AA data sets per
Weddell, and crabeater seals. Significant differences (p < species are more limited than their corresponding
0.05) among species for an amino acid are indicated with as- bulk stable isotope data sets since — in contrast to
terisks. Glu: Glutamic acid + glutamine; Asp: aspartic acid +
bulk stable isotope analysis — CSI-AA requires ex-
asparagine; Ala: alanine; Ile: isoleucine; Leu: leucine; Pro:
proline; Val: valine; Gly: glycine; Ser: serine; Lys: lysine; tensive analytical processing (see ‘Materials and
Phe: phenylalanine. Amino acids are divided into trophic methods’). Below, we first describe a pattern estab-
and source amino acids, with Gly and Ser categorized sepa- lished with a robust bulk stable isotope data set and
rately as their classification for marine mammals is uncertain then use our novel CSI-AA data to interpret it.
(McMahon & McCarthy 2016)
those of Weddell seals sampled in the Amundsen/ 4.1. Spatial patterns in seal bulk and amino acid
Ross Sea region (15.2 ± 0.7 ‰, n = 6). Thus, Weddell isotope values
seals from both regions also had comparable TPCSI-AA
values for the WAP and Amundsen/Ross Sea region Both Weddell and crabeater seals showed spatial
(Table 1). In contrast, the δ15NPro-Phe values of crab- patterns in their bulk δ13C values. Weddell and
eater seals were significantly greater for individuals crabeater seals had significantly higher δ13C values
sampled in the WAP (11.6 ± 0.3 ‰, n = 6) than those in the WAP than the Amundsen and Ross Seas. As
sampled in the Amundsen/Ross Sea region (9.4 ± this carbon isotope gradient occurs in Weddell and
0.8 ‰, n = 6) (2-tailed Student’s t-test p = 0.033). crabeater seals at different trophic levels, it is likely
Correspondingly, crabeater seals had significantly driven by changes in the δ13Cbaseline values. Prior
higher TPCSI-AA values in the WAP than the Amund- research has shown that δ13C values decrease with
sen/Ross Sea region (2-tailed Student’s t-test p = increasing latitude in the West Antarctic as a result of
0.032; Table 1). For crabeater seals, note that one increasing CO2 solubility with decreasing sea surface
subadult was included along with 5 adult seals in the temperatures (Cherel & Hobson 2007, Quillfeldt et al.
CSI-AA sample set. Although some significant varia- 2010, Brault et al. 2018). Thus, the spatial variation in
tion in the bulk δ15N values was observed across dif- the bulk δ13C values of these 2 species likely predom-
ferent age classes for this species (see the Supple- inantly reflects a latitudinal sea surface temperature
ment), the TPCSI-AA value of the subadult from the gradient in the West Antarctic, with colder tempera-
Amundsen/Ross sea region (2.3) was indistinguish- tures in the higher latitude Amundsen and Ross Sea
able from those of the adults from this region (2.4 ± compared to the warmer, lower latitude WAP. The
0.2, n = 2). Finally, we note that there were some sig- difference in sea surface temperatures of the WAP
nificant differences in the bulk δ15N values of Wed- and Ross Sea (Ducklow et al. 2007, 2012, Smith et
dell seal age classes (discussed in the Supplement), al. 2014) contributes to about a 2 ‰ decrease in the
but only samples from adults were used in our CSI- δ13Cbaseline values from the WAP to the Ross Sea
AA subset. (Brault et al. 2018), similar to the offset between the12 Mar Ecol Prog Ser 611: 1–18, 2019
Fig. 5. Spatial variation in the δ15N values of (a) proline and (b) phenylalanine for crabeater seals. Black dots: sampling
locations. Figures were produced in Ocean Data View v.4.7.4 (Schlitzer 2015)
WAP and Ross Sea bulk δ13C values that we observed detected by previous research, and likely reflects
for Weddell and crabeater seals (2.0 and 2.1 ‰, re- changes from the open ocean to coastal regions
spectively). in nutrient utilization and primary productivity (Di-
Weddell and crabeater seals showed different spa- Fiore et al. 2006, 2009, Brault et al. 2018). A lower
tial patterns in their bulk δ15N values across West δ15Nbaseline — by about 2 ‰ — in the WAP compared to
Antarctica. Weddell seals showed no spatial patterns the Amundsen and Ross Seas was found in a study of
in their bulk δ15N values across the study area, zooplankton (Brault et al. 2018); this is similar to the
whereas crabeater seals had significantly lower bulk difference observed here between WAP and Amund-
δ15N values in the WAP than the Amundsen and Ross sen/Ross Sea crabeater seal δ15NPhe values (1.7 ‰).
Seas. As mentioned above, a spatial gradient in the This difference in the δ15Nbaseline values appears to
δ15Nbaseline values of the Southern Ocean has been reflect the relative proportion of open ocean versusBrault et al.: Antarctic seal foraging ecology 13
with higher δ15Nbaseline values (Arrigo et al. 1998,
2008, DiFiore et al. 2006, 2009, Smith & Comiso 2008,
Alderkamp et al. 2012, Brault et al. 2018).
Continental shelves in Antarctica are especially
productive areas compared to offshore waters since
both light and iron become available for phytoplank-
ton blooms at times of coastal polynya formation and
increased iron inputs from various sources (e.g. melt-
ing glaciers) (Gordon et al. 2000, Alderkamp et al.
2012, Arrigo et al. 2015). Although annual production
in the Amundsen and Ross Seas exceeds that of the
WAP (Arrigo et al. 1998, 2008, Smith & Comiso 2008,
Alderkamp et al. 2012), localized regions in the WAP
may experience high rates of primary productivity
comparable to those within the Amundsen and Ross
Seas. For example, Schmidt et al. (2003) found that
Marguerite Bay in the WAP can be a ‘hot spot’ of pro-
ductivity, as revealed by high phytoplankton and
zooplankton δ15N values.
Fig. 6. Mean (±1 SD) proline δ15N, bulk δ15N, and phenylala-
nine δ15N values for crabeater seals. The bulk δ15N values While it is probable that the observed spatial differ-
are from whole blood, with the application of stable isotope ences in the Weddell and crabeater seal bulk δ15N
corrections for isotope values from tissues that were not values reflect δ15Nbaseline gradients, spatial patterns in
whole blood the seal bulk δ15N values could be related to shifts
in diet, the δ15Nbaseline values, or both. The δ15NPhe
coastal production across the West Antarctic (DiFiore values of Ross, Weddell, and crabeater seals, on the
et al. 2006, 2009, Brault et al. 2018). The δ15Nbaseline other hand, reflect the δ15Nbaseline values — likely
values likely increase from open ocean to coastal driven by spatial gradients in nutrient utilization
areas due to increasing productivity and nutrient and primary productivity— without the confounding
drawdown towards the continent in the summer factor of trophic fractionation. As such, the spatial
(DiFiore et al. 2006, 2009, Brault et al. 2018). The changes in the δ15Nbaseline values in West Antarctica
WAP, with its narrow shelf, likely has a greater influ- are useful for deducing the relative foraging habitats
ence from open ocean waters beyond the continental of Weddell and crabeater seals. Weddell seals from
margin, whereas the Amundsen Sea and Ross Sea the WAP to the Ross Sea consistently had the highest
have wider, more productive shelf systems consistent δ15NPhe values (5.7 ± 0.4 ‰ for the WAP and 5.7 ±
0.7 ‰ for the Amundsen/Ross Sea region, n = 3 in
both cases) within the overall range of δ15NPhe for all
Antarctic seals (1.90 to 6.81 ‰). This suggests that
Weddell seals throughout West Antarctica follow a
similar foraging behavior in which they predomi-
nantly target coastal and, likely, productive areas
(i.e. with the highest δ15Nbaseline values; Brault et al.
2018) given our understanding of West Antarctic
δ15Nbaseline gradients. Satellite tracking data of differ-
ent seal species in this region support this hypothe-
sis. Costa et al. (2010) used satellite data to show that
in the WAP, Weddell seals (unlike crabeater seals)
moved minimally, foraging almost exclusively in the
likely highly productive coastal fjords (Schmidt et al.
2003, DiFiore et al. 2006, 2009). Goetz (2015), like-
wise, found that Weddell seal movements did not
Fig. 7. Mean (±1 SD) trophic position estimates for crabeater,
Ross, and Weddell seals from the Amundsen and Ross Seas. extend beyond the Ross Sea continental shelf.
Trophic positions were calculated based on the proline and In contrast to Weddell seals, the crabeater δ15NPhe
phenylalanine δ15N values values varied significantly across West Antarctica,14 Mar Ecol Prog Ser 611: 1–18, 2019 with higher values in the Amundsen and Ross Seas north to the open ocean south of the Antarctic Polar versus the WAP. These data indicate that crabeater Front. These Ross seals stayed in that area until Octo- seals have greater foraging habitat flexibility than ber when they traveled south into the pack ice (Blix & Weddell seals, and thus may use a wider range of Nordøy 2007). Similarly, Arcalís-Planas et al. (2015) productivity regimes. Weddell and crabeater seals showed via satellite-tracking data that Ross seals also had significantly different δ15Nbaseline values for minimally use sea ice, hauling out for only short peri- the WAP, which was not observed for the Amund- ods each year to molt (December to January) and sen/Ross Sea region, pointing to environmental het- breed (late October to mid-November). They reported erogeneity in the WAP. Our current knowledge of that Ross seals moved from 587 to 1282 km off the ice crabeater seals indicates that this seal heavily con- edge during much of the year (Arcalís-Planas et al. sumes E. superba (Laws 1977, Rau et al. 1992, Burns 2015). The low δ15Nbaseline values measured in our et al. 2004, 2008, Zhao et al. 2004, Aubail et al. 2011, study represent independent evidence that Ross Hückstädt et al. 2012a), a krill species with a distribu- seals are indeed spending the majority of each year tion linked to that of sea ice. As a consequence, foraging in less productive, open ocean waters, sepa- crabeater seals likely move on and off the continental rate from the more coastal food webs of the crabeater shelf, depending on the E. superba life cycle stage and Weddell seals. and seasonal ice cover (Nicol 2006). We hypothesize that crabeater seals move across the heterogeneous environments of the WAP, at times of the year incor- 4.2. Reevaluating trophic dynamics of porating the lower off-shelf δ15Nbaseline values, in con- Antarctic seals trast with Weddell seals. Such a movement pattern by crabeater seals is supported by the tracking Differences in regional foraging habitat utilization results of Costa et al. (2010). Since crabeater seals in among seals, as indicated by the variation in the the Amundsen/Ross Sea region have δ15NPhe values δ15Nphe values of Ross seals versus crabeater and more similar to those of Weddell seals from this area, Weddell seals (~3.0 ‰), suggest the need for a re- the same interpretation would suggest that crabeater evaluation of the TP and associated food web ecology seals in this region stay within the wide and produc- for Ross seals. Our compound-specific approach tive continental shelf areas of the Amundsen and allowed us to calculate TPs for these Antarctic seals Ross Seas. Overall, our results indicate that Weddell that accounted for variation in δ15Nbaseline values. We seals have a strong preference for productive coastal found that Ross seals had TPCSI-AA values similar to sites, whereas crabeater seals use more diverse habi- those of Weddell seals, both of which were signifi- tats in West Antarctica, but that their foraging pat- cantly higher than crabeater seals. This result was terns vary by region. novel in that it differed from previous conclusions Ross seals sampled in the Amundsen/Ross Seas based on the bulk δ15N values, which suggested that had significantly lower δ15NPhe values than both Ross seals were at an intermediate TP between Weddell and crabeater seals from this area (Fig. 4). crabeater and Weddell seals (Rau et al. 1992, Zhao et This result suggests that Ross seals are foraging in a al. 2004, Aubail et al. 2011). Our results suggest that, different region than the other 2 species. These low like Weddell seals, Ross seals are predominantly δ15Nbaseline values coupled with our current under- feeding on high trophic level prey, such as mid- standing of the West Antarctic δ15Nbaseline gradient to-deep water fish and squid, and that lower trophic (Brault et al. 2018) strongly suggest that Ross seals level prey (e.g. E. superba) are not a major part of are likely feeding much further offshore than Wed- their diets. This conclusion is supported by dive dell and crabeater seals, largely in the open ocean records, which indicate that Ross seals forage at which experiences low nutrient drawdown and low depths associated with capturing mesopelagic squid productivity relative to coastal areas (DiFiore et al. and fish (Bengtson & Stewart 1997, Blix & Nordøy 2006, 2009, Jaeger et al. 2010, Somes et al. 2010). 2007), and corroborate limited stomach content ana- Prior research supports our hypothesis that Ross lyses that have reported Pleuragamma antarcticum seals are largely open ocean feeders. Blix & Nordøy and Psychroteuthis glacialis comprising their diets in (2007) examined the foraging behavior of Ross seals varying proportions (Skinner & Klages 1994). via satellite-linked dive recorders. The tags tracked Our compound-specific isotope approach to trophic the movements of 10 adult Ross seals captured off dynamics also revealed significant spatial variation Queen Maud Land (East Antarctica) just after their in the trophic dynamics of crabeater seals across molt in February 2001. The animals migrated 2000 km West Antarctica. Following spatial variation in the
Brault et al.: Antarctic seal foraging ecology                                    15

δ15NPro-Phe values of crabeater seals, the TPCSI-AA            habitats and trophic dynamics of 3 important seal
values of this species decrease by approximately               species in the West Antarctic. Ross seals are foraging
0.5 from the WAP to the Amundsen/Ross Sea region,              in a low productivity, open ocean food web far off-
which is substantial for a low trophic level consumer          shore from that of crabeater and Weddell seals.
like the crabeater seal that is thought to specialize on       Crabeater and Weddell seals are foraging within
krill. Variations of this range have been shown to be          similar food webs closer to shore, but isotopic data
significant in many past studies (e.g. McCarthy et al.         suggest that crabeater seals are likely following sea
2007, Batista et al. 2014), with recent ecological work        ice to capture Euphausia superba, whereas Weddell
showing that TPCSI-AA variation as small as 0.2 to 0.3         seals appear to forage primarily in the most produc-
indicates real ecological change (Ostrom et al. 2017).         tive, near-shore areas within the Western Antarctic.
For instance, such TPCSI-AA shifts as those of crabeater       In addition, our CSI-AA data revealed that Ross seals
seals in this study may be in response to a restructur-        occupy a higher TP than originally thought, equiva-
ing of a food web (e.g. changes in the composition of          lent to Weddell seals and greater than that of
trophic levels and/or trophic linkages) (Ostrom et al.         crabeater seals. Additionally, as the TP estimates
2017). This pattern is not likely driven by differences        based on bulk stable isotope analysis are unable to
in age class across regions since all but one crabeater        account for varying δ15Nbaseline values, we hypo-
seal from both regions were adults. Crabeater seals            thesize that the strong baseline changes across the
respond quickly to changes in food availability as             environments inhabited by these species are respon-
also documented in long-term fluctuations in their             sible for this underestimate of TP. Our study reframes
mean age of sexual maturity (Hårding & Härkönen                our understanding of Ross seal foraging ecology,
1995). The WAP has been experiencing increased                 while also demonstrating solutions to the challenges
krill fishing pressure, a resurgence in baleen whales          posed by interpreting stable isotope data from top-
(competitors for krill), and dramatic reductions in sea        level consumers across isotopically disparate marine
ice extent as a function of rapid regional warming, all        habitats.
of which have negative effects on E. superba abun-
dance (Ducklow et al. 2007, 2012, Trivelpiece et al.           Acknowledgements. Dr. Dyke Andreasen, Colin Carney, Dr.
2011, Nicol et al. 2012). Perhaps these environmental          Elizabeth Gier, Stephanie Christensen, Jonathan Nye, and
changes have decreased the availability of krill for           Aaron Rosenfield provided considerable assistance with
                                                               method development and the laboratory analyses entailed
crabeater seals in this area, causing crabeater seals
                                                               in this study. Multiple Antarctic expeditions were organized
to supplement their diet with fish in the WAP relative         by the Swedish Polar Research Secretariat and financed by
to the Amundsen/Ross Sea region.                               the Swedish Research Council via a grant to T.H. and K.C.H.
   Alternatively, the regional differences in crabeater        The crew of the R/V ‘Oden’ was extremely accommodating
seal TPCSI-AA values could be the result of bottom-up          and helpful in completing our sampling protocols. The sup-
                                                               port staffs of McMurdo and Palmer Stations, similarly, gave
effects. Prior research has shown omnivorous behav-            us considerable assistance in performing our sample col-
iors by E. superba in the WAP and Drake Passage                lections. The National Science Foundation (NSF) granted
regions, possibly contributing to a higher euphausiid          funding for this study (NSF ANT-1142108). Drs. Elizabeth
TP in this region than other areas of the Antarctic            Canuel, Rebecca Dickhut, and Andrew Wozniak helped
                                                               with the importation of samples (Permit No. 17178 from the
(Schmidt et al. 2006). However, euphausiid omnivory
                                                               National Marine Fisheries Service).
in the Ross Sea has also been suggested (Hopkins
1987, Pinkerton et al. 2010), and it is possible that
omnivory by this taxon varies in time and space                                    LITERATURE CITED
(Schmidt et al. 2006). Given these uncertainties, it is
                                                               Ainley DG, Siniff DB (2009) The importance of Antarctic
not possible to definitively assess the relative roles of         toothfish as prey of Weddell seals in the Ross Sea.
shifts in crabeater seal diet versus krill omnivory               Antarct Sci 21:317−327
to our observed spatial gradient of the crabeater              Alderkamp AC, Mills MM, van Dijken GL, Laan P and oth-
seal trophic position as estimated by our compound-               ers (2012) Iron from melting glaciers fuels phytoplankton
                                                                  blooms in the Amundsen Sea (Southern Ocean): phyto-
specific stable isotope analysis.                                 plankton characteristics and productivity. Deep-Sea Res
                                                                  II 71-76:32−48
                                                               Arcalís-Planas A, Sveegaard S, Karlsson O, Harding KC,
                 5. CONCLUSIONS                                   Wåhlin A, Harkonen T, Teilmann J (2015) Limited use
                                                                  of sea ice by the Ross seal (Ommatophoca rossii), in
                                                                  Amundsen Sea, Antarctica, using telemetry and remote
  Our work using bulk and amino acid isotope analy-               sensing data. Polar Biol 38:445−461
ses revealed significant variability in the foraging           Arim M, Naya DE (2003) Pinniped diets inferred from scats:
You can also read