Tropical cyclone size is strongly limited by the Rhines scale: experiments with a barotropic NOT PUBLISHED. Submitted for peer review
←
→
Page content transcription
If your browser does not render page correctly, please read the page content below
Generated using the official AMS LATEX template—two-column layout. FOR AUTHOR USE ONLY, NOT FOR SUBMISSION!

                                                                             JOURNAL OF APPLIED METEOROLOGY AND CLIMATOLOGY

                                                 Tropical cyclone size is strongly limited by the Rhines scale: experiments with a barotropic
                                                                                             model
arXiv:2108.08496v1 [physics.ao-ph] 19 Aug 2021

                                                                        NOT PUBLISHED. Submitted for peer review
                                                                                                    K UAN -Y U L U AND DANIEL R. C HAVAS
                                                                       Purdue University, Department of Earth, Atmospheric, and Planetary Sciences, West Lafayette, IN

                                                                                                                   ABSTRACT
                                                                    Recent work found evidence using aquaplanet experiments that tropical cyclone size on Earth is limited by
                                                                 the Rhines scale, which depends on the planetary vorticity gradient, β . This study aims to examine how the
                                                                 Rhines scale limits the size of an individual tropical cyclone. The traditional Rhines scale is first re-expressed
                                                                 as a vortex Rhines scale and Rhines speed to characterize how wave effects vary with radius in a vortex
                                                                 whose wind profile is known. Experiments are performed using a simple barotropic model on a β -plane
                                                                 initialized with a TC-like axisymmetric vortex defined using a recently-developed theoretical model for the
                                                                 tropical cyclone wind profile. β and initial vortex size are each systematically varied to investigate the detailed
                                                                 responses of the TC-like vortex to β . Results show that the vortex shrinks towards an equilibrium size that
                                                                 closely follows the vortex Rhines scale. Physically, this scale divides the vortex into a vortex-dominant region
                                                                 at small radii, where the axisymmetric circulation is steady, and a wave-dominant region at larger radii, where
                                                                 the circulation stimulates Rossby waves and dissipates. A larger initial vortex relative to its vortex Rhines
                                                                 scale will shrink faster, and the shrinking timescale is well described by the vortex Rhines timescale, which is
                                                                 defined as the overturning timescale of the circulation at the vortex Rhines scale and is shown to be directly
                                                                 related to the Rossby wave group velocity. The relationship between our idealized results and the real Earth
                                                                 is discussed.

                                                    Significance Statement Tropical cyclones vary in size                    plane, TC size decreases with decreasing Coriolis parame-
                                                 significantly on the Earth, but how large a tropical cyclone                ter f following an f −1 scaling (Chavas and Emanuel 2014;
                                                 could potentially be is still not understood. This study de-                Khairoutdinov and Emanuel 2013; Zhou et al. 2014), sug-
                                                 rives a new parameter, called the ”vortex Rhines scale”,                    gesting that size should decrease rapidly with latitude in
                                                 and shows in a simple model how it can predict the upper                    the tropics. However, in observations, TCs size tends to
                                                 limit on tropical cyclone size and describe how fast a trop-                increase slowly with latitude (Kossin et al. 2007; Knaff
                                                 ical cyclone larger than this size will shrink. These results               et al. 2014). Indeed, Chavas et al. (2016) showed explicitly
                                                 help explain why tropical cyclone size tends to increase                    that the inverse-f dependence can not explain the observed
                                                 slowly with latitude on Earth.                                              dependence of TC size with latitude.
                                                                                                                                Recently, Chavas and Reed (2019, hereafter CR19) used
                                                                                                                             aquaplanet experiments with uniform thermal forcing to
                                                 1. Introduction
                                                                                                                             demonstrate that median TC size scales with the Rhines
                                                    The size of a tropical cyclone (TC) determines its foot-                 scale (Rhines 1975). This scale depends inversely on the
                                                 print of gale-force winds (Powell and Reinhold 2007),                       planetary vorticity gradient, β , and increases very slowly
                                                 storm surge (Irish et al. 2011) and rainfall (Kidder et al.                 with latitude in the tropics, which matches the behavior
                                                 2005; Lavender and McBride 2021). Therefore, under-                         seen in observations. Their findings lead to the question:
                                                 standing the dynamics of TC size is important for under-                    is the size of an individual storm limited by the Rhines
                                                 standing potential TC impacts.                                              scale and, if so, why?
                                                    Observational studies have found that TC size can vary                      The Rhines scale has traditionally served as the scale
                                                 significantly. For example, the TC radius of vanish-                        that divides flow into turbulence and Rossby wave-
                                                 ing wind (R0 ) typically ranges from 400km to 1100km                        dominated features (Held and Larichev 1996). When the
                                                 (Chavas et al. 2016). Past studies have shown that TC                       eddy length scale is at or larger than the Rhines scale, and
                                                 size may be sensitive to a variety of parameters, such as                   the linear Rossby wave term dominates the nonlinear tur-
                                                 synoptic interaction (Merrill 1984; Chan and Chan 2013),                    bulent term. Conceptually, this implies that an eddy cir-
                                                 time of the day (Dunion et al. 2014), environmental hu-                     culation larger than the Rhines scale behaves more wave-
                                                 midity (Hill and Lackmann 2009), and latitude (Weath-                       like. Despite being used to understand the role and scale of
                                                 erford and Gray 1988a,b; Chavas et al. 2016). On the f-                     eddies in many large-scale atmospheric and oceanic circu-

                                                 Generated using v4.3.2 of the AMS LATEX template                        1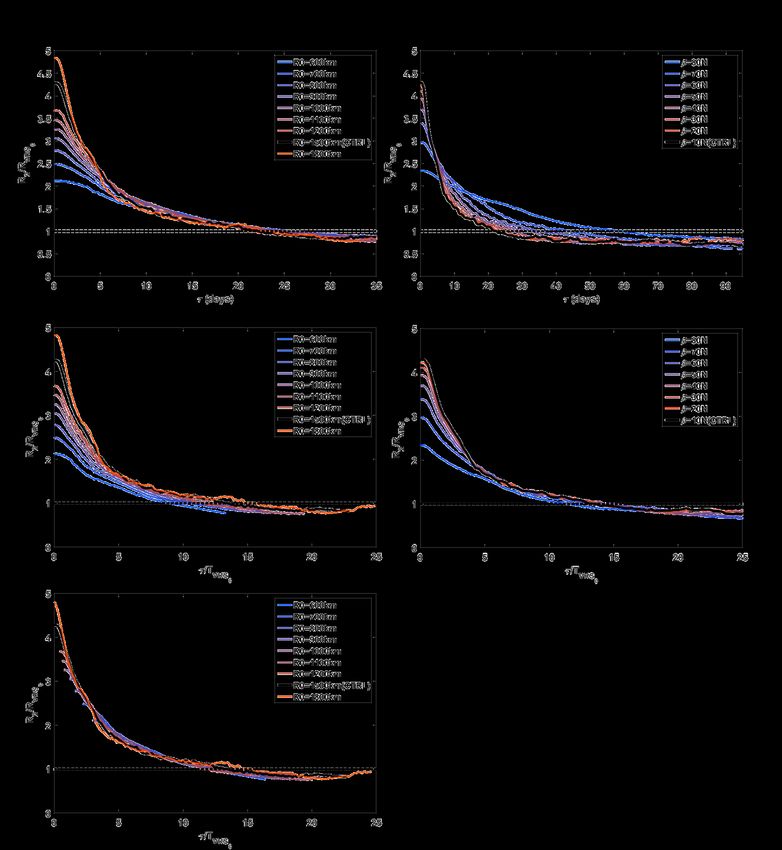
2                         JOURNAL OF APPLIED METEOROLOGY AND CLIMATOLOGY

lation theories (e.g., James and Gray 1986; Vallis and Mal-                   Sai-Lap Lam and Dritschel 2001; Eames and Flór 2002).
trud 1993; Held and Larichev 1996; Held 1999; Lapeyre                         Eames and Flór (2002) found that for larger vortex size,
and Held 2003; Schneider 2004; LaCasce and Pedlosky                           the Rossby wave generation will dominate the dynamics
2004), it has not been applied to understand the scale of                     of the vortex and, further, the vortex translation speed is
the tropical cyclone. Since a TC can be regarded as an                        correlated with the Rossby waves phase speed, a result that
eddy circulation embedded in the tropical atmosphere, it                      is conceptually similar to the Rhines scale effect described
seems plausible that the Rhines scale can indeed directly                     above. However, past work has yet to systematically test
modulate TC size. However, it is not clear how β acts to                      and explain the response of the size of an individual TC to
limit the size of an individual TC and how this may be                        β and place it in the context of the Rhines scale.
understood in the context of the Rhines scale.                                   Here we focus on understanding the detailed response
   The Rhines scale is typically calculated using a sin-                      of the structure and size of an individual TC-like vortex to
gle characteristic turbulent velocity, usually defined as the                 β . Our principal research questions are:
root-mean-square velocity (e.g., Sukoriansky et al. 2006;
Kidston et al. 2010), or even a single characteristic veloc-                    1. How does the size of and individual TC-like vortex
ity scale for a TC (an outer circulation velocity scale Uβ                         respond to β ?
in CR19; a collective velocity scale in Hsieh et al. 2020).                     2. Can we develop a framework explaining why β lim-
However, a TC clearly does not possess a single velocity                           its storm size and its relationship to the traditional
scale but instead has rotational velocities that vary strongly                     Rhines scale?
as a function of radius. Moreover, a theoretical model now
exists for the radial structure of the TC wind field that                       3. Can we predict the time-dependent response of TC
captures the first-order behavior of TC structure found in                         size to β ?
observations (Chavas et al. 2015; Chavas and Lin 2016).
                                                                              To answer these questions, we first revisit the meaning of
Such a wind field model may be used to understand the
                                                                              the Rhines scale in the context of an individual coherent
detailed dynamics of this Rhines scale effect within a TC.
                                                                              vortex and show how it may be re-expressed in the con-
   The simplest way to test the effect of β on a TC-like
                                                                              text of a vortex with a known wind profile that is useful
vortex is to perform barotropic model simulations of a sin-
                                                                              for understanding the response of an axisymmetric vortex
gle TC-like vortex on a β -plane, as the low-level circula-
                                                                              to β . We then use this theory to analyze dynamical exper-
tion of a TC may be considered approximately barotropic
                                                                              iments using a simple barotropic model on a β -plane ini-
and the Rhines scale arises from the barotropic vortic-
                                                                              tialized with the axisymmetric low-level tropical cyclone
ity equation itself. This approach neglects the role of
                                                                              wind field defined in Chavas et al. (2015). We conduct ex-
the secondary circulation, which is undoubtedly an im-
                                                                              periments systematically varying β and initial vortex size
portant part of TC dynamics, in order to isolate the ba-
                                                                              to investigate the detailed time-dependent response of the
sic behavior and dynamical response of the primary cir-
                                                                              vortex to the β . Overall, our focus is on understanding the
culation of a TC. Various aspects of the dynamics of a
                                                                              nature of the response of the size of a TC-like vortex to
vortex on a β -plane have been analyzed in past stud-
                                                                              β and how we may use the conceptual foundation of the
ies. The most widely-known effect is β -drift (Chan and
                                                                              Rhines scale to predict it. Analysis of the details of energy
Williams 1987), which is the poleward and westward
                                                                              transfer between the vortex and Rossby waves is left for
vortex translation induced by the interaction of the vor-
                                                                              future work.
tex and the vortex-generated planetary Rossby waves1
                                                                                 The paper is organized as follows: Section 2 presents
(Llewellyn Smith 1997; Sutyrin and Flierl 1994; Fiorino
                                                                              the theory and proposes our hypotheses; Section 3 demon-
and Elsberry 1989; Wang et al. 1997). Notably, though
                                                                              strates our model configuration and experiment designs;
not emphasized in their study, Chan and Williams (1987)
                                                                              Section 4 presents the idealized results and analyses of our
demonstrated in their β -drift experiments that vortex size
                                                                              experiments; Section 5 presents our key findings and dis-
tends to decrease with time on a β -plane. While induc-
                                                                              cusses the implications of our results and their relationship
ing translation, these Rossby waves transfer kinetic energy
                                                                              to real TCs on Earth.
from vortex to Rossby waves that then propagate into the
environment (Flierl and Haines 1994; Sutyrin et al. 1994;
                                                                              2. Theory
Smith et al. 1995), thereby weakening the primary circu-
lation and hence reducing vortex size (Mcdonald 1998;                            The goal of this study is to investigate the limitation of
                                                                              vortex size by the Rhines scale, which is a parameter that
                                                                              governs the interaction between Rossby waves and a vor-
    1 We use the term “planetary” to emphasize that these Rossby waves
                                                                              tex in a fluid. This effect exists in any fluid in the presence
arise due to vortex flow across the meridional vorticity gradient of the
                                                                              of a planetary vorticity gradient, β = ∂∂ yf , where f is the
Earth’s rotation, β . This is in contrast to “vortex Rossby waves” [Mont-
gomery and Kallenbach 1997], which are Rossby waves that arise from           Coriolis parameter and y is the meridional direction. The
vortex flow across the radial relative vorticity gradient of the vortex it-   simplest such system is a dry barotropic (i.e. single-layer)
self.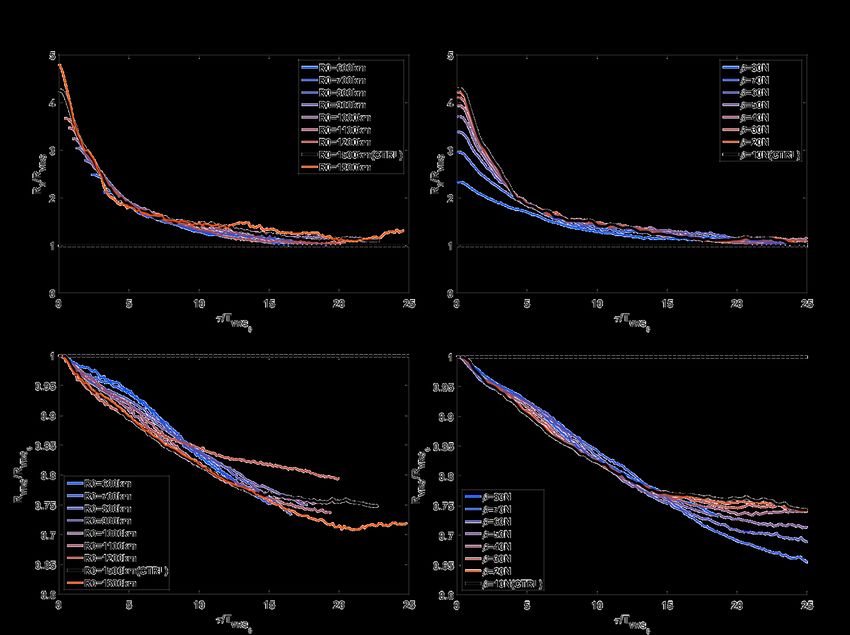
JOURNAL OF APPLIED METEOROLOGY AND CLIMATOLOGY                                                                  3

fluid with constant depth. Such a fluid will obey the non-              emphasize that we are precise in including the 2π factor
divergent dry barotropic vorticity equation as following:               in our explanation above, as it is quantitatively important
                                                                        for our results presented below. This is in contrast to typ-
                                  −→
                                   −
             ∂ζ                                                         ical scale analyses which are agnostic to the inclusion or
                        =           u · 5ζ             −β v ,     (1)
             ∂t
            |{z}                  | {z }               |{z}             neglect of constant factors (and indeed the appearance of
                            Non-linear advection term Beta term
        Tendency term                                                   such factors varies in the literature).
                                                                           Previous studies tend to estimate a system’s Rhines
where ∂ /∂t is the Eulerian tendency, ζ is the relative vor-            scale by assuming a characteristic eddy flow velocity (e.g.,
ticity, →
        −
        u is horizontal wind velocity, v is the meridional              CR19; Chemke and Kaspi 2015; Frierson et al. 2006),
wind speed, and β is the meridional gradient of planetary               such that the system will have a single characteristic
vorticity. The term on the left hand side is the vorticity              Rhines scale. However, an individual TC-like vortex pos-
tendency, the first RHS term is the non-linear advection                sesses circulation speeds that vary strongly with radius
of relative vorticity (hereafter ”non-linear term”), and the            and hence contains both ”small” and ”large” circulations
second RHS term is the linear advection of the planetary                simultaneously by definition. Thus, the details of these
vorticity (hereafter ”β term”). Note that, unlike a shallow-            wave effects should depend on radius and cannot be char-
water system, this system has no gravity waves because                  acterized by a single velocity nor a single Rhines length
the fluid depth is constant.                                            scale. The simplest starting point is to consider the vortex
   To determine which term in the barotropic vorticity                  as comprised of independent circulations at each radius
equation dominates the vorticity tendency, a traditional                with different wind speeds and calculate their correspond-
scale analysis of Eq. 1 would yield:                                    ing Rhines scale as a function of radius. This results in
                                                                        a radial profile of RRh that depends on the vortex’s tan-
                        V     V2
                           = − 2 − βV,                            (2)   gential wind profile and β (eq. 4). Here we use the wind
                        LT    L                                         speed of the TC’s circulation (Uc ), which varies with ra-
where the V is the speed scale of the wind, L is the horizon-           dius, to calculate the radial profile of the Rhines scale in
tal length scale, T is the time scale. For a non-divergent              a TC. This allows one to evaluate how β may affects the
axisymmetric vortex, → −u and v can be both expressed as the            vortex circulation differently at different radii.
azimuthal wind speed of the vortex circulation Uc . Note                   For a sufficiently large circulation relative to the Rhines
that the advection term in Eq. 2 has L2 in denominator,                 scale (R  RRh ), the non-linear term is small (Rh  1)
but each L has a different physical meaning: the relative               and thus its vorticity tendency will be governed by the β
vorticity, ζ = ∂ (rUc )/dr, represents the radial gradient of           term, which gives pure Rossby waves. Therefore, a circu-
Uc , and hence Lζ = R; in contrast, the advection operator,             lation at a given radius that is larger than its corresponding
→
−u · 5, is the tangential advection around the circumfer-               Rhines scale will be affected by β and generate Rossby
                                                                        waves, which will radiate energy away. Meanwhile, for a
ence of the vortex, and hence L→  −u ·5 = 2πR. Together, in
                                                                        sufficiently small circulation relative to the Rhines scale
Eq. 2, the denominator becomes L2 = 2πR2 . Therefore,
                                                                        (R  RRh ), the β term is small (Rh  1), and thus its vor-
the ratio between the non-linear advection term and the β
                                                                        ticity tendency will be governed by the non-linear term
term, which we define as the Rhines number (Rh), can be
                                                                        and will generate minimal Rossby wave activity. For a per-
written as following:
                                                                        fectly axisymmetric vortex, the relative vorticity advection
             →
             −              Uc2                                         term is zero, and hence the circulation simply circulates
             u · 5ζ        2πR2     Uc                                  without the energy sink from Rossby waves.
                    ≡ Rh ≈      =        .                        (3)
               βv          βUc    2πβ R2                                   The concept of the Rhines scale for a vortex can be more
Eq. 3 neglects any radial flow as is required for a                     easily understood if rephrased in terms of a velocity scale
barotropic vortex. Real TCs possess significant inflow at               rather than length scale. Since RRh is function of Uc (eq.4),
low-levels, which is a topic we address in the discussion               that means for a given wind speed, RRh defines a specific
of our results below.                                                   length scale whose value relative to the circulation radius
   When Rh = 1, the non-linear term and the β -term are                 determines whether the circulation will generate signifi-
equal (Vallis 2017, p.446). We can rearrange Eq. 3 to                   cant Rossby waves or not. Alternatively, one may choose
define the Rhines scale (RRh ) for a rotational flow with               to fix the circulation radius, in which case Rh equivalently
speed of Uc :                                                           defines a specific wind speed whose value relative to the
                            s
                                Uc                                      wind speed at radius determines whether the circulation
                      RRh ≡        .                  (4)               will be affected by Rossby waves or not. Based on this
                               2πβ
                                                                        concept, we can rearrange the Eq. 3 to yield the wind
   Note that the key distinction of Rhines scale from a                 speed when Rh = 1, which we define as the Rhines speed
deformation-type scale is that the velocity scale is a true             (URh ):
flow speed rather than a gravity wave phase speed. We                                           URh ≡ 2πβ R2                       (5)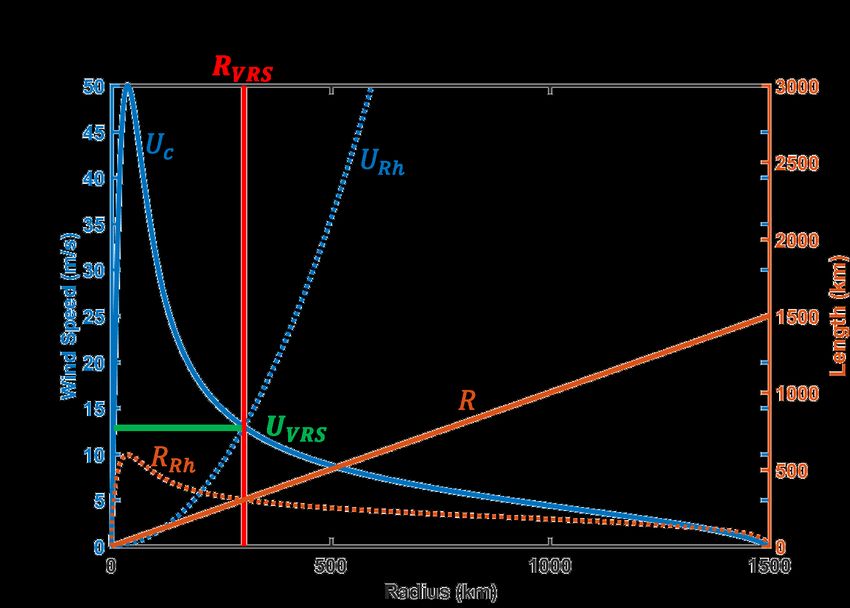
4                        JOURNAL OF APPLIED METEOROLOGY AND CLIMATOLOGY

   F IG . 1. Conceptual diagram of the vortex Rhines scale (RV RS , red vertical line) defined by the vortex’s tangential wind profile (Uc , blue solid
line) and the Rhines speed profile (URh , eq.5, blue dashed line). Brown dashed line represents the Rhines scale at each radius (RRh , eq.4), and green
horizontal line indicates the vortex Rhines speed (UV RS ). Regions with different dynamical features are labeled, inside RV RS is the vortex region,
and outside RV RS is the wave region.

Importantly, the radial dependence of URh is solely a func-                  convenience of later discussion and analyses, we also de-
tion of β , and for a given value of β , its profile is fixed and            fine the value of Uc at RV RS as the vortex Rhines speed
is independent of the vortex. The case Uc  URh is anal-                     (UV RS , green horizontal line). We may further define the
ogous to R  RRh and corresponds to the wave-dominant                        turn-over time scale of the circulation at RV RS as the vortex
regime, while the case Uc  URh is analogous to R  RRh                      Rhines timescale (TV RS ), which can be written as:
and corresponds to the vortex-dominant regime.                                                                   2πRV RS
   The above definition is especially convenient because                                               TV RS =           ,                         (6)
                                                                                                                  UV RS
the radial structure of the circulation may be known or
                                                                                Analogous to the traditional Rhines scale separating
specified. Figure 1 displays an example radial profile of
                                                                             wave and vortex dominant regimes, RV RS divides the vor-
Uc (blue solid line) for a tropical cyclone, defined by the
                                                                             tex into a vortex-dominant region at smaller radii and a
model for the low-level azimuthal wind of Chavas et al.                      wave-dominant region at larger radii, as shown by Fig-
(2015; described in detail in Section 3 below), and the                      ure 1, which we define as the ”wave region” and ”vortex
URh (blue dashed line) and RRh (brown dashed line) that                      region”. In the vortex region at smaller radii, planetary
are calculated using Eqs. 5 and 4, respectively. Typically,                  Rossby waves are not readily generated and the rapid ro-
a TC-like Uc profile will decrease monotonically with ra-                    tation will axisymmetrize the vorticity field (Montgomery
dius outside the radius of maximum wind. Meanwhile, the                      and Kallenbach 1997) until the vortex flow is parallel to
URh (blue dashed line) profile increases with radius mono-                   the vorticity contours and the flow become quasi-steady
tonically. Therefore, there will be an intersection between                  (Eq. 1). Meanwhile, in the wave region at larger radii, the
these two curves at a specific radius, which we define as                    rotating flow is slow enough to generate significant plan-
the vortex Rhines scale (RV RS , red vertical line). For the                 etary Rossby wave activity, which will cause asymmetric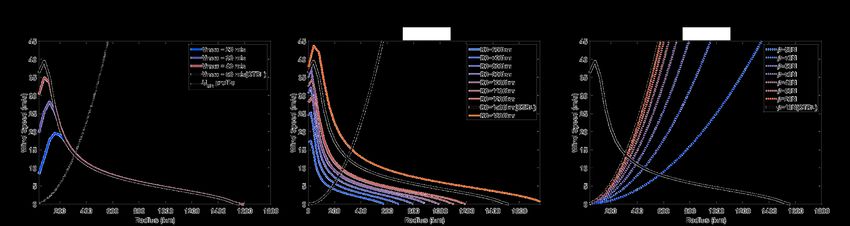
JOURNAL OF APPLIED METEOROLOGY AND CLIMATOLOGY                                                               5

                                                                          high wave-number cutoff to damp wave-numbers larger
                                                                          than 30. Experiments with different wave-number thresh-
                                                                          old are tested (40, 50, and 60) and results indicate that
                                                                          they are not sensitive to different threshold (not shown).
                                                                             There are two principal advantages of using such a sim-
                                                                          ple barotropic model. First, since the barotropic vortic-
                                                                          ity equation only includes relative and planetary vorticity
                                                                          advection terms, it is an ideal tool to isolate the dynami-
                                                                          cal details of the effects of the Rhines scale on a TC-like
                                                                          vortex, which is directly defined by the ratio of these two
                                                                          terms. Second, the barotropic model is non-divergent and
                                                                          hence neglects the boundary layer inflow and upper level
                                                                          outflow found in a real TC. As a result, radial momentum
                                                                          transport across radii is neglected, and hence the simulated
F IG . 2. Evolution of the CT RL azimuthal-mean tangential wind profile   vortex’s circulation at each radius is nearly independent,
                on the f -plane (β = 0) at day 0, 5, and 40.
                                                                          which simplifies understanding of the dynamical response.

deformation of the vortex flow at those radii. Taken to-                  b. Tropical cyclone wind field model
gether, the expectation is that only the circulation in wave-
dominant region will stimulate significant Rossby waves,        Since our interest is in tropical cyclones, we employ the
distorting and gradually dissipating the circulation therein.model of Chavas et al. (2015, , hereafter C15 model) for
Meanwhile, the circulation in the vortex-dominant region     the complete radial profile of the TC low-level azimuthal
would be expected to remain nearly steady. As a result,      wind field to initialize the barotropic model. C15 model
vortex size will be limited by RV RS .                       is a theoretical model that can reproduce the first-order
   To investigate how RV RS affects the size of a TC-like    structure of the TC wind field and also dominant modes of
vortex, we propose following hypotheses:                     wind field variability (Chavas and Lin 2016). The model
                                                             wind profile may be specified by a small number of storm
  1. Vortex size is limited by its vortex Rhines scale, and environmental physical parameters. The storm param-
      RV RS .                                                eters are the maximum wind speed (Vmax ), the outer ra-
                                                             dius of vanishing wind (R0 ), and the Coriolis parameter, f ;
  2. A larger/smaller vortex relative to its vortex Rhines
                                                             the environmental parameters are the radiative-subsidence
      scale will shrink faster/slower.
                                                             rate (wcool ) and surface drag coefficient (Cd ) for the outer
Below we test these hypotheses by simulating a TC-like region and the ratio of surface coefficients of enthalpy
vortex on a β -plane. We focus here on characterizing and and drag (Ck /Cd ). In this study, we fixed wcool = 0.002
understanding the vortex response to β across experiments m/s, Cd = 0.0015, Ck /Cd = 1, Cdvary = 0, CkCdvary = 0,
varying TC size and β . Theoretical analysis of the detailed eyead j = 0, and αeye = 0.15. We set the Coriolis param-
energetics of this response is left to future work.          eter to be constant at its value at 10◦ N in order to keep
                                                             our initial wind profile fixed with respect to f , including
3. Methods                                                   for our experiments varying β below. On the sphere this
                                                             would not be possible since f and β both depend on lati-
a. Barotropic model
                                                             tude. Here though we seek to isolate the effect of varying
   This study uses a non-divergent, dry barotropic β alone, which we can conveniently be done in a β -plane
model to simulate the vortex behavior on a β - model since f does not appear in the governing equation at
plane.       We use the open-source model developed all. Note that for the set of input parameters given above,
by James Penn and Geoffrey K. Vallis (available at: the C15 model will implicitly predict the radius of maxi-
http://empslocal.ex.ac.uk/people/staff/gv219/codes/barovort.html).
                                                             mum wind (Rmax ). To input the vortex into the barotropic
It uses a pseudo-spectral method with double-periodic model, the wind profile is transformed into an axisymmet-
boundary conditions to solve the barotropic vorticity ric vorticity field and placed at the domain center to define
equation (Eq. 1) in 2-D space. The model is set up the barotropic model’s initial condition.
with 500 grid points in both x and y directions, with grid
spacing of 20-40 km depending on the experiment. The
                                                             c. Experiments
initial time-step is 60 seconds and an adaptive time-step is
used thereafter to avoid violating the CFL condition. The       The initial wind profiles for all experiment sets de-
forcing amplitude factor and the dissipation term are both scribed below are displayed in Figure 3, with parameters
set as zero. For numerical stability, the model applies a listed in Table 1.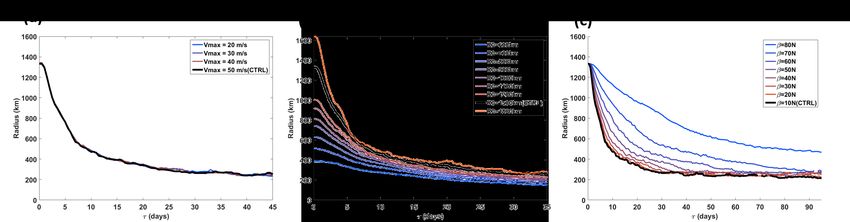
6                       JOURNAL OF APPLIED METEOROLOGY AND CLIMATOLOGY

   F IG . 3. Initial azimuthal-mean tangential wind profiles (Uc ) and Rhines speed profiles (URh ) for all experiments within each of our three
experiment sets. (a) VARYV MAX, varying initial intensity; black dashed line represent URh profile. (b) VARY R0, varying initial outer size. (c)
VARY BETA, varying β , with URh profiles in colored dashed lines. The CT RL profile is represented by the black solid curve across all plots.

TABLE 1. Parameter values for experiments in each experiment set de-     wind profile will exhibit an initial adjustment at small radii
                        scribed in the text.                             but then will remain very steady for many tens of days
                                                                         as shown in Fig. 2. Despite the initial inner-core struc-
                                                                         tural adjustment, the outer circulation remains nearly un-
                   R0(km)       β     Vmax (m/s)      Grid Space (km)    changed from its initial state. This result demonstrates that
                                                                         the vortex circulation is spun up and the vortex responses
     VARYR0           600     10N          50                20
                     700      10N          50                20
                                                                         presented below are due solely to the imposition of β .
                     800      10N          50                20          Thus, in all experiments we first simulate a 5 day spin-up
                     900      10N          50                20          period with β = 0, after which β is instantaneously turned
                     1000     10N          50                30          on to a constant value for the subsequent 95 days or shorter
                     1100     10N          50                30          if the vortex has reached quasi-equilibrium. Also, since a
                     1200     10N          50                40          vortex on a β -plane will gradually drift with time, we de-
                     1500     10N          50                40          fine the centroid of the vorticity to track the vortex center
                     1800     10N          50                40          with time and use this to calculate a storm-centered radial
    VARYBETA         1500     10N          50                40          profile of the tangential wind at each time-step.
                     1500     20N          50                40
                     1500     30N          50                40
                     1500     40N          50                40
                                                                         2) E XPERIMENT SET ”VARYV MAX ”: VARYING VOR -
                                                                             TEX INITIAL INTENSITY
                     1500     50N          50                40
                     1500     60N          50                40             In our experiments, resolution limitations will cause
                     1500     70N          50                40          vortices with different initial sizes to have different ini-
                     1500     80N          50                40          tial intensities because the inner-core is poorly resolved;
    VARYVMAX         1500     10N          20                40          this effect acts similar to a radial mixing and hence acts to
                     1500     10N          30                40          decrease Vmax and increase Rmax . Thus, we design exper-
                     1500     10N          40                40          iment set ”VARYV MAX” (Figure 3a), which has vortices
                     1500     10N          50                40          with different initial intensities at fixed size to examine the
                                                                         impact of vortex intensity on the evolution of the vortex
                                                                         circulation. Note that the outer tangential wind structure
                                                                         remains constant as intensity is varied, which is by design
1) C ONTROL E XPERIMENT
                                                                         in the C15 model as the inner and outer circulations of TCs
   We define our Control experiment (”CT RL”) as a sim-                  tend to vary independently.
ulation with a uniform quiescent environment and a sin-
gle vortex at the domain center. β is fixed at a value of
                                                                         3) E XPERIMENT ”VARY R0”: VARYING VORTEX INI -
2.2547 × 10⁻¹¹ m−1 s−1 corresponding to a latitude of 10◦
                                                                             TIAL SIZE
N. The vortex has Vmax = 50ms−1 and R0 = 1500km. The
CT RL is used below to illustrate the basic vortex response                To investigate the effect of the Rhines scale on vortices
on a low latitude β -plane.                                              with different sizes, we design experiment set ”VARY R0”
   In our experiment framework, when inserting a TC-                     (Figure 3b), which has initial wind profiles specified using
like vortex into the f -plane (setting β = 0), the tangential            R0 over a range of values from 600 to 1800 km (see Table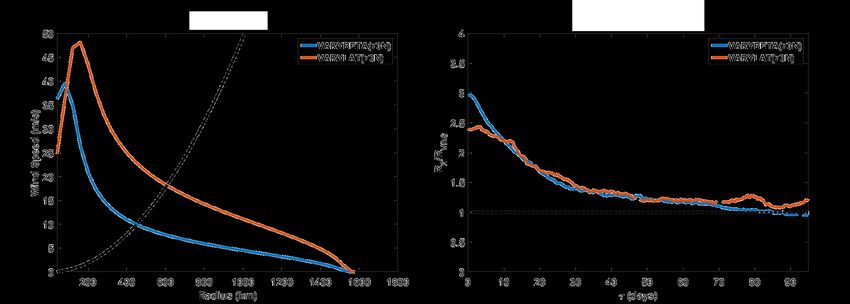
JOURNAL OF APPLIED METEOROLOGY AND CLIMATOLOGY 7
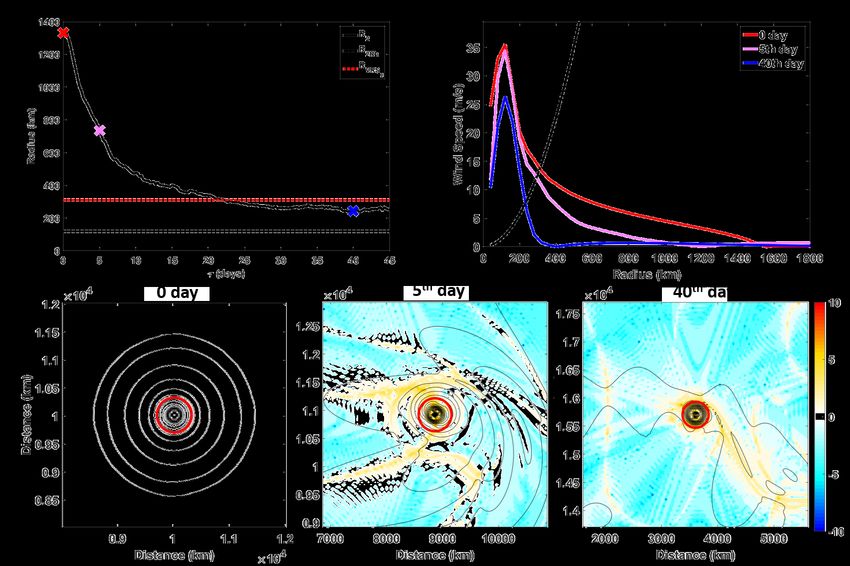
F IG . 4. Results of CT RL. (a) R2 time series, where τ indicates time since β is turned on; markers indicate times from the initial stage (day 0, red
cross), the shrinking stage (day 5, pink cross), and the quasi-equilibrium stage (day 40, blue cross), and dashed line represents the Rhines scale of
2ms−1 wind (R2Rh , eq 4). (b) Uc profiles at each of the three stages. (c)-(e) Wind speed (black contours), log10 Rh (shading), and RV RS (red circle)
at each of the three stages, respectively.
1) with β fixed at the CT RL value. Since all the mem- 4. Results
bers in this experiment have exact same value of β , they
a. Vortex response: CTRL
all have the exactly same URh profile. Thus, when increas-
ing R0 , the vortex wind profile expands outward, and as a We begin by describing the simulated response of our
result RV RS increases as R0 increases. Control vortex to β and place it in the context of the vor-
tex Rhines scale. Figure 4 shows the structural evolution
of CT RL. Figure 4a shows the time series of the radius of
2 ms−1 wind (hereafter R2 ) of this vortex, which we use
as our measure of the overall size of the storm, as well
4) E XPERIMENT SET VARY BETA: VARYING β as the value of the Rhines scale evaluated at 2ms−1 given
by R2Rh = RRh (Uc = 2ms−1 ) (Eq.4), and the vortex Rhines
To investigate the effect of the Rhines scale on vor- scale (RV RS0 ) of this vortex; R2 shrinks toward a quasi-
tex size at different values of β , we design experiment equilibrium value close to RV RS0 . Note that the equilib-
”VARY BETA” (Figure 3c), which imposes the CTRL rium value of R2 is still larger than R2Rh . However, the
wind profile for all members on a β -plane with β over a relationship between final equilibrium size and the Rhines
range of values from 2.2547 × 10⁻¹¹ m−1 s−1 to 3.9756 × scale magnitude depends strongly on the choice of wind
10−12 m−1 s−1 , corresponding to a latitude of 10◦ N to 80◦ speed used to define size; in the limit of Uc = 0ms−1 , the
N on Earth. As noted above, f in the C15 model is held Rhines scale is zero. This demonstrates a shortcoming of
constant at its CTRL value to isolate effects of β on vor- the traditional Rhines scale for defining a precise limit on
tex evolution at fixed initial vortex structure. The Rhines vortex size, which motivates the use of the vortex Rhines
speed increases at all radii with increasing β (Eq. 5), and scale, which does not require choosing an arbitrary wind
as a result RV RS decreases as β increases. speed, in our subsequent analyses.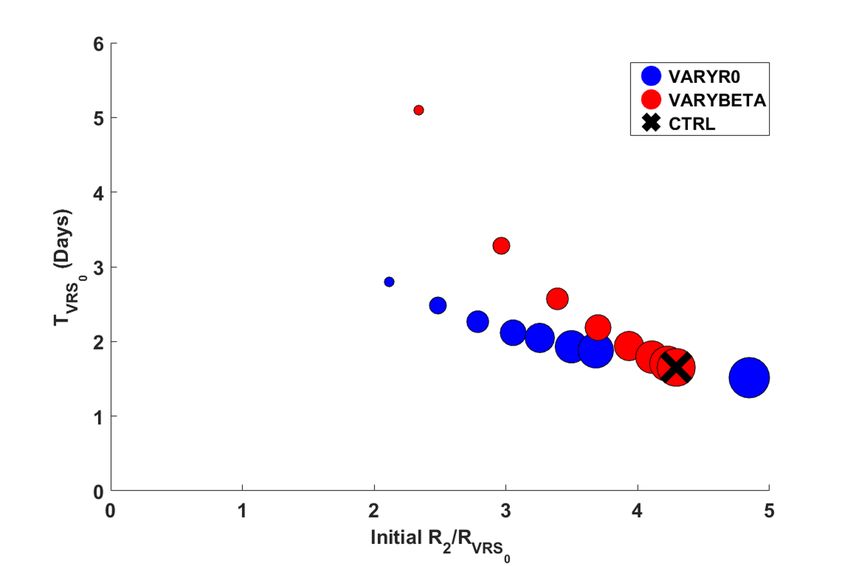
8                       JOURNAL OF APPLIED METEOROLOGY AND CLIMATOLOGY

F IG . 5. R2 time series for all three experiment sets. (a) VARYV MAX. (b) VARY R0. (c) VARY BETA. CT RL is highlighted in thicker black curves
                                                                across experiment sets.

   Figure 4b-e displays a detailed 2D analysis of the vor-               b. Response with varying Vmax
tex at different stages of its evolution based on Figure 4a:
                                                                            Since we have intensity variability within our experi-
the initial state (day 0), the shrinking stage (day 5), and
                                                                         ment members due to resolution limitations, it is impor-
the quasi-equilibrium stage (day 40). Figure 4b shows the                tant to demonstrate that changes in inner core intensity
azimuthal-mean tangential wind profile at each stage. In                 do not affect the outer circulation before we analyze any
order to demonstrate the dominant term in Eq.1, we calcu-                experiments systematically. Figure 5a shows the R2 time
late the base-10 logarithm of the Rhines number, log10 Rh,               series of all members in VARYV MAX. All members ex-
at each grid point (a value of zero corresponds to Rh =                  hibit a nearly identical size evolution across experiments.
1). Figure 4c-e show storm-centered maps of absolute                     These results indicate that variations in intensity changes
wind speed and log10 Rh at each stage, with warmer col-                  the wind speeds in the vortex region (R < RV RS ) but not the
ors (positive log10 Rh) representing the vortex-dominant                 broad outer circulation. Note that in a barotropic model
regime and cooler colors (negative log10 Rh) representing                there is no secondary circulation that links the intensity
the wave-dominant regime and with RV RS shown as a red                   change in inner core to the distant outer circulation, as
circle. Initially, the vortex’s R2 is larger than the R2Rh but           there would be in a real TC. However, the low-level cir-
no asymmetric structure has yet developed within the vor-                culation of a TC is characterized by inflow at nearly all
tex. During the shrinking stage, the vortex size decreases               radii and so the outer circulation would not be expected
rapidly, as the outer circulation outside of RV RS is highly             to directly feel changes in inner-core structure, a behav-
variable and azimuthally asymmetric compared to inner                    ior also common to observed and simulated TCs (Frank
core circulation inside of RV RS . At small radii, the non-              1977; Merrill 1984; Chavas and Lin 2016; Rotunno and
linear term is generally dominant, which is evidence by                  Bryan 2012).
the warmer colors (positive log10 Rh); at larger radii the
wave term is generally dominant, which is evidence by the                c. Responses with varying initial R0 or β
colder colors (negative log10 Rh). Note that RV RS approx-
                                                                            Next, Figure 5b shows the R2 time series of all mem-
imately separates the two regions. Finally, in the quasi-
                                                                         bers in VARY R0. Warmer colors indicate members with
equilibrium stage, the circulation has nearly vanished in
                                                                         larger initial vortex size. In VARY R0, vortices with larger
the wave region outside of RV RS while it remains intact
                                                                         initial size shrink in size faster, but they all gradually con-
and highly axisymmetrized inside of RV RS .
                                                                         verge in size and eventually reach a quasi-equilibrium of
   CT RL demonstrates how the radial structure of the re-                approximately 200-300 km.
sponse of a single vortex on a β -plane can be described at                 Figure 5c shows the R2 time series of all members in
least qualitatively via RV RS . The vortex Rhines scale ap-              VARY BETA. Warmer colors indicate members with larger
pears to impose a strong limit on vortex size by dividing                β (lower Earth latitude). Each vortex in VARY BETA has
the vortex into two regions with distinct dynamical char-                exactly the same Uc profile and hence all time series start
acteristics. Circulations in the vortex region produce min-              from the same R2 value. In VARY BETA, experiments at
imal Rossby waves and instead are simply self-advected,                  larger β (lower latitude) will shrink in size faster, while
thus maintaining a highly axisymmetric structure. In con-                most vortices reach quasi-equilibrium with broadly similar
trast, circulations in the wave region generate significant              R2 .
Rossby wave activity that produce a highly azimuthally-                     The R2 time series analysis demonstrates the system-
asymmetric structure that acts to spin down the circulation              atic behavior and their differences between VARY R0 and
there.                                                                   VARY BETA. All members in both experiments shrink in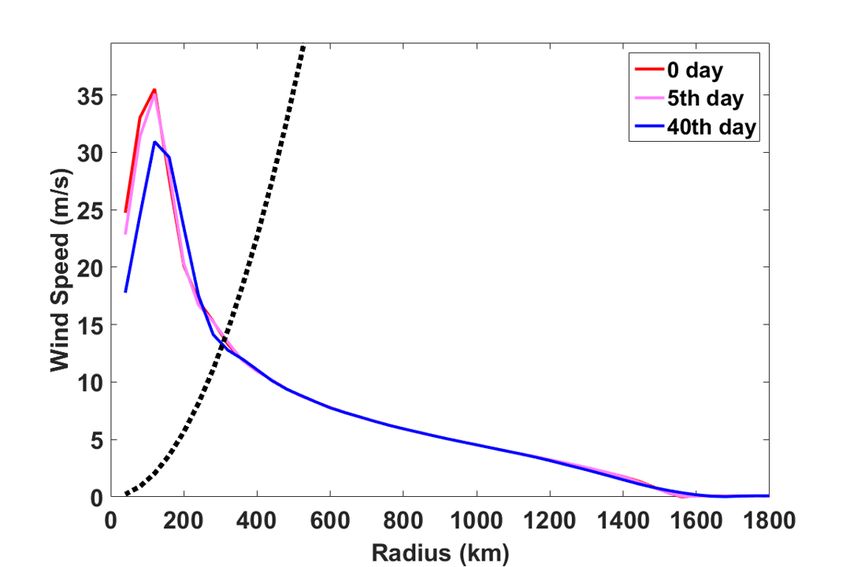
JOURNAL OF APPLIED METEOROLOGY AND CLIMATOLOGY                                                                             9

   F IG . 6. Results from Figure 5b-c for VARYR0 (left column) and VARYBETA in non-dimensional space (right column). (a) R2 /RV RS0 vs τ for
VARY R0. (b) Same as (a) but with time non-dimensionalized by TV RS0 , τ/TV RS0 . (c) Same as (b), but with curves are shifted in time to align with
the CT RL. (d) Same as (a) but for VARY BETA. (e) Same as (b) but for VARY BETA.

size with different rates after β is turned on. Vortex size                lution of each member in a non-dimensional sense relative
shrinks at a faster rate for larger initial R0 at fixed β or for
larger β at fixed initial R0 .
                                                                           to their RV RS to provide more general physical insight into
   This similarity arises because all members from each
experiment have different initial sizes relative to their vor-
tex Rhines scale. Therefore we next examine the size evo-                  the results of these experiments.
10 JOURNAL OF APPLIED METEOROLOGY AND CLIMATOLOGY
d. Vortex size evolution: Non-dimensional space
To generalize the vortex size evolution across VARY R0
and VARY BETA, we next examine the evolution of
R2 non-dimensionalized by the initial RV RS (RV RS0 ),
R2 /RV RS0 , for each member.
We begin with VARY R0. Figure 6a shows R2 /RV RS0 for
VARY R0. Warmer colors represent members with larger
initial R2 /RV RS0 . As mentioned above, each member in
VARY R0 has different initial R2 /RV RS0 due principally to
the different initial vortex size. Experiments with higher
initial R2 /RV RS0 will decrease in size faster, especially
for the first 5 days of the experiment, which is a strong
evidence in support of our hypothesis. All members’
R2 /RV RS0 eventually converge to a value slightly smaller F IG . 7. Scatter plot of TV RS0 against initial R2 /RV RS0 for experiment
than 1 in quasi-equilibrium stage, indicating that each vor- sets VARYR0 and VARYBETA. CT RL highlighted with a black cross.
tex shrinks to a size slightly smaller than its initial RV RS . Larger marker size represents member with larger magnitude R0 or β
Moreover, all experiments’ time-series converge to nearly within the relevant experiment set.
the same curve as they approach the quasi-equilibrium
stage, in contrast to the dimensional case (Fig 5). This
time equals to 5 onwards), the simulations now collapse
result indicates that RV RS0 imposes a strong limit on equi-
well through to equilibrium, such that all members reach
librium vortex size. Note that, though each experiment
equilibrium at the same time. The curves do not collapse
starts from a different initial R2 /RV RS0 , they all reach their
closely during shrinking stage, indicating perhaps some
quasi-equilibrium stage at similar times, indicating that
additional dynamics at play that cannot be captured via our
they have different shrinking rates but a similar overall two dominant vortex Rhines scale parameters; note that a
equilibration timescale. time translation similar to that done for VARY R0 will not
We next propose to non-dimensionalize experiment help further collapse these curves since they shrink at dif-
time τ by the initial vortex Rhines timescale, TV RS0 ferent rates.
(Eq. 6). To test whether TV RS0 can represent the vor- To understand how TV RS0 varies across experiments,
tex size shrinking time scale across experiments, we non- Figure 7 shows the relation between TV RS0 and the initial
dimensionalize time with the value of TV RS0 to test if the R2 /RV RS0 of all members in VARY R0 and VARY BETA. In
curves will further collapse together. Note a time-varying VARY BETA, a vortex at larger β (lower latitude) at fixed
TV RS can’t be used here; a single constant time-scale must initial R0 will have a smaller RV RS0 but a larger UV RS0 ,
be chosen. Figure 6b shows the evolution of R2 /RV RS0 which both act to decrease TV RS0 (Eq. 6); thus, TV RS0 de-
vs τ/TV RS0 for VARY R0, which produces a similar shrink- creases rapidly as β is increased. On the other hand, in
ing rate during the shrinking stage across experiments but VARY R0, a vortex with a larger initial R0 at fixed β will
separates the curves thereafter. Hence, as a final step, we have a larger RV RS0 and UV RS0 , whose effects on TV RS0
shift them in time to align with the curve with the CT RL oppose one another; thus, TV RS0 decreases slowly as R0
(see Figure 6c). The final result yields curves that approx- is increased. Thus, the behavior of TV RS,0 differs when
imately collapse to a single universal curve. This outcome R2 /RV RS is varied by changing R0 vs β . Basic physical
indicates that TV RS0 represents the timescale associated insight into the meaning of this timescale is provided in
with the shrinking rate of each experiment, and that the subsection g below. Across both experiment sets, our re-
evolution depends only on the current value of R2 /RV RS0 . sults show that non-dimensionalization of radius and time
Next we analyze VARY BETA. Figure 6d is the same as by RV RS0 and TV RS0 , respectively, can allow all curves to
Figure 6a but for VARY BETA. Each member has different significantly collapse with each other. The broad impli-
initial R2 /RV RS0 due to the different initial RV RS . Similar cation is that R2 shrinks toward RV RS0 over a fundamental
to VARY R0, members in VARY BETA with larger initial timescale given by TV RS0 , though it occurs in slightly dif-
R2 /RV RS0 also shrink faster and also converge to a value ferent ways when varying R0 vs. β .
smaller than 1 in the quasi-equilibrium stage. However, For VARY R0, the curves collapse at all times via a
in contrast to VARY R0, members in VARY BETA equili- time translation, indicating that there is a universal non-
brate over significantly different timescales, especially for dimensional shrinking rate that only depends on the cur-
members with lower β , indicating that they have different rent value of R2 /RV RS0 (i.e. the size evolution is path-
underlying timescales. Thus, we non-dimensionalize time independent), and TV RS0 represents the timescale of this
in Figure 6e, which shows R2 /RV RS0 vs τ/TV RS0 . Beyond rate. For VARY BETA, each curve is initially different but
an initial period of rapid shrinking (i.e. non-dimensional all curves converge to 1 over a specific single timescale,JOURNAL OF APPLIED METEOROLOGY AND CLIMATOLOGY 11
F IG . 8. Non-dimensional evolution of R2 from RV RS , and RV RS from its initial value RV RS0 . (a) R2 /RV RS vs τ/TV RS0 for VARY R0, and curves are
shifted in time to align with the CT RL. (b) RV RS /RV RS0 vs τ/TV RS0 for VARY R0. (c) Same as (a) but for VARY BETA, and without time translation.
(d) Same as (b) but for VARY BETA
and TV RS0 represents this overall equilibration timescale. smaller than 1 in Fig 6, indicating that the final equilibrium
Why this distinction arises between the two experiment size is exactly given by RV RS . Although normalizing by
types is not currently known but may be related to the the time-dependent RV RS is technically more precise, it re-
wave dynamics in the outer region that differs when vary- quires knowledge of the vortex evolution itself and hence
ing storm size (R0 of Uc profile) vs. varying β (slope of is no longer a true prediction.
URh ). RV RS0 may be used instead of the time-dependent RV RS
because the intrinsic timescale of RV RS relative to its initial
value RV RS0 also follows TV RS0 . (Recall that TV RS0 must be
e. The evolution of the vortex Rhines scale used, as a time-varying TV RS does not make sense for our
We have demonstrated how we can understand the vor- analysis.) The relation between R2 /RV RS and R2 /RV RS0
tex size evolution using initial values of RV RS0 and TV RS0 . can be written as following:
We found that knowledge of the initial vortex structure and R2 RV RS R2
β value alone are sufficient to predict both the upper limit = . (7)
RV RS0 RV RS0 RV RS
on equilibrium vortex size (RV RS0 ) and the shrinking rate
(TV RS0 ). However, RV RS may also change with time during Mathematically, if the evolution of R2 /RV RS and
a given experiment. We may also use the time-dependent RV RS /RV RS0 both collapse across experiments after non-
RV RS to normalize R2 (Figure 8a and c), which yields very dimensinoalizing by TV RS0 , then R2 /RV RS0 will collapse
similar results to that presented above using RV RS0 : the as well. Figure 8b and d shows RV RS /RV RS0 vs τV RS /TV RS0
lone difference is that the R2 /RV RS curves converge to an for VARY R0 and VARY BETA, respectively. For both ex-
equilibrium value that is almost exactly 1, rather than a bit periment sets, all curves nearly collapse, indicating that12 JOURNAL OF APPLIED METEOROLOGY AND CLIMATOLOGY
F IG . 9. Comparison of 70◦ N experiment from VARY BETA with VARY LAT (70N). (a) Initial Uc profiles and their URh profile (dashed curve). (b)
R2 /RV RS .
RV RS decreases relative to their initial values at the same f fixed in the wind profile and hence may be directly ap-
non-dimensional rate. plicable to the real Earth.
For this reason, R2 /RV RS and R2 /RV RS0 yield similar
non-dimensional results. Using the initial value is there- g. Linking TV RS to the Rossby wave group velocity
fore preferable since as it has already be known in the first
place, it also can provide the prediction of how vortex size The dynamical details of the vortex-wave interaction, in
on a β -plane will evolve with time. This result further particular a mechanistic understanding of the waves them-
highlights how TV RS0 is the dominant intrinsic timescale selves and the energy transfer that they induce, are not
for this system. tackled in this work. Here, though, we provide a simple
first step in this direction by linking TV RS to the Rossby
wave group velocity. We defined TV RS as the overturning
f. A more Earth-like case: allowing f to vary timescale of the circulation at RV RS , which can be written
as a function of RV RS and β :
In VARYBETA we only modified the β -plane value in
the barotropic model while leaving f constant when spec- 2πRV RS 2πRV RS 1
ifying the initial vortex using the C15 model. In the real TV RS = = = . (8)
UV RS 2πβ RV RS 2 β RV RS
world on a rotating sphere, changing latitude will change
β and f simultaneously. Allowing f to change in the C15 where we have made use of the fact that the UV RS can be
model while holding R0 fixed will change the radial struc- defined using the definition of the Rhines speed (Eq. 5) as
ture of the resulting wind profile inside of R0 . URh (r = RV RS ). Following the theory discussed above, at
Here we briefly test whether changing f consistent with RV RS the circulation’s overturning timescale should equal
a change in β (i.e. true changes in latitude) on Earth will the planetary Rossby wave generation timescale, which
affect our result significantly. To do so, we perform an ex- we propose should be directly related to the timescale of
periment identical to our VARY BETA experiment at 70N planetary Rossby wave propagation, TRW . Here, similar
except with a vortex generated by the C15 model with f to how we calculate TV RS , we estimate the TRW by using
set at its value at 70N (hereafter VARY LAT (70N)), and circulation’s circumference as length scale, and the group
compare the results. Figure 9a shows the initial Uc pro- velocity of the planetary Rossby wave (cgRW ) as its propa-
files; the URh profile is identical for each. Larger f shifts gation speed:
the wind field structure radially outwards towards R0 , in- 2πRV RS
TRW ∝ . (9)
cluding a larger Rmax (which results in larger Vmax when cgRW
inserted into the barotropic model) and stronger winds at
most radii beyond the inner core. For a barotropic planetary Rossby wave, its group velocity
Figure 9b shows R2 /RV RS between these two experi- is as following (Vallis 2017, p.228):
ments. Results show that despite different initial R2 /RV RS , s
2 2
β (k2 − l 2 )
2klβ
q
the two members from VARY BETA and VARY LAT (70N) 2
cgRW = cxg 2 + cyg = + ,
have similar R2 /RV RS evolution after 10 days. This indi- (k2 + l 2 )2 (k2 + l 2 )2
cates that our overall results are not dependent on holding (10)JOURNAL OF APPLIED METEOROLOGY AND CLIMATOLOGY 13
where k and l are the wavenumbers in the x and y direction, a more useful scale for the limit of TC size than the
respectively. cxg and cyg are the Rossby wave group velocity traditional Rhines scale.
in the x and y direction, respectively. For a vortex we as-
sume axisymmetry, such that k = l, which results in zero 3. Theoretically, the vortex will be divided into two re-
group velocity in the x direction. We take wavenumber to gions by RV RS : vortex region at smaller radii and
be inverse proportional to the circulation’s circumference wave region at larger radii. In the vortex region, the
(k = 1/(2πRV RS )). The group velocity at RV RS may then circulation is highly axisymmetric and largely unaf-
be written as: fected by β . In the wave region, planetary Rossby
wave generation is strong and waves distort and dis-
2klβ 2k2 β β
cgRW = cyg = 2 2 2
= 2 2 2
= 2 = 2β π 2 RV2 RS . sipate the outer circulation.
(k + l ) (k + k ) 2k
(11) 4. A larger vortex relative to its RV RS will shrink faster,
And now we can substitute Eq.11 into Eq.9 to write TRW and all vortices shrink towards an equilibrium close
in terms of RV RS : to its vortex Rhines scale.
2πRV RS 1
TRW ∝ = . (12) 5. Vortex size shrinks toward RV RS following a domi-
2β π 2 RV2 RS πβ RV RS
nant timescale given by TV RS , though the role of that
Comparing Eq.12 to Eq.8, we find that TRW is identi- timescale differs slightly when varying R0 vs β . TV RS
cal in form to TV RS , differing only by a factor π. The is also shown to be closely related to the Rossby wave
similarity between TRW and TV RS indicates that TV RS is group velocity at the vortex Rhines scale, which pro-
proportional to the planetary Rossby waves propagation vides a direct link between our theory and the dynam-
timescale at RV RS , which should be directly related to the ics of the waves themselves.
wave-induced dissipation of the vortex outer circulation
that drives the size evolution of a TC-like vortex on a β - 6. The first-order evolution of the vortex for any value
plane. This basic theoretical linkage, in conjunction with of R0 and β is controlled by the initial value of RV RS
our results and conceptual understanding above, provides and TV RS , thereby enabling one to predict the vortex
further insight into how the vortex Rhines scale governs response from the initial condition alone.
the first-order dynamics of the vortex response to β . Un-
derstanding the detailed radial structure of these waves 7. A similar outcome occurs when allowing f in the ini-
may provide deeper insight and is left for future work. tial vortex structure to change consistent with β , indi-
cating that the results are also applicable to an Earth-
5. Conclusion and discussion like setting.
This study derives a new concept called the vor- It is important to place our idealized results in the con-
tex Rhines scale and applies it to experiments with a text of real TCs on Earth. The typical duration of a TC
barotropic model to understand how β limits the size of is on the order of 10 days (Webster et al. 2005) and form
a tropical cyclone-like vortex. Since the barotropic model from pre-existing disturbances that may have propagated
governing equation includes only the advection of the rel- for much longer. Since most of our experiment members
ative and planetary vorticity, our experiment design pro- (especially for those on a lower latitude β -plane) have
vides an idealized and straightforward framework to in- shrunk rapidly within 10 days, the vortex Rhines scale
vestigate the dynamics of a TC-like vortex in the presence would be expected to strongly limit TC size on Earth and
of β and its relationship to the traditional Rhines scale. hence explain why storm size appears to follow a Rhines-
The key findings of this study are as follows: type scaling in observations and models. Moreover, it ex-
plains how storm size may vary widely in nature, as TC
1. We derive a quantity called the vortex Rhines scale
size may remain steady at any size that is reasonably small
(RV RS ), which translates the traditional Rhines scale
relative to this scale, since the vortex Rhines scale only
into the context of an individual axisymmetric vortex,
sets an upper bound on vortex size. Additionally, RV RS
and show how it can be used to understand the effect
in our experiments range from 200 to 400 km, which is
of β on a TC-like vortex.
substantially smaller than the f −1 theoretical length scale
2. The vortex Rhines scale serves as a robust limit for TC size on the f -plane, Vp / f , where Vp is the poten-
on the size of a TC-like vortex on a barotropic β - tial intensity (Chavas and Emanuel 2014), which is larger
plane, which corroborates the finding in Chavas and than 1000 km at low latitudes (and goes to infinity at the
Reed (2019) that storm size scales with the tradi- equator). In other words, if a TC were for form with a size
tional Rhines scale. The circulation beyond the vor- equal to Vp / f , our results indicate that β and its induced
tex Rhines scale will weaken with time, which man- wave effects would cause it to shrink rapidly within a few
ifests itself as a shrinking of vortex size. RV RS offers days. This is a simple mechanistic explanation for why14 JOURNAL OF APPLIED METEOROLOGY AND CLIMATOLOGY F IG . 10. Conceptual diagram illustrating the different dynamical regimes in the CT RL (10N) initial vortex wind profile (blue), with Rhines speed profile (black). The dashed black vertical lines indicate radii of different Rossby numbers (Ro ) (10, 1, and 0.1 from small to large radii), and the red dashed vertical line represents the RV RS . Neglecting β , the region with R0 > 10 corresponds to cyclostrophic balance, 10 > R0 > 1 gradient wind balance, and R0 < 1 geostrophic balance, respectively. β introduces an unbalanced wave-generation region beyond RV RS . Vp / f is not an appropriate scaling for TC size in the trop- observations is needed to evaluate our findings in a full- ics as has been noted in observations (Chavas et al. 2016). physics baroclinic environment. Finally, though our derivations and analyses have assumed Finally, to provide a broader perspective on our find- axisymmetry, these physics may be general to any vortex, ings, we conclude with a simple conceptual diagram to even asymmetric ones such as extra-tropical cyclones. In- place the effect of β in the context of standard dynamical deed, our results and theory suggests a simple mechanistic balance regimes common in atmospheric science. Figure explanation for why the Rhines scale cuts of the upscale 10 illustrates different dynamical regimes as a function of energy cascade in 2D turbulence and limits extra-tropical radius for an example TC wind profile. On an f -plane cyclone size (e.g., Held and Larichev 1996; Chai and Val- (β = 0), a vortex wind profile can remain steady at all radii lis 2014; Chemke and Kaspi 2015, 2016; Chemke et al. and its size remain unchanged. This is because on the f - 2016). plane at any given radius the flow can exist in a balanced All of our experiments are barotropic. This simplified state, where the specific balance is commonly defined us- approach omits various key physical features in real TCs, ing the Rossby number. Within the inner core region (in- but it is unclear how non-barotropic effects would modify side of approximately 100 km in Figure 10), the Rossby these barotropic responses. For example, radial inflow in number of the circulation is significantly larger than 10, TC will communicate the reduction in angular momentum which corresponds to cyclostrophic balance. Between the in the outer region to the inner core, so the inner core wind inner core and far outer circulation, the Rossby number field would be expected to shrink too. Further investiga- ranges between 0.1 and 10, which corresponds to gradient tion in models with higher degrees of complexity and in wind balance. Finally, in the far outer circulation inside of
JOURNAL OF APPLIED METEOROLOGY AND CLIMATOLOGY                                                                          15

the outer radius, the Rossby number is less than 0.1, which                 Chemke, R., T. Dror, and Y. Kaspi, 2016: Barotropic kinetic
corresponds to geostrophic balance. However, in the pres-                     energy and enstrophy transfers in the atmosphere. Geophysi-
                                                                              cal Research Letters, 43 (14), 7725–7734, doi:https://doi.org/
ence of non-zero β , there is now an unbalanced regime at
                                                                              10.1002/2016GL070350, URL https://agupubs.onlinelibrary.wiley.
radii beyond the vortex Rhines scale, which corresponds                       com/doi/abs/10.1002/2016GL070350, https://agupubs.onlinelibrary.
to the wave region described above. In this unbalanced                        wiley.com/doi/pdf/10.1002/2016GL070350.
region, the outer circulation stimulates planetary Rossby
                                                                            Chemke, R., and Y. Kaspi, 2015: The latitudinal dependence of at-
waves, distorting the flow and transferring kinetic energy                    mospheric jet scales and macroturbulent energy cascades. Journal
out of the vortex.                                                            of the Atmospheric Sciences, 72 (10), 3891 – 3907, doi:10.1175/
                                                                              JAS-D-15-0007.1, URL https://journals.ametsoc.org/view/journals/
 Acknowledgments. The authors thank Malte Jansen for                          atsc/72/10/jas-d-15-0007.1.xml.
suggesting testing the vortex Rhines.timescale. Fund-
ing support was provided by NSF grants 1826161 and                          Chemke, R., and Y. Kaspi, 2016: The latitudinal dependence of
                                                                              the oceanic barotropic eddy kinetic energy and macroturbulence
1945113.                                                                      energy transport. Geophysical Research Letters, 43 (6), 2723–2731,
                                                                              doi:https://doi.org/10.1002/2016GL067847, URL https://agupubs.
References                                                                    onlinelibrary.wiley.com/doi/abs/10.1002/2016GL067847,        https:
                                                                              //agupubs.onlinelibrary.wiley.com/doi/pdf/10.1002/2016GL067847.
Chai, J., and G. K. Vallis, 2014: The role of criticality on the hor-
  izontal and vertical scales of extratropical eddies in a dry gcm.         Dunion, J. P., C. D. Thorncroft, and C. S. Velden, 2014: The trop-
  Journal of the Atmospheric Sciences, 71 (7), 2300 – 2318, doi:              ical cyclone diurnal cycle of mature hurricanes. Monthly Weather
  10.1175/JAS-D-13-0351.1, URL https://journals.ametsoc.org/view/             Review, 142 (10), 3900 – 3919, doi:10.1175/MWR-D-13-00191.
  journals/atsc/71/7/jas-d-13-0351.1.xml.                                     1, URL https://journals.ametsoc.org/view/journals/mwre/142/10/
                                                                              mwr-d-13-00191.1.xml.
Chan, J. C. L., and R. T. Williams, 1987: Analytical and numer-
  ical studies of the beta-effect in tropical cyclone motion. part          Eames, I., and J.-B. Flór, 2002: The dynamics of monopolar vortices
  i: Zero mean flow. Journal of Atmospheric Sciences, 44 (9),                 on a topographic beta plane. Joint British Mathematical and Ap-
  1257 – 1265, doi:10.1175/1520-0469(1987)044h1257:AANSOTi2.                  plied Mathematical Colloquium, Warwick, United Kingdom, Uni-
  0.CO;2, URL https://journals.ametsoc.org/view/journals/atsc/44/9/           versity of Warwick, doi:10.1017/S0022112001007728, URL https:
  1520-0469 1987 044 1257 aansot 2 0 co 2.xml.                                //hal.archives-ouvertes.fr/hal-00206207.

                                                                            Fiorino, M., and R. L. Elsberry, 1989: Some aspects of vortex structure
Chan, K. T. F., and J. C. L. Chan, 2013: Angular momentum trans-               related to tropical cyclone motion. Journal of Atmospheric Sci-
  ports and synoptic flow patterns associated with tropical cyclone size       ences, 46 (7), 975 – 990, doi:10.1175/1520-0469(1989)046h0975:
  change. Monthly Weather Review, 141 (11), 3985 – 4007, doi:10.               SAOVSRi2.0.CO;2,         URL      https://journals.ametsoc.org/view/
  1175/MWR-D-12-00204.1, URL https://journals.ametsoc.org/view/                journals/atsc/46/7/1520-0469 1989 046 0975 saovsr 2 0 co 2.xml.
  journals/mwre/141/11/mwr-d-12-00204.1.xml.
                                                                            Flierl, G. R., and K. Haines, 1994: The decay of modons due to rossby
Chavas, D. R., and K. Emanuel, 2014: Equilibrium tropical cyclone size         wave radiation. Physics of Fluids, 6 (10), 3487–3497, doi:10.1063/
  in an idealized state of axisymmetric radiative?convective equilib-          1.868405, URL https://doi.org/10.1063/1.868405, https://doi.org/10.
  rium. Journal of the Atmospheric Sciences, 71 (5), 1663 – 1680, doi:         1063/1.868405.
  10.1175/JAS-D-13-0155.1, URL https://journals.ametsoc.org/view/
  journals/atsc/71/5/jas-d-13-0155.1.xml.                                   Frank, W. M., 1977: The structure and energetics of the tropi-
                                                                               cal cyclone i. storm structure. Monthly Weather Review, 105 (9),
Chavas, D. R., and N. Lin, 2016: A model for the complete radial struc-        1119 – 1135, doi:10.1175/1520-0493(1977)105h1119:TSAEOTi2.
  ture of the tropical cyclone wind field. part ii: Wind field variabil-       0.CO;2, URL https://journals.ametsoc.org/view/journals/mwre/105/
  ity. Journal of the Atmospheric Sciences, 73 (8), 3093 – 3113, doi:          9/1520-0493 1977 105 1119 tsaeot 2 0 co 2.xml.
  10.1175/JAS-D-15-0185.1, URL https://journals.ametsoc.org/view/
  journals/atsc/73/8/jas-d-15-0185.1.xml.                                   Frierson, D. M. W., I. M. Held, and P. Zurita-Gotor, 2006: A
                                                                               gray-radiation aquaplanet moist gcm. part i: Static stability and
Chavas, D. R., N. Lin, W. Dong, and Y. Lin, 2016: Observed tropi-              eddy scale. Journal of the Atmospheric Sciences, 63 (10), 2548
  cal cyclone size revisited. Journal of Climate, 29 (8), 2923 – 2939,         – 2566, doi:10.1175/JAS3753.1, URL https://journals.ametsoc.org/
  doi:10.1175/JCLI-D-15-0731.1, URL https://journals.ametsoc.org/              view/journals/atsc/63/10/jas3753.1.xml.
  view/journals/clim/29/8/jcli-d-15-0731.1.xml.
                                                                            Held, I. M., 1999: Planetary Waves and Their Interaction with Smaller
                                                                              Scales, 101–109. American Meteorological Society, Boston, MA,
Chavas, D. R., N. Lin, and K. Emanuel, 2015: A model for the complete
                                                                              doi:10.1007/978-1-935704-09-6 11, URL https://doi.org/10.1007/
  radial structure of the tropical cyclone wind field. part i: Comparison
                                                                              978-1-935704-09-6 11.
  with observed structure. Journal of the Atmospheric Sciences, 72 (9),
  3647 – 3662, doi:10.1175/JAS-D-15-0014.1, URL https://journals.           Held, I. M., and V. D. Larichev, 1996:           A scaling the-
  ametsoc.org/view/journals/atsc/72/9/jas-d-15-0014.1.xml.                    ory for horizontally homogeneous, baroclinically unstable flow
                                                                              on a beta plane. Journal of Atmospheric Sciences, 53 (7),
Chavas, D. R., and K. A. Reed, 2019: Dynamical aquaplanet ex-                 946 – 952, doi:10.1175/1520-0469(1996)053h0946:ASTFHHi2.
  periments with uniform thermal forcing: System dynamics and                 0.CO;2, URL https://journals.ametsoc.org/view/journals/atsc/53/7/
  implications for tropical cyclone genesis and size. Journal of              1520-0469 1996 053 0946 astfhh 2 0 co 2.xml.
  the Atmospheric Sciences, 76 (8), 2257 – 2274, doi:10.1175/
  JAS-D-19-0001.1, URL https://journals.ametsoc.org/view/journals/          Hill, K. A., and G. M. Lackmann, 2009: Influence of environmental hu-
  atsc/76/8/jas-d-19-0001.1.xml.                                               midity on tropical cyclone size. Monthly Weather Review, 137 (10),
You can also read