TROPOSPHERIC OZONE POLLUTION: THE CAPTOR EXPERIENCE - Alice De Marco Torino, 7 maggio 2019 - Focus on Open Science
←
→
Page content transcription
If your browser does not render page correctly, please read the page content below
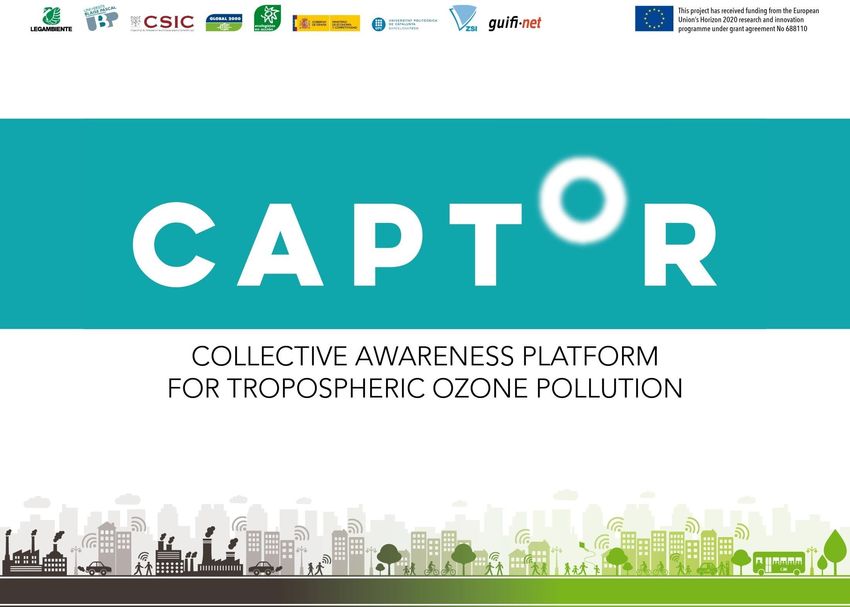
TROPOSPHERIC OZONE POLLUTION:
    THE CAPTOR EXPERIENCE

                                       Alice De Marco
                                Torino, 7 maggio 2019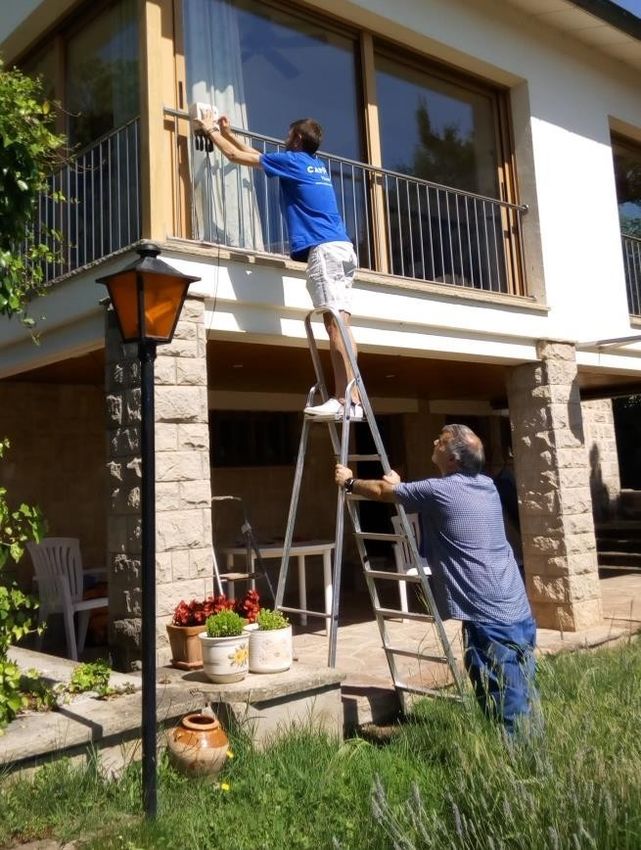
What is ozone?

                 O3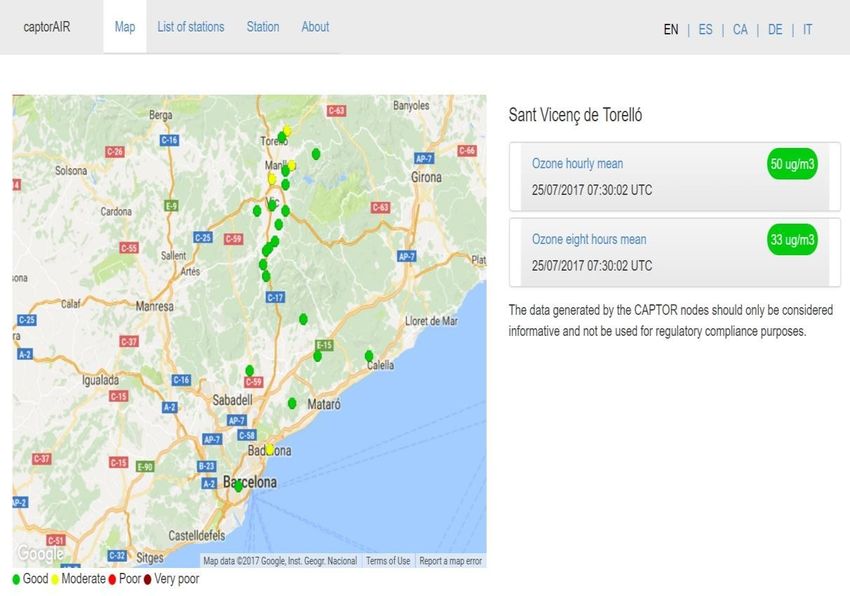
What is tropospheric ozone?

                              STRATOSPHERIC OZONE
                                  (forms the Earth’s
                                protective ozone layer)

                              TROPOSPHERIC OZONE
                               (affects human health
                                   and vegetation)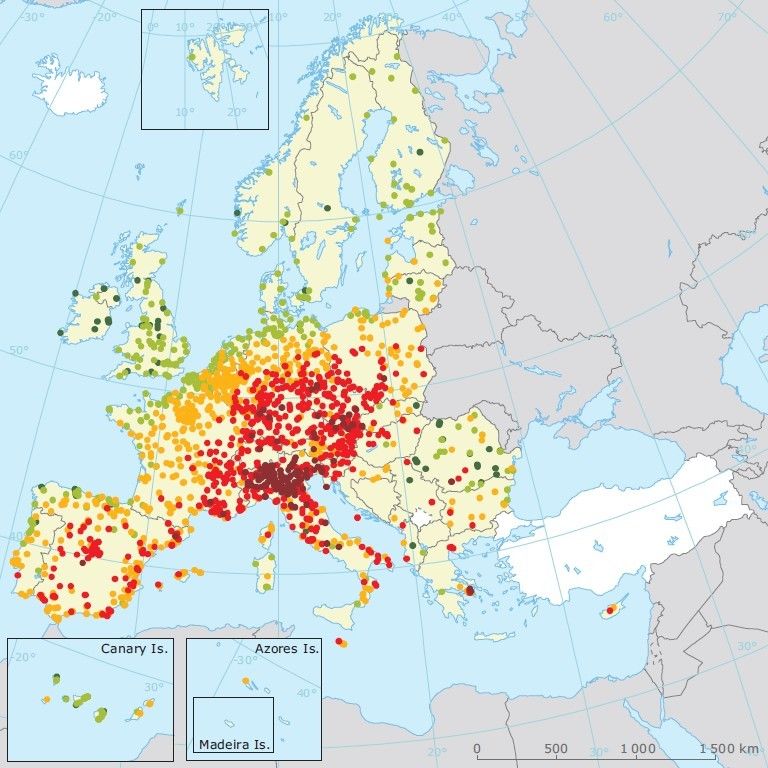
How is tropospheric ozone formed?

       Ozone precursors

Nitrogen oxides        Carbon species   Tropospheric
                                           ozone
    NOx                  VOCs
  (NO & NO2)            (CO & CH4)          O3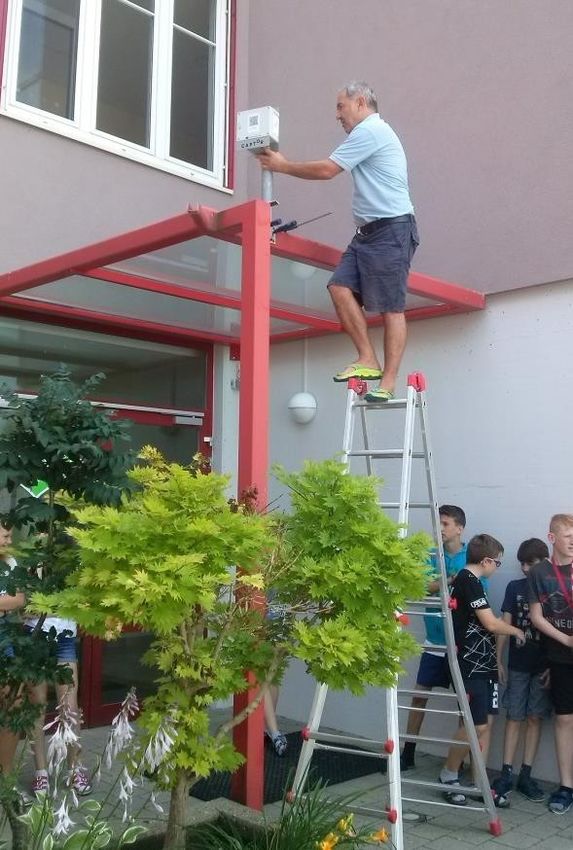
How is tropospheric ozone formed?

                             Ozone precursors

           Nitrogen oxides
               NOx                               VOCs
             (NO & NO2)

                                     Anthropogenic      Biogenic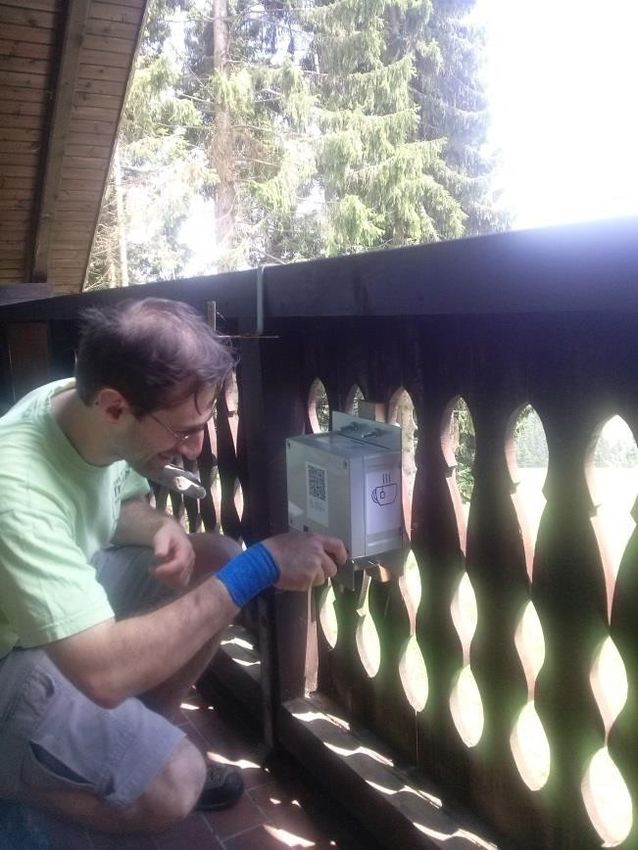
Ozone in Europe
                       EEA Air Quality in Europe

                        2015                                  2016

     Large interannual variability dependent on meteorology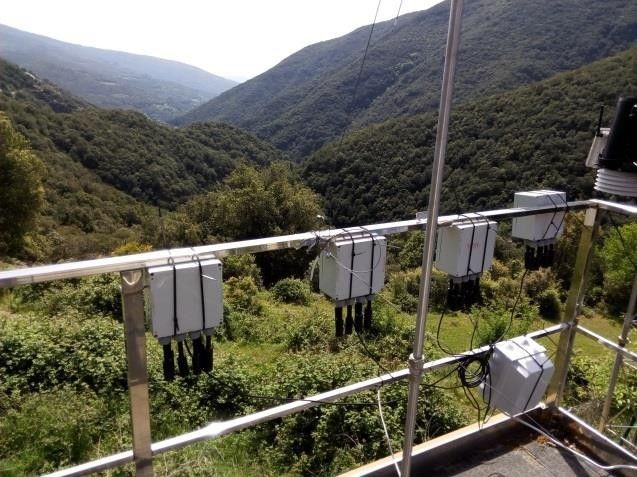
Ozone in Europe

    EU target value for protection of human health (120 microg/m3)
    - 17% of stations > O3 target value for protection of human health.
    - 17% (2016)  WHO AQG value for O3.

                                     2015                             2016

                                 EEA Air Quality in Europe, 2018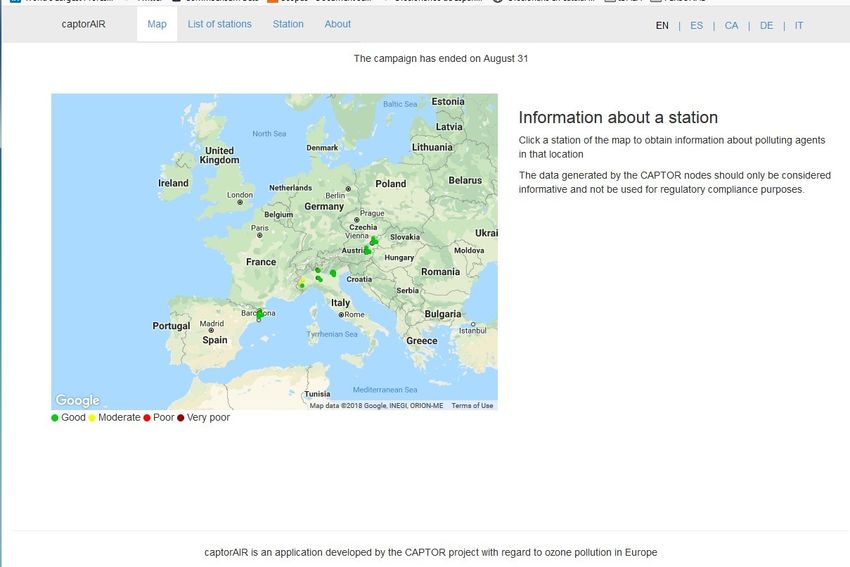
CAPTOR: Objectives
To foster bottom-up collaboration of local
communities, citizens, NGOs, and scientists, to raise
awareness of air pollution problem, and especially of
tropospheric ozone.
To engage a network of local communities in three
European regions for monitoring tropospheric ozone.
To give technical support in developing low-cost sensors
and data manager.
To empower citizens and engage them in promoting active
participation in decision making to drive solutions.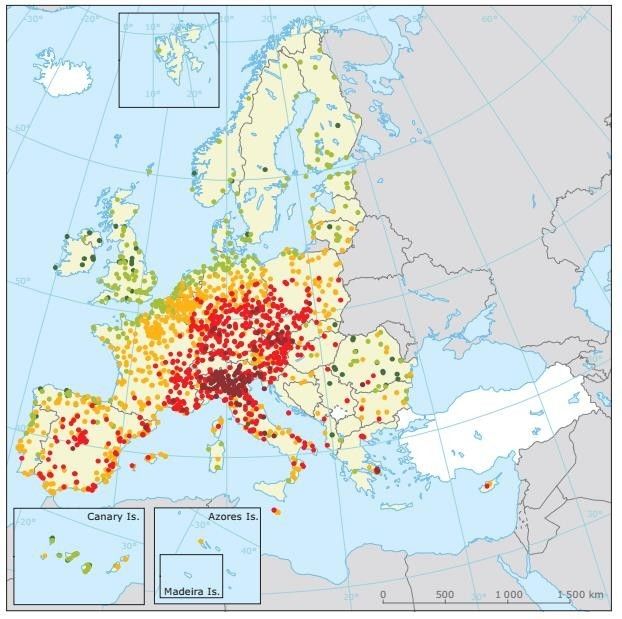
Study areas

      Italy:
   Piedmont,
   Lombardy,
     Emilia
  Romagna and
     Veneto

     Spain:
   Barcelonès,
    Vallesos,
    Maresme
   and Osona         Austria:
                   Burgenland,
                 Steiermark and
                 Niederösterreich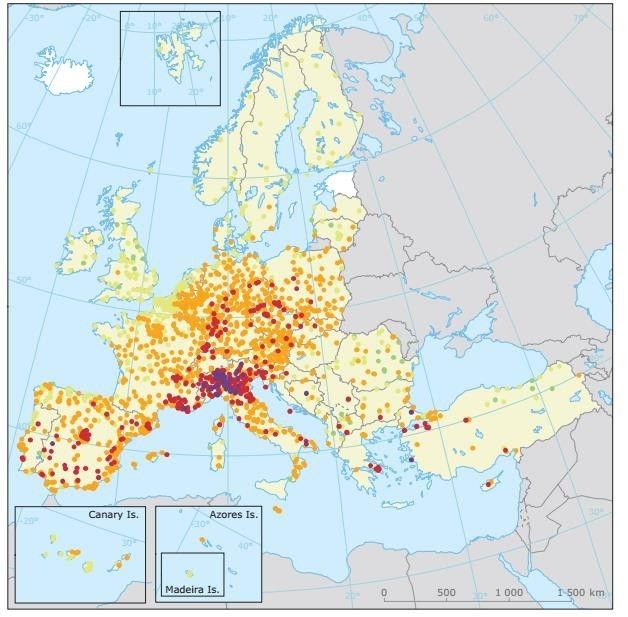
Workplan

            2016            2017             2018
      Citizen measurement campaigns of tropospheric ozone
Low-cost sensors developed
CAPTOR: RAPTOR:
metal oxide electrochemical
low-cost sensors (UPC) low-cost sensors (UCA)
Captors Raptors
Spain 25 1
Italy 10 10
Austria 0 15Low-cost sensors developed
Low-cost sensors calibration
Where to check the data?

         https://captorair.org/list/

                                       NOT for compliance-checking purposes!
Results
120 80
Maximum daily 8-h mean >100 µg/m 3 2017 Maximum daily 8-h mean >120 µg/m3 2017
2018 70 2018
100
60
Number of exceedances
Number of exceedances
80
50
60 40
30
40
20
20
10
0 0
Manlleu Vic Tona Osio Sotto Montecucco Cuneo Colli Euganei Hartberg Weiz
Manlleu Vic Tona Osio Sotto Montecucco Cuneo Colli Euganei Hartberg Weiz
Spain Italy Austria
50
Hourly mean >180 µg/m3 2017
45
2018
40
Sensor data useful to assess:
35
- Geographical variability:
Number of exceedances
30
25
Italy/Spain/Austria
20
15
- Temporal variability:
10 relative differences 2017 – 2018
5
0
Manlleu Vic Tona Osio Sotto Montecucco Cuneo Colli Euganei Hartberg WeizResults
100
Maximum daily 8-h mean >100 µg/m3 AQMS
90
2018
CAPTOR
80 RAPTOR
Number of exceedances
70
60
50
40
30
20
10
0
Manlleu Vic Tona Osio Sotto Montecucco Cuneo Colli Euganei Hartberg Weiz
Sensor data are more conservative than reference stations – no social alarm created
80
AQMS
2018 Maximum daily 8-h mean >120 µg/m3
70 CAPTOR
RAPTOR
60
Number of exceedances
50
40
30
20
10
0
Manlleu Vic Tona Osio Sotto Montecucco Cuneo Colli Euganei Hartberg WeizResults: limitations
Ripoll et al., 2019
Sensor: Sensor:
Metal oxide Electrochemical
Linear calibration Non-linear calibrationResults: limitations
Captor
Sensor performance: acceptable for mean concentrations, but not for peaks (high and low)
RaptorResults: limitations
UNIT-TO-UNIT VARIABILITY
10 Captor + 1 Raptor nodes co-located at a reference station (May-June)
Intra-unit variability increased significantly during Calibration2 period (Sept-Oct)
Cause: lower concentrations? Ageing?Uncertainties
QUANTIFICATION OF UNCERTAINTIESUncertainties
QUANTIFICATION OF UNCERTAINTIES
10-85 µg/m3
8-29 µg/m3 8-24 µg/m3Conclusions
- Ozone pollution is an issue in Southern and Central Europe, mainly
affecting rural areas
- High interannual and spatial variability
- CAPTOR: Sensors were deployed in a citizen science approach
- Ozone data obtained has good scientific quality for sensor research and
for awareness raising
- Peak concentrations not recorded by sensors
- Uncertainties = 20-40%, depending on ozone concentration
- Sensor data are more conservative than reference stations – no social
alarm createdTHANK YOU FOR YOUR
ATTENTION!You can also read